Figure 1.
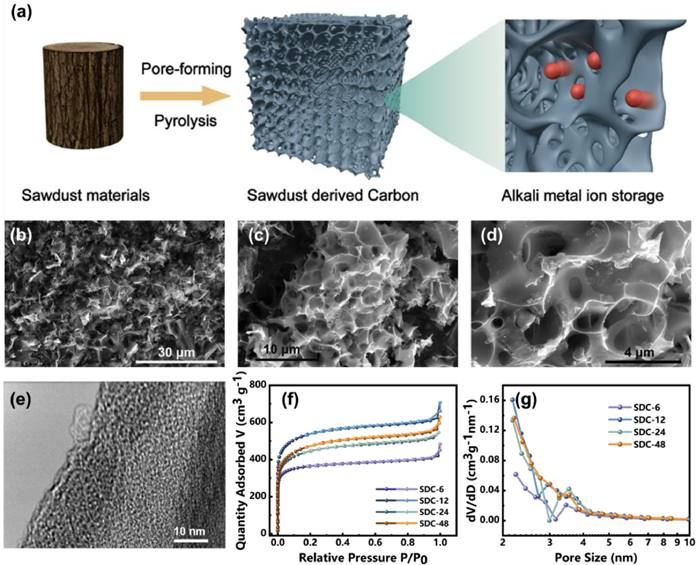
(a) Schematic illustration of production of SDC materials. (b–d) SEM images and (e) HRTEM image of SDC-12. (f, g) N2 adsorption–desorption isotherm and pore size distribution of as-prepared samples.
Differential bonding behaviors of sodium/potassium-ion storage in sawdust waste carbon derivatives
Jun-Ming Cao , Kai-Yang Zhang , Jia-Lin Yang , Zhen-Yi Gu , Xing-Long Wu

Within the realm of energy research, the exploration of alternatives to lithium-ion batteries (LIBs) has gained significant traction [1–4]. Sodium-ion batteries (SIBs) and potassium-ion batteries (PIBs) are considered prominent illustrations of the emerging "next generation batteries" technology, primarily due to the abundant availability of sodium and potassium resources [5,6]. Furthermore, it is worth noting that aluminum foil, being a cost-effective material, may serve as a suitable collector for both the cathodes and anodes in SIBs and PIBs [7]. However, the energy density level of sodium and potassium ions batteries is comparatively lower than that of lithium, mostly owing to their higher relative atomic masses [8]. Therefore, the investigation on suitable materials for sodium/potassium ions storage holds considerable significance.
At present, graphite and its derivatives serve as the predominant materials employed as anodes in LIBs [9,10]. However, the energy storage capacity of these materials in SIBs is restricted because of the heightened energy demand associated with the insertion of Na+ ions into the narrow graphite layers [11]. The cyclic stability of graphite, which is employed as the anode material in PIBs, is greatly diminished as a result of its high ionic radius, resulting in noticeable deformation of the electrode [12–15]. Hence, the development of carbon-based anodes that exhibit compatibility with both sodium/potassium storage systems could provide a solid basis for effective energy storage [16]. Porous carbon possesses several advantageous attributes, such as a substantial specific surface area, adjustable physical and chemical properties, affordability, and convenient accessibility [17]. These characteristics render it highly favorable for application in burgeoning fields such as energy storage and conversion, catalysis, and adsorption separation. An illustration of this phenomenon can be observed in the study conducted by Yu et al., wherein they recorded the synthesis of nitrogen-doped porous carbon fibers using potassium hydroxide (KOH) as a pore-forming agent obtained from polypyrrole [18]. It is possible to attain a specific surface area of 1508 m2/g and a reversible Na+ storage capacity of 296 mAh/g at a current density of 0.05 A/g. Zhang et al. prepared a hierarchical nitrogen-doped carbon materials with an accordion-like structure, which exhibited a significant reversible K+ storage capacity of 346 mAh/g [19]. At present, the primary focus in the structural design of porous carbon revolves around the enhancement of pore structure to increase the specific surface area, in addition, heteroatom doping could also be employed to augment the electrochemical capacity [20–22]. The dominant agreement within previous reports is that the major mechanism of energy storage in porous carbon is mostly attributed to adsorption [23]. In order to provide a theoretical basis for the design of porous carbon, it is essential to analyze the differential energy storage mechanism of such materials in SIBs and PIBs, which can be attributed to the unique physical and chemical properties shown by sodium and potassium ions.
Here, a porous carbonaceous network was prepared using the process of KOH etching, and then employed as anodes in both SIBs and PIBs. As-prepared carbon material exhibiting a hierarchical pore structure was achieved by the adjustment of etched time, resulting in a specific surface area of 1410.65 m2/g. When doing a comparison on electrochemical properties between SDC anodes in SIBs and PIBs, it becomes evident that SDC-12 exhibits similar level in terms of capacity, rate, and long-term cyclic stability, with the exception of diffusivity. The identification of the phase transition process of potassium carbide formation during potassium storage in SDC was achieved through the investigation of ex-situ XRD and Raman spectroscopy. Hence, this work offers an in-depth analysis of the discrepancies observed in the disordered carbon structure during the sodium and potassium storage procedures. Schematically, the conversion process of as-prepared carbon could be clearly seen in Fig. 1a, as a biomass waste, sawdust holds potential on large-scale production to feed the demand for sustainable development target. After pore-forming and pyrolysis operation, sawdust could be transformed to a porous carbon framework, and corresponding appropriate textural properties is favorable for larger radii Na/K ions storages. Firstly, the X-ray diffraction (XRD) patterns of the as-prepared SDC-12 derived from sawdust is shown in Fig. S1 (Supporting information). The SDC-12 shows two broad peaks around 25° (002 peak) and 44° (101 peak), respectively, indicating the amorphous structure [24]. The interlayer spacing (d002) is calculated to be ~0.4 nm, which is larger than that of graphite (0.334 nm) [25]. The larger spacing of carbon layer is essential for the reversible storage of alkali metal ions [26]. As shown in Fig. S2 (Supporting information), the Raman spectra exhibit two distinct bands, namely the D peak at 1340 cm−1 and the G peak at 1580 cm−1. A prominent feature of amorphous carbon can also be seen in the Raman spectra of the as-prepared material [27]. The X-ray photoelectron spectroscopy (XPS) of SDC-12 is shown in Fig. S3 (Supporting information), and the sample is mainly composed of carbon and oxygen elements. Figs. 1b–d provide scanning electron microscope (SEM) micrographs that exhibit a porous structure at the surface. The formation of porous structure could be attributed to the KOH activation reaction [26]:
|
|
(1) |
It was found from transmission electron microscope (TEM) image that the morphology of the sample is block with irregular shape and uneven thickness (Fig. S4 in Supporting information). In high resolution TEM images of Fig. 1e, the turbostatic structure can be observed, indicating its amorphous structure owing to the relatively low pyrolysis temperatures and KOH activation. The specific surface areas of SDSs are measured by N2 Brunauer–Emmett–Teller (BET) adsorption measurements. Fig. 1f shows the N2 adsorption–desorption behavior of SDC, it is evident that all samples show type-IV isotherms with a sharp adsorption knee in low pressure aeras and well-defined plateaus [28]. The adsorption observed at low pressure in the case of SDC suggests the presence of micropores, whereas the occurrence of hysteresis rings shows the existence of mesopores. The corresponding pore size distribution curves of SDCs show a hierarchical pore structure dominated by mesopores (Fig. 1g). The adsorption average pore sizes of SDC-6, SDC-12, SDC-24, and SDC-48 are 2.188, 2.264, 2.264, and 2.369 nm. The mesoporous structure not only facilitates ion transport but also provides more capacitive capacity for energy storage [29]. In addition, the total volumes of micropores obtained through the T-plot method is 0.553, 0.595, 0.586, and 0.514 cm3/g. Considering that, micropores also have a vital effect on storing alkali metal ions. The multi-point BET specific surface areas of all samples are 1191.02, 1410.65, 1366.86, and 1231.41 m2/g, respectively. The hierarchical porous structure would offer more favorable transport routes for the Na+, while the large surface area provides Na+ with more adsorption sites. Overall, a moderate activation time is beneficial for the formation of micropores and mesopores. However, owing to the partial mesopores collapse caused by excessive activation span, the specific surface area of SDC-48 is slightly lower.
The electrochemical performance of SDC samples as anode for SIBs and PIBs are evaluated in the voltage rang of 0.01–3.0 V. Fig. 2a displays the SDC-12 sample's cyclic voltammetry (CV) curves of the first three cycles at scan rate of 0.2 mV/s. In the first cathodic scan, the pronounced peak at around 1.2 V can be attributed to the reaction between surface functional groups and Na+ ions, while the peak at around 0.4 V is caused by the decomposition of the electrolyte and the formation of solid electrolyte interface (SEI) [30]. These two peaks disappear in the subsequent CV curve, proving the irreversibility of the reactions. This irreversible phenomenon of the first cycle can also be observed in the galvanostatic charge discharge curve (GCD), as shown in Fig. 2b. However, for the subsequent CV and GCD curves, their shapes remained basically consistent, proving a reversible electrochemical process. Compared to sawdust based carbon materials prepared by direct annealing (Fig. S5a in Supporting information), activated carbon materials treated with KOH exhibit better sodium storage performance, proving that porous structures can provide more sodium storage sites. Moreover, Fig. 2c demonstrates that the CV curves well maintained as the scanning rate increased, demonstrating the good stability and rate capability. The quantitative analysis of capacitive behavior can be carried out by the following equation [31]:
|
|
(2) |
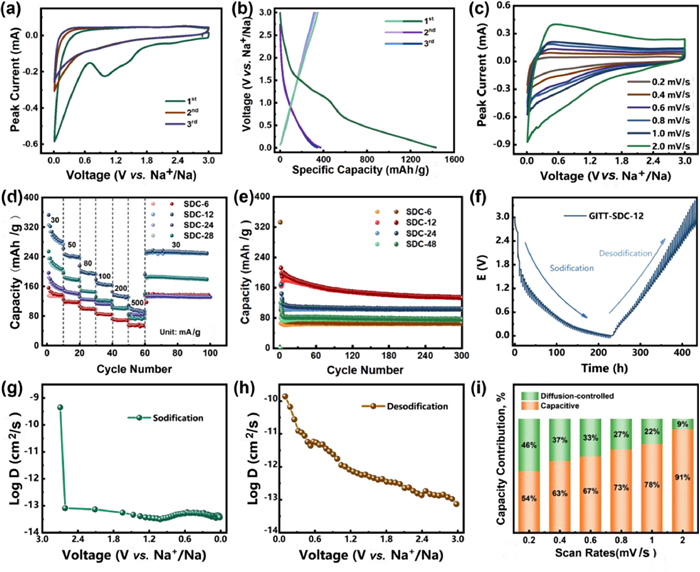
ip is the peak current and v is the scan rate. The b value could be obtained by the slope of the log(i) versus log(v) plot to determine the electrochemical processes controlled by semi-infinite diffusion (b ≈ 0.5) or capacitive process (b ≈ 1.0). As shown in Fig. S6 (Supporting information), the anodic b -value of SDC-12 for SIBs is 0.94306, indicating that the capacitive behavior is the capital capacity contribution. To enhance the clarity of the rate performance analysis, the material's capacity was assessed at several current densities. The results show that the capacities of SDC-12 sample is higher than that of other samples at all current densities. The specific capacities at the current densities of 30, 50, 80, 100, 200, and 500 mA/g of the SDC-12 electrode are 326.4, 244.5, 199.5, 168.7, 136.8, and 99.8 mAh/g, respectively (Fig. 2d). In addition, the SDC-12 still maintains a reversible capacity of 248.7 mAh/g as the current density is returned back to 30 mA/g. Fig. 2e shows the cyclic stability of SDC samples at 30 mA/g. Due to the large specific surface area of SDC samples, it can cause the formation of SEI films and the decomposition of the electrolyte during the first few cycles. After multiple cycles, the electrode interface reaches a stable state, resulting in a coulombic efficiency of nearly 100%. Benefiting by the stable carbon skeleton of porous carbon, all samples exhibit good cyclic stability with sample SDC-12 having the highest capacity [32,33].
In order to investigate the kinetic process of sodium storage, galvanostatic intermittent titration technique (GITT) testing was conducted on the SDC-12 electrode. Fig. 2f shows the voltage-capacity curves of SDC-12 with a relaxation time (τ) of 30 min. According to the calculation formula of Na-diffusion coefficients (DNa) of the SDC-12 electrode at different voltages is obtained. The DNa values of the sodification and desodification processes are shown in Figs. 2g and h, respectively. The average DNa- values of SDC-12 in the sodification and desodification process is 1.0 × 10−13.26 and 1.0 × 10−12.01 cm2/s, respectively. Furthermore, to calculate quantitatively the contribution ratio of capacitive and diffusion-controlled capacity, the Dunn's method was applied to separate the total current (i) into capacitive process (k1v) and diffusion process (k2v1/2). The equation is presented below [34,35]:
|
|
(3) |
Hence, the slope and intercept correspond to the values of k1 and k2via plotting the i(V)/v1/2versus v1/2 curve at a given voltage. The contribution rates of diffusion-controlled and capacitive capacities at 0.2–2.0 mV/s are presented in Fig. S7 (Supporting information). The diffusion-controlled and capacitive contributions to the total storage of the SDC-12 electrode at different scan rates are shown in Fig. 2i. When the sweep speed is 0.2 mV/s, the capacitive contribution is 54% of the total charge storage. As the sweep speed increases to 2.0 mV/s, the value gradually increases to 91%, resulting in the shrink of total capacity at high scan rates. This phenomenon demonstrates that the Na+ storage reactions of SDC-12 electrode are subject to both diffusion-controlled and capacitive processes.
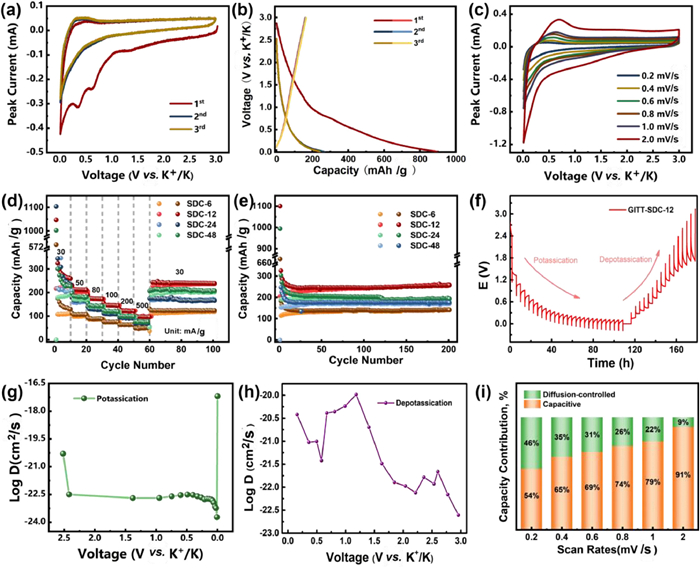
To investigate the potassium storage performance of the material, this batch of samples were used as anodes for PIBs under the same testing conditions as sodium storage. The CV (Fig. 3a) and GCD (Fig. 3b) curves of SDC-12's potassium storage are similar to sodium storage with the discharge process in the first cycle shows a high irreversible capacity, which is related to the electrolyte consumption and SEI formation caused by the large specific surface area of the SDC-12 material [36]. Compared to the GCD curve of sawdust derived carbon materials prepared by direct annealing (Fig. S5b in Supporting information), the activated carbon materials with KOH exhibit better potassium storage performance. Noting that SDC-12 in K+ storage application exhibits sharper peaks in potassication and broad peaks in depotassication at low potentials with no obvious peak coverage at high potentials (Fig. 3c). The anodic b-value of SDC-12 for PIBs is 0.87099 (Fig. S8 in Supporting information), indicating that the SDC-12 has more diffusion-controlled processes in storing potassium than storing sodium. Figs. 3d and e demonstrates that SDC-12 has better rate capability and cycling stability, respectively, compared to other samples during potassium storage. The specific capacities at the current densities of 30, 50, 80, 100, 200, and 500 mA/g of the SDC-12 electrode in PIBs are 210.6, 201.7, 171.3, 114.5, 120.6, and 95.4 mAh/g, respectively. When the current density is returned back to 30 mA/g, the specific capacity could slightly increase to 243.4 mAh/g. From the GITT test (Figs. 3f–h), the average K-diffusion coefficients (DK-) for potassication and depotassication processes are 1.0 × 10−22.49 and 1.0 × 10−21.28 cm2/s, respectively, which is lower than those of DNa-. This phenomenon indicates that the diffusion of potassium ions in SDC-12 is slower than that of sodium ions. Interestingly, by fitting the capacitive capacity contribution in CV curves at different scanning rates (Fig. 3i and Fig. S9 in Supporting information), it can be found that the proportion of capacitive capacity and diffusion-controlled capacity in the total capacity is nearly at the same level.
In addition, the reaction resistance of SDC-12 is tested via electrochemical impedance spectroscopy. The Nyquist plot and the corresponding equivalent circuit diagram are shown in Fig. S10 (Supporting information), showing two different regions with a semicircle in the high frequencies and a sloped straight line in the low frequencies [37]. The sloped line is in accordance with the alkali ion diffusion features. The slope of the low-frequency straight line of SDC-12 used for SIBs (SDC-12-Na) is greater than that of SDC-12 used for PIBs (SDC-12-K), indicating the sodium ions have better diffusion characteristics in SDC than potassium ions. The fitted electronic components include resistance of SEI (RSEI), charge transfer (Rct), solution resistance (Rs), constant phase elements (Q), and Warburg element (W). From the fitting results (Table S1), SDC-12-Na exhibits a smaller Rs of 3.21 Ω and Rct of 191.6 Ω and compared to the value of 11.4 and 406.8 Ω, respectively, for SDC-12-K, indicating a lower charge transfer resistance of Na+ in SDC.
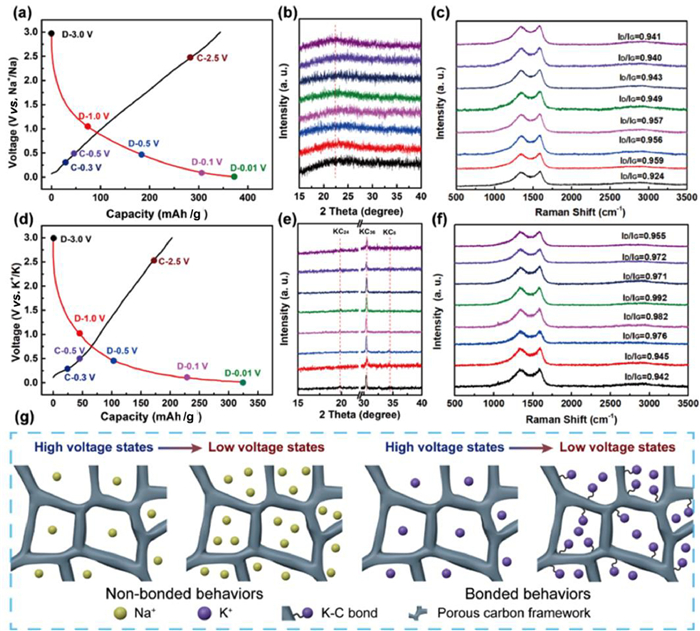
Overall, the storage of sodium and potassium in SDC is mainly through adsorption with stable electrochemical capacities of around 240 mAh/g. The electrochemical curves also exhibit typical adsorption characteristics. However, the diffusion and resistance performance of the two types of alkali metal ion storage is obviously different. Therefore, further mechanism characterization is used to investigate material changes during charging and discharging. Ex-situ XRD and Raman were employed to characterize structural changes of the SDC-12 sample during energy storage process. 3.0, 1.0, 0.5, 0.1, and 0.01 V in the discharge process and 0.3, 0.5, and 2.5 V in the charge process are selected as cut-off voltages, which are marked as D-3.0 V, D-1.0 V, D-0.5 V, D-0.1 V, D-0.01 V, C-0.3 V, C-0.5 V, and C-2.5 V, respectively (Figs. 4a and d). By observing the XRD during the sodium storage process, it was found that no other peak was observed except for the 002 peak of carbon (Fig. 4b). In addition, the 002 peak did not show significant deviation during the charging and discharging process. For potassium ion storage, it is observed in Fig. 4e that with the start of discharge, significant peaks appear at about 24.3°, 30.2°, and 34.5°, corresponding to KC24, KC36, and KC8, respectively, which indicates that K was successfully intercalate in carbon layer to form graphite intercalation compounds during the charge and discharge [38,39]. Noting that these peaks did not completely disappear after recycling, proving that it is not a completely reversible process in the first few cycles, which may be one of the reasons for the low coulombic efficiency of potassium storage for SDC. For potassium ion storage in CV curves, the platform near 0 V can be attributed to the intercalation of potassium ions into the carbon layer to form potassium carbide. However, sodium ions are difficult to enter the carbon interlayer, and there is no redox reaction near 0 V, so the plateau capacity is very small. It can be found from ex-situ Raman spectroscopy (Figs. 4c and f) that the ID/IG of the SDC electrode increases as the depth of sodification and potassication increases, which can be attributed to the adsorption or insertion of a large number of alkali metal ions leading to a greater degree of defect. For the Raman spectra of pristine SDC-12 (Fig. S2 in Supporting information), the ID/IG value is 0.923. After sodium and potassium storage, the ID/IG value of the sample increases, indicating that the adsorption or insertion of alkali metal ions can affect the polarization of carbon-carbon bonds. It is worth noting that the ID/IG generated by SDC potassium storage is generally larger than that of sodium storage, which may be due to the generation of potassium carbide causing greater damage to the carbon structure. Therefore, this is also the reason why the diffusion performance of potassium in SDC is lower than that of sodium. Vividly, the differential Na and K ions storage mechanism of as-prepare porous SDC materials could be seen in Fig. 4g. In high-voltage region, SDC matrix mainly exhibits an adsorption behavior, to store Na ions in non-bonded mechanism. As the working voltage further reduced, porous carbon can hold more Na ions but still in a non-bonded way. However, for K ions, when voltage situated at low level, there are obvious bonding behaviors between K ions and carbon, as a result, the graphite intercalation compounds (KxCy) was formed, which could be regarded as the nature of differential ions storage behaviors for carbon materials. For potassium ion storage, the platform near 0 V can be attributed to the intercalation of potassium ions into the carbon layer to form potassium carbide. However, sodium ions are difficult to enter the carbon interlayer, and there is no redox reaction near 0 V, so the plateau capacity is very small.
In summary, we have prepared porous carbon as negative electrodes in SIBs and PIBs via using sawdust as precursors and KOH as activation agents. Under the condition of activation time of 12 h, the prepared SDC-12 exhibits the best electrochemical performance. Benefiting from its large specific surface area and hierarchical pore structure, the stable capacity is about 240 mAh/g at 30 mA/g for sodium and potassium storage. In addition, the energy storage mechanism of SDC-12 is mainly dominated by adsorption, but due to the production of potassium carbide during potassium storage, it is a slower diffusion kinetics compared to sodium storage. This study provides a reference for a better understanding of the mechanism of action of sodium and potassium ions when used in carbon anodes, in order to be more helpful in the design of carbon materials.
We gratefully acknowledge the financial support from the National Natural Science Foundation of China (No. 52302222), Natural Science Foundation of Jilin Province (No. 20230508177RC), China Postdoctoral Science Foundation (Nos. 2022M720704, 2023T160094) and Fundamental Research Funds for the Central Universities (No. 2412022QD038).
Supplementary material associated with this article can be found, in the online version, at doi:
Z. Zhu, T. Jiang, M. Ali, et al., Chem. Rev. 122 (2022) 16610–16751. doi: 10.1021/acs.chemrev.2c00289
J.M. Cao, I.V. Zatovsky, Z.Y. Gu, et al., Prog. Mater. Sci. 135 (2023) 101105. doi: 10.1016/j.pmatsci.2023.101105
Y.F. Meng, H.J. Liang, C.D. Zhao, et al., J. Energy Chem. 64 (2022) 166–171. doi: 10.1016/j.jechem.2021.04.047
J.L. Yang, J.M. Cao, X.X. Zhao, et al., EnergyChem 4 (2022) 100092. doi: 10.1016/j.enchem.2022.100092
X. Chen, C. Liu, Y. Fang, et al., Carbon Energy 4 (2022) 1133–1150. doi: 10.1002/cey2.196
Y. Ding, Z.A. Qiao, Adv. Mater. 34 (2022) 2206025. doi: 10.1002/adma.202206025
K.Y. Zhang, Z.Y. Gu, E.H. Ang, et al., Mater. Today 54 (2022) 189–201. doi: 10.1016/j.mattod.2022.02.013
Y.X. Wang, S.L. Chou, H.K. Liu, et al., Carbon N Y 57 (2013) 202–208. doi: 10.1111/jipb.12032
J. Zhao, X. Zhang, M. Liu, et al., J. Mater. Chem. A 7 (2019) 21338–21348. doi: 10.1039/c9ta08077e
Z. Jian, W. Luo, X. Ji, J. Am. Chem. Soc. 137 (2015) 11566–11569. doi: 10.1021/jacs.5b06809
F. Xie, Z. Xu, A.C.S. Jensen, et al., Adv. Funct. Mater. 29 (2019) 1901072. doi: 10.1002/adfm.201901072
Y. An, H. Fei, G. Zeng, et al., J. Power Sources 378 (2018) 66–72. doi: 10.1016/j.jpowsour.2017.12.033
H.J. Liang, Z.Y. Gu, X.X. Zhao, et al., Sci. Bull. 67 (2022), 1581–1588. doi: 10.1016/j.scib.2022.07.002
X.T. Wang, Y. Yang, J.Z. Guo, et al., J. Mater. Sci. Tech. 102 (2022) 72-79. doi: 10.1016/j.jmst.2021.05.074
J. Cao, L. Wang, D. Li, Z. Yuan, et al., Adv. Mater. 33 (2021) 2101535. doi: 10.1002/adma.202101535
X.T. Wang, Z.Y. Gu, E.H. Ang, et al., Interdisc. Mater. 1 (2022) 417–433. doi: 10.1002/idm2.12041
J. Mao, D. Niu, N. Jiang, et al., J. Mater. Chem. A 8 (2020) 9768–9775. doi: 10.1039/d0ta03229h
L. Fu, K. Tang, K. Song, et al., Nanoscale 6 (2014) 1384–1389. doi: 10.1039/C3NR05374A
W. Zhang, M. Sun, J. Yin, et al., Adv. Energy Mater. 11 (2021) 2101928. doi: 10.1002/aenm.202101928
L. Wang, M. Peng, J. Chen, et al., Adv. Mater. 34 (2022) 2203744. doi: 10.1002/adma.202203744
S. Tian, D. Guan, J. Lu, et al., J. Power Sources 448 (2020) 227572. doi: 10.1016/j.jpowsour.2019.227572
H.J. Liang, Z.Y. Gu, X.Y. Zheng, et al., J. Energy Chem. 59 (2021) 589–598. doi: 10.1016/j.jechem.2020.11.039
K. Zhang, Y. Wei, J. Huang, et al., Sci. China Mater. 63 (2020) 1898–1909. doi: 10.1007/s40843-020-1371-y
Y. Sun, J. Tang, K. Zhang, et al., Nanoscale 9 (2017) 2585–2595. doi: 10.1039/C6NR07650E
H.J. Liang, B.H. Hou, W.H. Li, et al., Energy Environ. Sci. 12 (2019) 3575–3584. doi: 10.1039/c9ee02759a
L. Tao, L. Liu, R. Chang, et al., J. Power Sources 463 (2020) 228172. doi: 10.1016/j.jpowsour.2020.228172
B. Fan, J. Yan, A. Hu, et al., Carbon N.Y. 164 (2020) 1–11. doi: 10.1155/2020/8834465
B.H. Hou, Y.Y. Wang, Q.L. Ning, et al., Adv. Mater. 31 (2019) 1903125. doi: 10.1002/adma.201903125
Y. Yi, H. Ma, X. Lian, et al., InfoMat 3 (2021) 891–903. doi: 10.1002/inf2.12225
V.G. Pol, E. Lee, D. Zhou, et al., Electrochim. Acta 127 (2014) 61–67. doi: 10.1016/j.electacta.2014.01.132
D. Wang, P. Wang, B. Lu, et al., ACS Appl. Energy Mater. 4 (2021) 13593–13604. doi: 10.1021/acsaem.1c02211
F. Yu, Z. Chang, X. Yuan, et al., J. Mater. Chem. A 6 (2018) 5856–5861. doi: 10.1039/C8TA00835C
K. Zhang, Y. Xu, Y. Lin, et al., Chin. Chem. Lett. 32 (2021) 3553–3557. doi: 10.1016/j.cclet.2021.02.034
Z. Liu, L. Zhang, L. Sheng, et al., Adv. Energy Mater. 8 (2018) 1802042. doi: 10.1002/aenm.201802042
K. Zhang, Y. Lin, L. Chen, et al., Sci. China Mater. 64 (2021) 2163–2172. doi: 10.1007/s40843-020-1608-4
L. Wang, S. Li, J. Li, et al., Mater. Today Energy 13 (2019) 195–204. doi: 10.1016/j.mtener.2019.05.010
M. Peng, L. Wang, L. Li, et al., Adv. Funct. Mater. 32 (2021) 2109524. doi: 10.1002/adfm.202109524
M. Yang, Q. Kong, W. Feng, et al., Carbon N.Y. 176 (2021) 71–82. doi: 10.1016/j.carbon.2021.01.114
S. Dong, Y. Song, Y. Fang, et al., Carbon N.Y. 178 (2021) 1–9. doi: 10.1155/2021/9524705

Figure 1 (a) Schematic illustration of production of SDC materials. (b–d) SEM images and (e) HRTEM image of SDC-12. (f, g) N2 adsorption–desorption isotherm and pore size distribution of as-prepared samples.

Figure 2 (a) The first three cycles of CV curves at a scan rate of 0.2 mV/s. (b) The first three cycles of GCD curves at a current density of 30 mA/g, and (c) CV curves at various scan rates of SDC-12 for Na+ storage. (d) Rate capacities and (e) cycle performances of SDC samples. (f) GITT profiles, (g, h) Na-ion diffusion coefficient, and (i) contribution of the surface process of SDC-12.

Figure 3 (a) The first three cycles of CV curves at a scan rate of 0.2 mV/s. (b) The first three cycles of GCD curves at a current density of 30 mA/g, and (c) CV curves at various scan rates of SDC-12 for K+ storage. (d) Rate capacities and (e) cycle performances of SDC samples. (f) GITT profiles, (g, h) K+ diffusion coefficient, and (i) contribution of the surface process of SDC-12.

Figure 4 (a) GCD curves, (b) ex-situ XRD pattern, and (c) ex-situ Raman spectra of the SDC-12 electrode for Na+ storage during second discharge/charge. (d) GCD curves, (e) ex-situ XRD pattern, and (f) ex-situ Raman spectra of the SDC-12 electrode for K+ storage during second discharge/charge. (g) Schematic illustration for differential Na and K ions storage behaviors.

 扫一扫看文章

扫一扫关注我们
 DownLoad:
 下载:
下载:
 下载:
下载: