Figure 1.
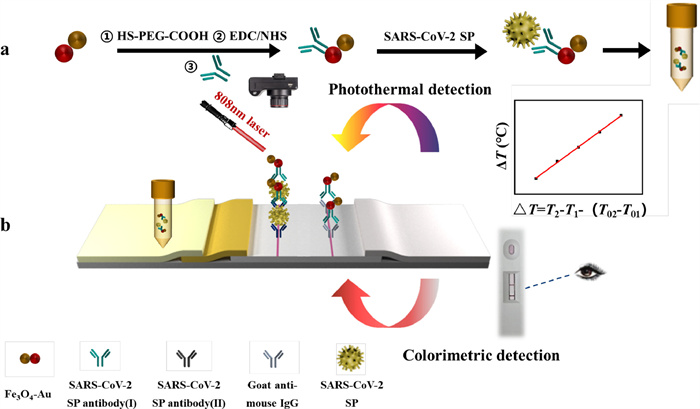
(a) Flow chart of the process of synthesis and immunization of Au-Fe3O4 NPs. (b) Graphic illustrating the LFIA's basic structure and detection mechanism.
Au-Fe3O4 dumbbell-like nanoparticles based lateral flow immunoassay for colorimetric and photothermal dual-mode detection of SARS-CoV-2 spike protein
Gengchen Guo , Tianyu Zhao , Ruichang Sun , Mingzhe Song , Hongyu Liu , Sen Wang , Jingwen Li , Jingbin Zeng

Lateral flow immunoassay (LFIA) is a paper-based platform for detecting and quantifying analytes, and results are exhibited within 5–30 min. LFIA has attracted wide interest because of its fast detection speed, ease of operation and low cost [1]. In residences, hospitals, and clinical laboratories, LFIA-based tests are commonly used for qualitative and quantitative testing of specific antigens and antibodies, as well as gene amplification products [2,3]. Therefore, LFIA technology has emerged as a highly promising techniques for quickly detecting of SARS-CoV-2 antigens, such as spike glycoprotein (S protein), confirming viral infection [4-6]. However, the limitations in sensitivity and quantitative detection of traditional LFIA make it difficult not just for early-stage disease diagnosis but also for widespread screening [7,8]. Labelling materials are considered to be important factor affect in the performance of LFIA. Colloidal gold labelling commonly used now has low sensitivity and is difficult to quantify, which seriously hinders the further application of LFIA. In recent years, nanotechnology has developed rapidly, and researchers have tried to explore diverse nano-labels as potential substitutes for colloidal gold that will increase the sensitivity of LFIA. A series of nanomaterials such as metal nanospheres [9], latex microspheres [10], fluorescent microspheres [11,12], quantum dots [13,14], superparamagnetic particles [15], and photothermal nanoparticles [16-18], have excellent properties and, when combined with colorimetric, fluorescent, Raman, magnetic, photothermal and other detection methods, they can improve the detection sensitivity and achieve quantitative detection, which has contributed to the development of LFIA. However, colorimetric and fluorescence methods are difficult to apply at extremely low viral load, and susceptible to interference from the external environment. Magnetic, Raman and other detection methods still require expensive detection instruments or cumbersome operational step, making them difficult to promote in households and communities.
Because of the localized surface plasmon resonance (LSPR) effect, metal nanoparticles have a strong absorption of photon energy and exhibit distinct color, which can be used for colorimetric or UV detection, but can only achieve semi-quantitative [19]. Moreover, when the LSPR effect occurs in nanoparticles, the absorbed light energy can be transformed into heat, and the temperature will continue to rise as heat accumulates, resulting in the photothermal effect [20]. Therefore, the excellent photothermal effect of noble metal nanoparticles is employed to increase the assay's sensitivity and quantitative capabilities. which has aroused widespread interest. Au nanoparticles (NPs) have good biocompatibility and strong LSPR effect, so they are widely used as colorimetric and photothermal materials [21-23]. However, the aggregation of Au NPs often affects the photothermal efficiency. Fe3O4 NPs also have good photothermal effects, but pure Fe3O4 has poor colloidal stability and weak absorption in the near infrared region, which limits its further application [24,25]. Au-Fe3O4 composites were created to address the shortcomings of both materials, but the traditional Au-Fe3O4 NPs is limited by its surface area and distribution, which is difficult to enhance the photothermal effect [24,26]. The design of dumbbell-like Au-Fe3O4 heterodimer nanoparticles can produce good mutual reinforcing effect while having large surface area, thereby enhancing the photothermal effect.
In this work, we obtained one-to-one dumbbell type heterodimer Au-Fe3O4 nanoparticles by etching Fe3O4 NPs with HAuCl4. The combination of these two particles can produce strong LSPR effect and photothermal effect, exhibiting superior colorimetric and photothermal performance, thereby accomplishing signal amplification to enhance sensitivity. Nanoparticles were prepared as immunoprobes by binding SARS-CoV-2 S protein antibodies, allowing colorimetric and photothermal dual-mode detection of the S protein with the LFIA platform to be developed. This technique has the potential to identify S protein in a quantitative and highly sensitive manner. And the method shows good specificity, long-term stability and anti-interference. Moreover, the technique was also effectively used to the identification of pseudovirus samples, with colorimetric and photothermal results much higher than those of commercial colloidal gold strips, which has important practical application
As shown in Fig. 1a, Au-Fe3O4 was functionalized with HS-(PEG)n-COOH and the conjugated with the S protein detection antibody to obtain the immunonanoparticles (INPs). Dual-mode test strips' basic design and operation are shown in Fig. 1b. The method relies on specific responses between the antigen and antibody. A sandwich-like structure is created when INPs bind to the S protein and the S protein is recognized by another S protein antibody on the T-line. INPs consequently deposit on the T-line, resulting in colored bands. Goat anti-human antibodies are used on the C-line to collect the free INPs as they go further for quality control. Due to the LSPR effect of INPs, qualitative detection can be performed by visual observation strips. Two bands on the T and C lines indicate a positive sample, while one band on the C line indicates a negative sample. All other results are considered invalid. For quantitative detection, 808nm near-infrared excitation and thermal infrared imager were used to measure the temperature change. Visual qualitative and instrumental quantitative analysis are both made possible by the dual signal readout of INPs.
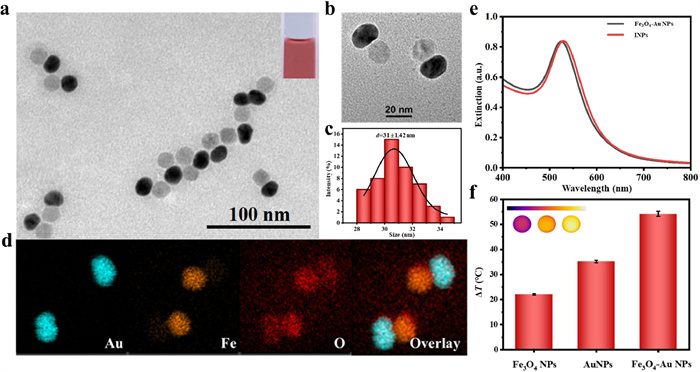
As shown in Figs. 2a and b, the typical morphology of Au-Fe3O4 NPs is one-to-one dumbbell shape with good dispersion, the color is wine-red. And the particle size is uniform, with the average size of 31±1.42 nm (Fig. 2c). Moreover, elemental analysis (Fig. 2d) reveals that the nanoparticles have identical dumbbell-like structures. After antibody modification, INPs were slightly larger than Au-Fe3O4 NPs (Fig. S1a in Supporting information). And the nanoparticles were incubated with FITC fluorescein-labelled goat anti-human antibody before and after modification of the S protein antibody, respectively, only the INPs exhibited the distinct fluorescence peak (490 nm) (Figs. S1b and c in Supporting information), indicating that the antibody was successfully coupled to the Au-Fe3O4 NPs to form INPs. As shown in Fig. 2e and Fig. S2 (Supporting information), the maximum UV absorption wavelength of Au-Fe3O4 NPs was 520 nm, which gradually enhanced with the size of the AuNPs, and the peak was slightly red-shifted after antibody modification, indicating that the antibody could maintain their optical properties without changing. In order to examine the photothermal effect of nanoparticles, the solutions of Au NPs, Fe3O4 NPs, and Au-Fe3O4 NPs were irradiated with a irradiate at 808 nm (Fig. 2f). The results showed that Au-Fe3O4 NPs had the greatest photothermal effects, followed by Au NPs and Fe3O4 NPs, indicating that the two suffixes of Fe3O4 NPs and Au NPs could provide more significant photothermal effects. Additionally, different sized Au-Fe3O4 NPs' photothermal conversion efficiency was examined (Fig. S3 in Supporting information). The photothermal conversion efficiency of the dumbbell-shaped Au- Fe3O4 NPs at 31 nm is 22.44%, which is higher than that of other nanoparticles with diameters of 20, 40, and 50 nm.
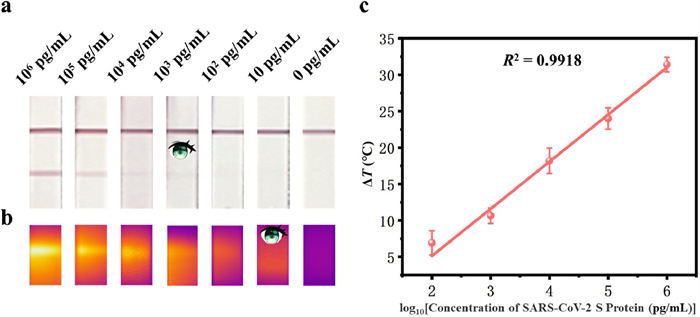
To maximize the detection efficacy of dual-mode LFIA, we optimized the detection process and determined the optimal conditions for the assay, including the photothermal excitation power of 4.44 W/cm2, the photothermal excitation time of 60 s, the concentration of nanoparticles of 0.498 mg/mL, the BSA concentration of 5% in the blocking solution, an amount of 10 µg of nanoparticle-coupled antibody, and the INPs-sample incubation time of 15 min (Fig. S4 in Supporting information). We examined the method's sensitivity and linear range under optimum conditions. As displayed in Fig. 3a, in the absence of the S protein within the sample, only the C line was visible. At 103 pg/mL S protein concentration, the T-line began to take on color, and as the concentration of the S protein increases, the color gets deeper. So, the T-line's color change allowed qualitative and semi-quantitative sample detection. Furthermore, the temperature change of the T-line caused by the photothermal effect was obtained, as depicted in Fig. 3b. And the photothermal signal intensity gradually increases as the concentration of S protein increases (Fig. 3c), showing a strong positive correlation within the range of 102 to 106 pg/mL; the fitted standard curve equation was y=6.47x+7.81, and its R2 value was 0.9918. By adding the average signal of the blank samples to three times their standard deviation (n=12), we were able to determine that the detection limit was 1.22 pg/mL, representing a 3-order decrease in magnitude compared to visual observation. In addition, we compared this dual-mode LFIA to other S protein detection methods (Table S1 in Supporting information) [27-32], which are capable of providing multiple signals in addition to colorimetric detection. In addition, the sensitivity is relatively high compared to LFIA techniques based on other materials, with the exception of Wang et al.'s method based on fluorescence signals [32]. Our method, however, simplifies the synthesis of beacon materials and the detection procedures. Therefore, this method is sensitive enough to be used to detect the S protein.
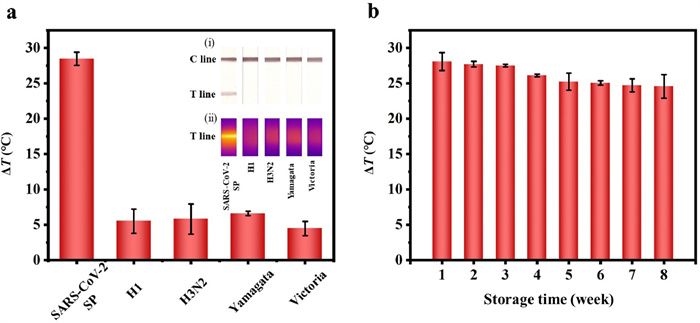
The specificity, reproducibility and stability of this method were further explored. In order to verify the specificity, we investigated the photothermal signal of several common respiratory viruses (Fig. 4a). S protein at 0.1 µg/mL can produce a strong photothermal signal. while other viruses (influenza A H3N2, influenza A H1, influenza B Victoria and influenza B Yamagata) at 5 times higher concentrations do not produce a significant signal and are essentially identical to the blank sample. This is evidence that the technique is highly specific. Next, we explored the stability of the method by examining the effect of storage time on the photothermal signal. Detection signals for the same batch of INPs and test strips stored for different weeks were obtained, as shown in Fig. 4b. After 8 weeks of storage, there was no discernible change in the intensity of the photothermal signal, proving good stability in both INPs and test strips. We next calculated the coefficient of variation (CV) within and between assays to investigate the repeatability of the method. The assay's reproducibility was demonstrated by intra-assay and inter-assay (CV) values of 6.6% and 9.64%, respectively, as shown in Table 1. In conclusion, the above results confirmed our assay's high specificity, stability, and repeatability, demonstrating that our approach is very accurate and reliable for detecting S protein.
We used 1010 copies/mL of SARS-CoV-2 S pseudovirus to simulate inactivated virus and evaluated the feasibility of this approach. After gradient dilutions, pseudovirus samples were prepared and detected using INPs-based test strips. As displayed in Fig. 5a, the colorimetric signal and photothermal signal of the method decreased as the concentration of the pseudovirus decreased, and the colorimetric detection limit was 104 copies/mL. Then, we analysed the same samples with colloidal gold test strips to verify our procedure. As shown in Fig. 5b, the colorimetric detection limit was 106 copies/mL, which was 2-order of magnitude higher than our method, indicating our method significantly better than the strips. The results demonstrate that our method possesses the capability to detect SARS-CoV-2 antigens with both sensitivity and speed, thereby showcasing its significant potential for practical application.

In conclusion, we have built a colorimetric-photothermal dual-mode LFIA platform using Au-Fe3O4 dumbbell-like nanoparticles for qualitative and quantitative detection of the SARS-CoV-2 S protein. The heterodimer Au-Fe3O4 NPs combine the photothermal properties of Au NPs and Fe3O4 NPs, producing a material with superior photothermal superposition effects, biocompatibility and stability. The photothermal LFIA is very resistant to interference and has an ultra-sensitive detection limit of 1.22 pg/mL for S protein detection, which is 3-order of magnitude more sensitive than the naked eyes. Furthermore, the process has the benefits of being simple to use, time-saving, stable, specific, and reproducible. Moreover, the approach was applied successfully to the S pseudovirus samples, outperforming conventional colloidal gold test strip. Hence, the LFIA platform with dual-mode readouts exhibits considerable promise for in situ and timely identification, thereby holding significant implication for countries or areas with limited resources. However, Au-Fe3O4 NPs have not been explored for magnetically separating samples for purification or enrichment to improve detection sensitivity. Thus, we propose optimising Fe3O4 size and Au absorption to enrich and purify target protein from the complex matrix for more sensitive detection.
The authors declare that they have no known competing financial interests or personal relationships that could have appeared to influence the work reported in this paper.
This work was supported by the Natural Scientific Foundation of Shandong (Nos. ZR2023MC039, ZR2022JQ07), the National Natural Science Foundation of China (No. 21876206), the Fundamental Research Funds for the Central Universities (No. 21CX06014A) and the Taishan Scholarship of Shandong Province (No. tsqn202211080).
Supplementary material associated with this article can be found, in the online version, at doi:
J.L. Wu, W.P. Tseng, C.H. Lin, et al., J. Infect. 81 (2020) 435–442. doi: 10.1016/j.jinf.2020.06.023
S.J. Yoo, H.S. Shim, S. Yoon, et al., J. Med. Virol. 92 (2020) 1040–1046. doi: 10.1002/jmv.25626
C.J. Atchison, M. Moshe, J.C. Brown, et al., Clin. Infect. Dis. 76 (2022) 658–666.
M. Moshe, A. Daunt, B. Flower, et al., BMJ British Med. J. 372 (2021) n423. doi: 10.1136/bmj.n423
C. Chaimayo, B. Kaewnaphan, N. Tanlieng, et al., Virol. J. 17 (2020) 256e1–256e4.
R. Diel, A. Nienhaus, Pulmonology 28 (2022) 164–172. doi: 10.1016/j.pulmoe.2021.06.009
Z.Z. Wan, Y.J. Zhao, R.F. Lu, et al., J. Med. Virol. 93 (2021) 6462–6464. doi: 10.1002/jmv.27236
K.V. Serebrennikova, N.A. Byzova, A.V. Zherdev, et al., Biosensors 11 (2021) 510. doi: 10.3390/bios11120510
P.H. Liang, Q. Guo, T.Y. Zhao, et al., Anal. Chem. 94 (2022) 8466–8473. doi: 10.1021/acs.analchem.2c01286
L. Shen, Q.H. Zhang, X.L. Luo, et al., J. Clin. Lab. Anal. 35 (2021) e24091. doi: 10.1002/jcla.24091
C.Y. Zhang, L. Zhou, K. Du, et al., Front Cell Infect Microbiol. 10 (2020) 553837. doi: 10.3389/fcimb.2020.553837
M. Feng, J. Chen, J.N. Xun, et al., ACS Sensors 5 (2020) 2331–2337. doi: 10.1021/acssensors.0c00927
Q. Zhang, J.H. Li, Y. Li, et al., Biosens. Bioelectron. 202 (2022) 113978. doi: 10.1016/j.bios.2022.113978
Z. Xie, S. Feng, F. Pei, et al., Anal. Chim. Acta 1233 (2022) 340486. doi: 10.1016/j.aca.2022.340486
D.B. Wang, B. Tian, Z.P. Zhang, et al., Biosens. Bioelectron. 67 (2015) 608–614. doi: 10.1016/j.bios.2014.09.067
W.B. Hao, Y. Huang, L. Wang, et al., ACS Appl. Mater. Interfaces 15 (2023) 9659–9668.
T.Y. Zhao, P.H. Liang, J.Q. Ren, et al., Anal. Chim. Acta 1255 (2023) 341102. doi: 10.1016/j.aca.2023.341102
G. Zhang, H. Hu, S. Deng, et al., Biosens. Bioelectron. 225 (2023) 115090. doi: 10.1016/j.bios.2023.115090
T.P. Xu, Z.X. Geng, Biosens. Bioelectron. 174 (2021) 112850. doi: 10.1016/j.bios.2020.112850
J.B. Cui, R. Jiang, C. Guo, et al., J. Am. Chem. Soc. 140 (2018) 5890–5894. doi: 10.1021/jacs.8b00368
M.Q. He, Y.L. Yu, J.H. Wang, Nano Today 35 (2020) 101005. doi: 10.1016/j.nantod.2020.101005
S. Jo, P. Verma, Y. Kuwahara, et al., J. Mater. Chem. A 5 (2017) 21883–21892. doi: 10.1039/C7TA07264C
L.H. Su, H.L. Hu, Y.L. Tian, et al., Anal. Chem. 93 (2021) 8362–8369. doi: 10.1021/acs.analchem.1c01487
S.H. Wang, Y. Zhang, Y.J. Li, et al., Mater. Des. 205 (2021) 109707. doi: 10.1016/j.matdes.2021.109707
A.A. Barzinjy, S.M. Hamad, V.M. Faris, et al., Biomater. Sci. 11 (2023) 3656–3668. doi: 10.1039/d2bm02132c
D. Jishkariani, Y.T. Wu, D. Wang, et al., ACS Nano 11 (2017) 7958–7966. doi: 10.1021/acsnano.7b02485
S. Mohammad, Y.X. Wang, J. Cordero, et al., Front. Immunol. 14 (2023) 15–27.
J.H. Lee, M. Choi, Y. Jung, et al., Biosens. Bioelectron. 171 (2021) 10–20. doi: 10.4163/jnh.2021.54.1.10
T. Dong, X. Zhang, J.L. Yuan, et al., Anal. Chem. 95 (2023) 12532–12540. doi: 10.1021/acs.analchem.3c02821
D. Liu, C.H. Ju, C. Han, et al., Biosens. Bioelectron. 173 (2021) 8–16.
K.V. Serebrennikova, N.A. Byzova, A.V. Zherdev, et al., Biosensors 11 (2021) 14–28.
C.W. Wang, X.D. Cheng, L.Y. Liu, et al., ACS Appl. Mater. Interfaces 13 (2021) 40342–40353. doi: 10.1021/acsami.1c11461

Figure 1 (a) Flow chart of the process of synthesis and immunization of Au-Fe3O4 NPs. (b) Graphic illustrating the LFIA's basic structure and detection mechanism.

Figure 2 Characterization of Au-Fe3O4 NPs. (a, b) Morphological features of the NPs depicted in the TEM images. The inset was the solution of Au-Fe3O4 NPs. (c) Size distribution of Au-Fe3O4 NPs. (d) EDX element mappings of Au, Fe, O and their overlay. (e) The UV−vis spectra of Au-Fe3O4 NPs and INPs. (f) The temperature at which different nanomaterials are irradiated under 808 nm infrared light.

Figure 3 (a) Images of test strips for various SARS-CoV-2 S protein concentrations (the eye represented the detection limit of the visual observation). (b) Thermal infrared images of test strips for various amounts of SARS-CoV-2 S protein. (c) SARS-CoV-2 detection linear response at concentrations ranging from 102pg/mL to 106 pg/mL. Three experiments are used to calculate the error bars.

Figure 4 (a) Histogram of intensities of photothermal signal obtained from samples containing various viruses. (b) Histogram of intensities of photothermal signal obtained from S protein samples stored at different times. Three experiments are used to calculate the error bars.

Figure 5 (a) Analyzing performance of dual-mode LFIA for SARS-CoV-2 S pseudovirus. (b) Colloidal gold test strips' detection results for SARS-CoV-2 S pseudovirus.

 扫一扫看文章

扫一扫关注我们
 DownLoad:

 下载:
下载: