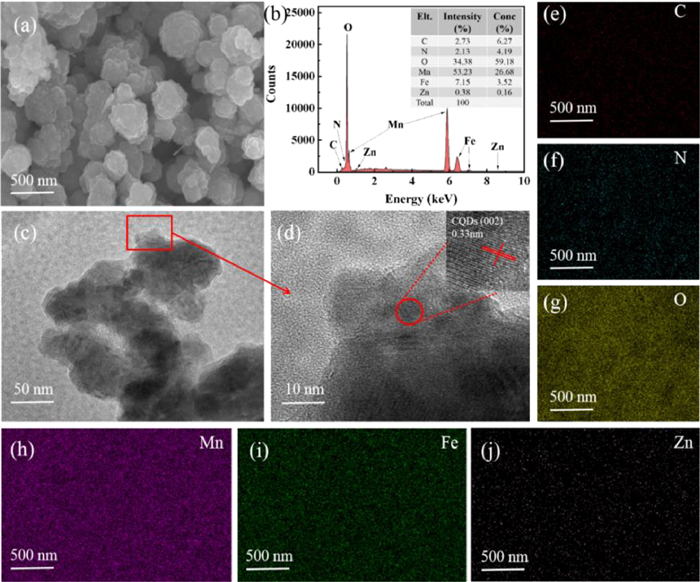
Figure 1.
(a) SEM image, (b) EDS spectra, (c, d) HRTEM images and (e-j) elemental mapping of CQDs-MFO@ZIF-8 nanocomposites.
Effective peroxydisulfate activation by CQDs-MnFe2O4@ZIF-8 catalyst for complementary degradation of bisphenol A by free radicals and non-radical pathways
Shuo Li , Xinran Liu , Yongjie Zheng , Jun Ma , Shijie You , Heshan Zheng

Bisphenol A (BPA) has been used widely as raw material in the production of epoxy resin, polycarbonate and polyoxyphenol. As one type of important emerging organic pollutants, BPA and its degradation intermediates pose a great threat to ecology and human health [1], due to the effect on carcinogen, malformation and mutation even at low concentration [2]. BPA and relevant intermediates have been detected widely in both natural and engineered water systems, soil environment, mammals and food [3,4]. Within this context, developing efficient methods for BPA removal and intermediates will be essential for securing water quality and protecting the environment and human health.
Advanced oxidation processes (AOPs) such as photocatalysis [5], Fenton oxidation [6,7] and electrochemical oxidation [8] based on hydroxyl radical (•OH) have been accepted widely for removal of recalcitrant organic pollutants. However, the photocatalytic process is limited by narrow absorption range of ultraviolet light and low utilization efficiency of visible light. Fenton process is subject to the shortage of production of ferric sludge and need for low pH. High energy consumption and operational cost limit the application of electrocatalytic technology. Compared with •OH-based processes, sulfate radical (SO4•−) (E0 = 2.6 V) is more advantageous by virtue of higher chemical stability, lower cost and longer half-life of reactive species in solution [9]. Nonetheless, PDS is needed to be activated by heating, ultraviolet, microwave and transition metal to produce highly active SO4•−. To enhance the practical applications of PDS, it will be desirable to develop the catalysts with high efficiency, non-toxicity and good stability for effective activation of PDS.
Zeolitic imidazolate frame work-8 (ZIF-8) represents a kind of unique organic-inorganic crystalline porous material with good chemical stability, large surface area, and high thermal stability. It has been used for photocatalysis, Fenton reaction as well as persulfate-based oxidation system [10]. In order to further improve the performance of catalytic activation of persulfate, CQDs with surface affinity of metal-carbon composites [11] were developed to increase the chemical stability of the catalyst and the number of exposed active sites [12]. In the photocatalytic system, for example, the excellent up-conversion photoluminescence characteristics of CQDs are revealed capable of promoting the transfer of photo-generated electrons for improved light utilization [13]. Besides that, Liu et al. prepared carbon quantum dot oxygen-rich titanium dioxide nanosheets (CQD-OTNs) composites for degradation of tetracycline (TC) under visible-light irradiation [14]. Doping of carbon dots could effectively separate the photo-generated electron-hole pairs in TiO2, thus further improved the photocatalytic activity. Likewise, the CQDs can also provide more active sites and electron transfer pathways for activation of PDS.
In this study, ZIF-8 carrier, CQDs, iron and manganese ions co-doped composite catalyst were synthesized for activation of PDS to remove emerging organic pollutant (BPA). The morphology, structure and properties of modified ZIF-8 via CQDs doping were investigated. The catalytic performances of CQDs doping ZIF-8 were examined. The main catalytic oxidation active species were analyzed via quenching test and electron paramagnetic resonance (EPR). In addition, the ecological environment security of this system was evaluated through analyzation the intermediate products of BPA via ECOSAR software and actual toxicity experiments (E. coli and Chlorella sorokiniana). The aim is estimate whether CQDs-MFO@ZIF-8/PDS process has enough safe in water environmental for application.
ZIF-8 was obtained by dissolving a mixture of 0.461 g Zn(NO3)2•6H2O and 5.5 g 2-methylimidazole in 20 mL deionized water (DI-wanter), stirring for 6 h, and drying at 60 ℃ for 12 h To prepare CQDs-MFO@ZIF-8, 0.1 g ZIF-8, 10 mL CQDs [15], 5.40 g MnCl2•4H2O and 1.98 g FeCl3•6H2O were dissolved in 20 mL water to obtain solution a. 0.1 g of sodium dodecyl sulfate (SDS) was dissolved in 10 mL of water to obtain solution B. Solutions A and B were mixed and stirred for 10 min to obtain a mixed solution. 10 mL NaOH (8 mol/L) solution was added dropwise in the mixture (A and B) to obtain the suspension with stirrer for 30 min. Finally, the obtained suspension was transferred to a Teflon-lined stainless-steel autoclave and heated at 180 ℃ for 10 h The product was repeated wash six times using deionized water and absolute ethanol and dried overnight in an oven at 60 ℃. Subsequently, the solid mixture was grinded, and heated in a tube furnace at 400 ℃ for 2 h with a heating rate of 10 ℃/min in N2 atmosphere to obtain the used catalyst.
The crystalline phase was examined by an X-ray diffraction analyzer (XRD, Rigaku, RXIII) on a D/MAX-2500 unit with Cu Kα radiation (λ = 1.54056 Å). A scanning electron microscope (SEM) (S-4800, Hitachi, Japan) with energy dispersive spectrum analysis (EDS) at 5.0 kV was used to observe the surface morphology of the samples. The surface functional groups were detected via Fourier Transform Infrared (FT-IR) spectrometer, which were obtained from a GX spectrophotometer (PerkinElmer, USA). The electrochemical performance of catalyst was tested by CHI660E electrochemical station in Na2SO4 solution (0.2 mol/L). 5.0 mg catalyst and 50 µL 5 wt% Nafion solution were added to 5 mL ethanol solution and sonicated for 120 min to prepare homogeneous suspension. The catalyst was used as the working electrode, Pt sheet as the counter electrode and Ag/AgCl as the reference electrode. Surface chemical states of the elements and functional groups of fresh and used composite materials were identified with X-ray photoelectron spectroscopy (XPS) (Kratos, Japan) with Al Kα source (hv = 1486.6 eV).
The catalytic performances of CQDs-MFO@ZIF-8 nanocomposites were investigated through PDS activation for BPA degradation. In order to reach the adsorption desorption equilibrium, 1.0 g/L catalyst (i.e., ZIF-8, MFO, MFO@ZIF-8, CQDs@ZIF-8, CQDs-MFO, CQDs-MFO@ZIF-8) was dispersed into 100 mL BPA solution (20 mg/L) to stir for 30 min. Subsequently, the solution was heated to 60 ℃ through a water bath and PDS at an initial concentration of 4 mmol/L was added to start the reaction. Samples were collected at predetermined time intervals and filtered through a 0.22 µm membrane for further analysis. To assess the reusability of the catalyst, it was collected by centrifugation at the end of the reaction, washed three times with deionized water, and dried in vacuum for the next cycle BPA degradation experiment. For the degradation experiments in different water bodies, tap water and river water from water company and Nenjiang in Qiqihar, China were used to dispose BPA solutions. The pH of the system was adjusted by 0.5 mol/L NaOH and HCl. The analytical methods and toxicity assessment are provided in Text S1 and Text S2 (Supporting information) respectively.
Fig. 1a shows that the magnetic CQDs-MFO@ZIF-8 nanocomposite presents an approximately spherical nanostructure with uniform size and regular shape. Fig. 1b shows the EDS results of CQDs-MFO@ZIF-8 containing manganese, iron, zinc, oxygen, carbon and nitrogen, accounting for 56.60%, 20.76%, 12.61%, 5.27%, 3.18% and 1.63% respectively. Fig. 1c is a high-resolution transmission diagram of the composite catalyst, and the image in the box is enlarged to obtain Fig. 1d. It can be observed that the lattice stripe line spacing of 0.33 nm corresponds to the (002) crystal plane of CQDs [16], indicating that CQDs has been completely compounded on the catalyst. The element distribution diagram (Figs. 1e-j) proved that the elements were uniformly distributed on CQDs-MFO@ZIF-8.
The crystal structure of CQDs-MFO@ZIF-8 was characterized by using X-ray diffraction (XRD) technique. As shown in Fig. 2a, for synthetic CQDs-MFO@ZIF-8, based on JCPDS No. 74–2403 in the Inorganic Crystal Structure Data Base, the diffraction peaks at 18.2°, 29.98°, 35.5° and 62.42° corresponded to the (111), (220), (311) and (400) crystal plane of MFO [17], whereas the diffraction peaks at 25.9° respectively corresponded to the (002) crystal plane of CQDs [18]. The diffraction peaks at 7.5° should be ascribed the (220) planes of ZIF-8 [19]. Therefore, the CQDs-MFO@ZIF-8 nanocomposites were successfully prepared.
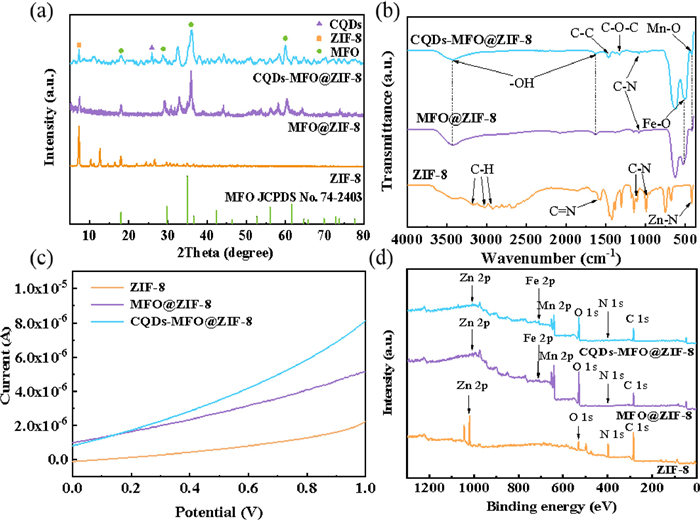
The FT-IR spectra of ZIF-8, MFO@ZIF-8 and CQDs-MFO@ZIF-8 (Fig. 2b) reveal the characteristic peaks of imidazole including the saturated hydrocarbon C—H (CH3) antisymmetric stretching vibration, C—H (CH2) antisymmetric stretching vibration and C=N stretching vibration at 1571.26 cm−1, 3021.54 cm−1 and 2924.42 cm−1, respectively [20]. When MFO and CQDs were doped into ZIF-8, the absorption peaks at 1627.80 cm−1 and 3430.57 cm−1 were assigned to -OH vibration of oxygen and carbon bonds [21]. Notably, CQDs enhanced the O—H vibration of MFO@ZIF-8 and showed C—C and C—O-C stretching vibrations at 1467.88 cm−1 and 1331.68 cm−1 [22,23]. Moreover, the absorption peaks at 421.20 cm−1 and 500.57 cm−1 should be attributed to Mn-O and Fe-O stretching, respectively [24].
In this paper, the contribution of electron transfer pathway to BPA degradation in CQDs-MFO@ZIF-8/PDS system was also discussed by linear voltammetric scanning (LSV). As shown in Fig. 2c, under the same voltage, compared with pure ZIF-8 and MFO@ZIF-8, CQDs-MFO@ZIF-8 has higher current response and more electron transfer, and the current increases with the rapid and continuous increase of voltage in the positive voltage range. More electron transfer can directly affect the reaction rate on the catalyst surface, especially enhance the transformation between Mn2+/Mn3+/Mn4+ and Fe2+/Fe3+for generation more reactive oxygen species [25,26].
To further investigate the chemical composition and electronic state of CQDs-MFO@ZIF-8 nanocomposite, XPS measurements were performed. As shown in Fig. 2d, the measured spectra of CQDs-MFO@ZIF-8 revealed the coexistence of C 1s, O 1s, Fe 2p, Mn 2p, N 1s and Zn 2p characteristic peaks. As shown in Fig. S1 (Supporting information), both surface chemistry and electronic state demonstrated a prominent change after CQDs were doped. Compared with MFO@ZIF-8 (surface oxygen content = 33.01%; absorbed oxygen content = 8.04%), the surface oxygen content (38.32%) and absorbed oxygen content (10.11%) of CQDs-MFO@ZIF-8 are significantly increased. There are three characteristic peaks at 283.98 eV, 285.71 eV and 287.93 eV, which correspond to C—C, C—O and C=O respectively, which proves the existence of CQDs. In addition, the Fe3+ content was increased to 52.7% along with decrease in Fe2+ content to 47.3% at the state of 2p3/2 at binding energy of 710.18 eV. Likewise, the intensity of three separate characteristic peaks at 640.17 eV, 641.49 eV and 643.84 eV were attributed to Mn2+, Mn3+ and Mn4+ [27]. This indicated the improved photoelectrochemical property of MFO@ZIF-8 by doping CQDs in the favor of ROS production for pollutant removal.
To further investigate the improved catalytic activity by CQDs to activate PDS (4 mmol/L) for degradation BPA (20 mg/L), ZIF-8, CQDs, CQDs@ZIF-8, MFO@ZIF-8 and CQDs-MFO@ZIF-8 were studied and compared. As shown in Fig. 3a, the adsorption-desorption equilibrium (15%) could be established between BPA and the catalyst within a period of time for 30 min. In the absence of catalyst, the removal of BPA by PDS alone is only 10% in the first 5 min, which can be ignored. Loading MFO and CQDs onto ZIF-8 led to increase in removal of BPA from 28.85% to 96.50%. The reaction kinetics was in good accordance with the removal efficiency of BPA following the order of CQDs-MFO@ZIF-8 (0.613 min−1) > MFO@ZIF-8 (0.334 min−1) > CQDs@ZIF-8 (0.217 min−1) > ZIF-8 (0.026 min−1) > CQDs (0.020 min−1) as shown in Fig. 3b. Obviously, CQDs made an enhanced contribution to improved catalytic activity of MFO@ZIF-8 for PDS activation and BPA removal.
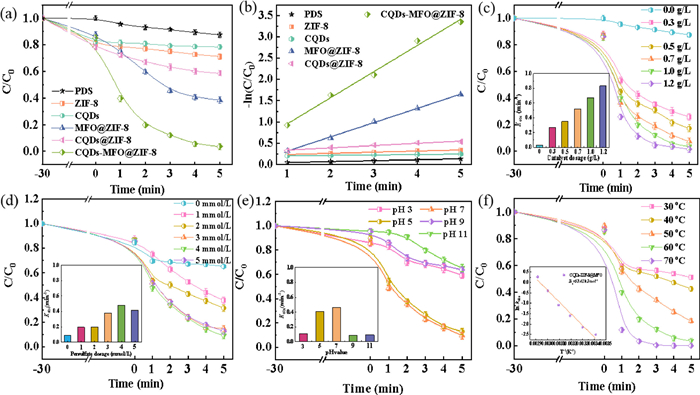
Fig. 3c illustrates the impact of catalyst dosage (0.3, 0.5, 0.7, 1.0 and 1.2 g/L) on degradation of BPA. The BPA removal was increased from 74.10% to 98.45% with the increase in CQDs-MFO@ZIF-8 dosage from 0.3 g/L to 1.2 g/L, accounting for the highest oxidation rate constant kobs of 0.67 min−1 obtained at the catalyst dosage of 1.0 g/L. This could be explained in the context of the structure-activity relationship that higher-dosage catalyst provided more active sites for PDS activation. On the basis of the dosage of 1.0 g/L for CQDs-MFO@ZIF-8 nanocomposite, the maximum BPA removal of 96.5% could be reached.
We next investigated the impact of PDS concentration on generation of ROS by catalytic activation and removing efficiency. As shown in Fig. 3d, when PDS concentration was increased in the range of 0–5 mmol/L, BPA degradation efficiency was increased first from 34.74% to 96.50%, followed by observation of being inhibited to 87.45%. The most likely reason might be scavenging effect of SO4•− radicals caused by higher-concentration PDS (Eqs. 1 and 2) [28]. The kobs value for BPA degradation was increased significantly with the increase in PDS concentration, until excessive PDS presented inhibition on the reaction and then decreased, which was consistent with the results of BPA removal. In the CQDs-MFO@ZIF-8/PDS system, the PDS concentration of 4 mmol/L was adopted for subsequent tests.
|
|
(1) |
|
|
(2) |
We also examined the impact of initial pH (3–11) to degradation of BPA. Fig. 3e shows that the pH in the range of 3–7 was positively correlated with the degradation of BPA, indicated by the increase of BPA removal efficiency from 40.8% to 90.2% within 5 min. The kinetic constants at different pH values were also different, and the degradation rate constant kobs at pH 7 was the highest (0.46 min−1). With regard to the impact of pH, the H+ can react with both •OH and SO4•− under acidic conditions, which slows down BPA degradation rate according Eqs. 3 and 4. However, both degradation efficiency and kinetic constant were decreased slightly, when the pollutant is alkaline. On the one hand, because the reactive activity of SO4•− is higher than that of •OH, SO4•− can react with OH− to form •OH under weak alkaline conditions indicated by Eq. 5, leading to decline in BPA removal efficiency [29]. On the other hand, it is necessary to determine the point of zero charge (pHPZC) of catalyst to study the behavior of catalyst and pollutants at different pH values. As shown in Fig. S2 (Supporting information), the prepared CQDs-MFO@ZIF-8 nanocomposites have a pHPZC of 8.33. It is reported that the pKa1 value and pKa2 value of BPA are 9.6 and 10.2 respectively [30]. However, when the pH is greater than 9.6, the surface of CQDs-MFO@ZIF-8 nano-material is negatively charged, and BPA forms an anionic form, which is difficult to be adsorbed on the surface of CQDs-MFO@ZIF-8 nano-material due to electrostatic repulsion, thus inhibiting the reaction.
|
|
(3) |
|
|
(4) |
|
|
(5) |
Temperature is an important factor that affects thermodynamic and kinetic feature of BPA degradation under the synergistic action among CQDs-MFO@ZIF-8/PDS. When temperature was increased from 30 ℃ to 70 ℃, BPA removal efficiency was increased from 48.9% to almost 100% within 5 min (Fig. 3f), indicating accelerated PDS activation and BPA degradation promoted by elevated temperature. This is due to the fact that higher temperature increased the frequency of intermolecular collisions to accelerate the reaction rate [31]. The degradation efficiency of BPA degradation remained almost unchanged when the initial reaction temperature was varied from 60 ℃ to 70 ℃. Therefore, 60 ℃ was chosen as the optimum reaction temperature for the degradation of BPA. In addition, the relationship between reaction rate constant and temperature was established, and the activation energy of BPA degradation was calculated by Arrhenius equation (Eq. 6).
|
|
(6) |
where A is the frequency factor, T (K) is the thermodynamic temperature and R (8.314 J mol−1 K−1) is the ideal molar gas constant. With lnkobs as the ordinate and 1/T as the abscissa, the results are shown in the inset of Fig. 3f, with the 53.24 kJ/mol Ea value in the CQDs-MFO@ZIF-8/PDS system [32]. The low Ea value could influence molecular structure of the contaminant and the reaction conditions on improvement activation PDS and oxidation contaminant [33].
The above results confirmed the enhanced performance of PDS activation and BPA removal by CQDs-MFO@ZIF-8 nanocomposite. Then, we performed quenching tests by using furfuryl alcohol (FFA, scavenger of 1O2), ethanol (EtOH, scavenger of •OH and SO4•−), benzoquinone (BQ, scavenger of •O2−) and tertiary butyl alcohol (TBA, scavenger of •OH) [34]. As shown in Fig. 4a, BPA degradation efficiency was 41.89%, 79.19%, 84.95% and 94% when FFA (0.1 mol/L), EtOH (0.4 mol/L), BQ (0.1 mol/L) and TBA (0.4 mol/L) was added into the system, respectively. This result suggested the CQDs-MFO@ZIF-8/PDS system to be more likely dominated by non-radical 1O2, and the radicals such as •OH, SO4•− and •O2− might play a secondary role. Moreover, adding FFA resulted in a significant inhibition on BPA degradation indicated by removal efficiency as low as 41.89%. The illustration in Fig. 4a also shows that the degradation rate of BPA decreases after adding FFA (0.109 min−1), which is far less than that of adding other quenchers (0.314 min−1, 0.379 min−1 and 0.563 min−1). All these indicate that 1O2 is the main ROS responsible for BPA degradation.
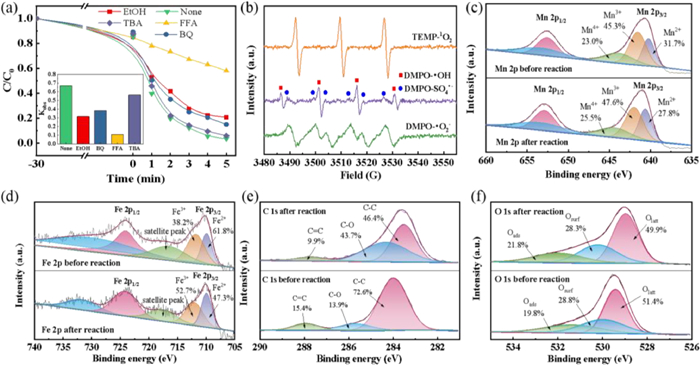
To further confirm this result, we investigated the ROS formation by carrying out EPR measurement with DMPO serving as spin-trapping agent for •OH, SO4•− and •O2− and TEMP serving as spin-trapping agent for 1O2. Clearly visible is in Fig. 4b that the characteristic three-peak signals of TEMP-1O2 were observed, indicating the formation of 1O2 in the system. In addition, obvious signals of •O2−, •OH and SO4•− were also found. However, no obvious signals were found in sole PDS system as shown in Fig. S3 (Supporting information). That is, CQDs-MFO@ZIF-8 could facilitate PDS activation for generation of both free radical and non-radical ROS to dominate degradation of BPA.
In order to further determine the dominant role of 1O2, D2O was used as solvent to replace H2O in the experiment. The removal ratio of BPA was reached almost 100% within 4 min in Fig. S4 (Supporting information). The main reason was the lifetime of 1O2 in D2O (20–32 µs) system was ten times longer than that in H2O (2 µs) system. In addition, the utilization rate of PDS was investigated as shown in Fig. S5 (Supporting information). The degradation rate of BPA reached 96.5% in 5 min, while the PDS removal efficiency was 72.54%. The contribution rate of each reactive oxygen species were as follows: 1O2 (44.8%) > •O2− (24.83%) > SO4•− (21.22%) > •OH (9.15%) (Table S1 and Text S3 in Supporting information). It further indicated that 1O2 had occupied the dominant position in the CQDs-MFO@ZIF-8/PDS system.
The samples of CQDs-MFO@ZIF-8 before and after the reaction were characterized by XPS analysis, and the catalytic process was further clarified. In Fig. 4c, for Mn 2p3/2 in fresh CQDs-MFO@ZIF-8, the spectrum can be divided into three separate peaks at 640.17 eV, 641.49 eV and 643.84 eV, attributed to Mn2+, Mn3+ and Mn4+ with relative intensities of 31.7%, 45.3% and 24.0%, respectively [27]. The relative composition of Mn2+ decreased to 27.8% after the reaction, while the relative composition of Mn3+ and Mn4+ increased to 47.6% and 25.5%, respectively. This indicates that the valence state of Mn has changed obviously during the catalytic process, and Mn2+ is transformed into Mn3+ and Mn4+ on the catalyst surface [35,36].
As shown in Fig. 4d, the pre-reaction Fe 2p spectrum had two peaks at 710.18 eV and 724.06 eV, belonging to Fe 2p3/2 and Fe 2p1/2, respectively, thus demonstrating that the Fe species on the surface of CQDs-MFO@ZIF-8 were Fe3+ and Fe2+ with relative contents of 38.2% and 61.8%, respectively. After the degradation reaction, the relative content of Fe3+ on the surface of CQDs-MFO@ZIF-8 increased to 52.7%, while the relative content of Fe2+ decreased to 47.3% [37]. This indicated that the transformation from Fe2+ to Fe3+ occurred on the surface of the composite catalyst.
Fig. 4e shows the high-resolution XPS spectrum of C 1s before and after the reaction, which shows that the change of the relative content of oxygen-containing functional groups such as C—C, C—O and C=C has a positive effect on the generation of reactive oxygen species [22,38]. As shown in Fig. 4f, the O 1s peaks was deconvoluted into three spectral bands at 528.95 eV, 530.20 eV and 531.98 eV in fresh CQDs-MFO@ZIF-8, indicating lattice oxygen (Olatt), the hydroxide in surface hydroxyl groups (Osurf) and physically adsorbed H2O (Oads) on the catalyst surface, respectively [27,39]. Before reaction, the corresponding relative contents were calculated to be 51.4%, 28.8% and 19.8%, respectively. After degradation, the relative content of lattice oxygen decreased to 49.9%, the relative content of surface oxygen decreased to 28.3% and the relative content of adsorbed oxygen increased from 19.8% to 21.8%, respectively, indicating that all oxygen species were involved in the catalytic reaction [27]. Considering that the absorbed oxygen may play a vital role in the oxidation process, it means that CQDs-MFO@ZIF-8 can activate PDS more effectively. The oxygen-containing functional groups such as C—C, C—O and C = C contributed positively to the generation of reactive oxygen species [22,38]. The increase in adsorbed oxygen suggest that lattice oxygen is involved in the redox conversion between Mn4+/Mn3+/Mn2+ and Fe3+/Fe2+ [40]. The reduction in lattice oxygen may be due to oxidation involving higher valent manganese and its reduction to lower valent manganese [36].
Based on the above results, we proposed the mechanism of BPA degradation by CQDs-MFO@ZIF-8/PDS in PDS activation. Firstly, S2O82− is adsorbed on the active site of the CQDs-MFO@ZIF-8 nanocomplex and then reacts with Mn2+/Mn3+/Fe2+ to undergo an electron transfer process, which in turn converts to the active species SO4•− (Eq. 7). At the same time, Mn3+/Mn4+/Fe3+ will react with S2O82− to be reduced to the low-valence state and continue to participate in the formation of SO4•− (Eq. 8). SO4•− reacted with H2O to generate •OH (Eq. 9), and the excess S2O82− will react with OH− to form HO2− and then to form •O2− (Eqs. 10 and 11). There are two sources of 1O2 generation, one is the further disproportionation of •O2− formation, and the other is the direct formation of S2O82− reaction with OH− (Eqs. 12 and 13). These reactive species are involved in the degradation of BPA (Eq. 14).
|
|
(7) |
|
|
(8) |
|
|
(9) |
|
|
(10) |
|
|
(11) |
|
|
(12) |
|
|
(13) |
|
|
(14) |
To further investigate the water decontamination of CQDs-MFO@ZIF-8 under practically relevant conditions, various inorganic anions (NaCl, NaNO3, NaHCO3, Na2SO4 and HA) were added into DI-water to evaluate the performance of PDS activation and BPA removal. As illustrated in Fig. 5a, when SO42− and HA were added, the BPA removal efficiency was slightly decreased by 11.00% and 7.85%, because SO42− and HA competed with BPA for active free radicals. This led to unnecessary reaction to consume free radicals [41]. Compared with the blank test, Cl− and NO3− had insignificant impact to degradation rate of BPA, possibly due to strong oxidation performance of the system. On the contrary, HCO3− can act as a radical quencher for during removal of BPA via consuming SO4•− and •OH (Eqs. 15–19) [42], leading BPA removal efficiency to decline to 57%.
|
|
(15) |
|
|
(16) |
|
|
(17) |
|
|
(18) |
|
|
(19) |
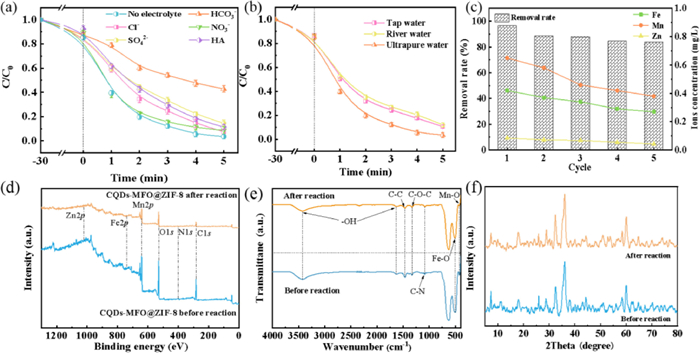
The above results demonstrated that different inorganic anions had different effect on BPA degradation. Next, the catalytic activation of PDS and BPA removal were assessed under practically relevant conditions in terms of tap water and river water. The water quality parameters are shown in Table 1. As shown in Fig. 5b, BPA removal efficiency of 89.50% and 88% was obtained for tap water and river water, respectively, within the reaction time of 10 min, which represented a slight decrease in BPA removal for DI-water. The degraded performance appeared to be likely due to dissolved organic matter (DOM) in the aqueous matrix, which might consume ROS as a consequence of competition for active sites between DOM and target contaminants [43]. These results demonstrated the practical feasibility of CQDs-MFO@ZIF-8 serving as catalysts for practical PDS activation and water decontamination.
One of the most critical factors for practical application is the stability and reusability of the CQDs-MFO@ZIF-8 nanocomposite materials. As shown in Fig. 5c, after fifth consecutive tests, the BPA removal efficiency underwent only a slight decrease from 96.5% to 83.90%, which was kept at the level of approximately 84%. Among them, the decrease of activity may be due to the slight overflow of metal ions on the catalyst. It is also possible that the catalyst absorbs some intermediate products, which hinders the degradation efficiency of organic matter [44]. In addition, Fig. 5c shows that the leaching concentrations of manganese, iron and zinc in the first cycle were 0.65 mg/L, 0.42 mg/L and 0.085 mg/L, respectively, and decreased to 0.38 mg/L, 0.27 mg/L and 0.043 mg/L with the progress of the cycle. According to the Discharge Standard of Pollutants for Municipal Wastewater Treatment Plant (GB18918–2002), the maximum leaching concentration of manganese and zinc is lower than the maximum allowable discharge concentration of total manganese (2.0 mg/L) and total zinc (1.0 mg/L). The results show that CQDs-MFO@ZIF-8 can activate PDS to degrade BPA stably without causing secondary pollution. The stability of catalytic materials was further investigated by using FTIR, XRD, XPS technique before and after reaction to detect whether the structure and/or composition were changed for CQDs-MFO@ZIF-8. As shown in Fig. 5d, the XPS spectrum of CQDs-MFO@ZIF-8 shows that the positions of characteristic peaks were basically the same before and after the reactions, and the change of intensity of characteristic peaks should be due to mutual conversion of metal ions with different valence states before and after the reaction, resulting in the reduction of their contents. The relative changes of characteristic peaks in the FTIR and XRD patterns of CQDs-MFO@ZIF-8 in Fig. 5e and Fig. 5f might be caused by the oxidation process that could not be ignored during the reaction. This provided evidence for stability and reusability of the CQDs-MFO@ZIF-8 under practically relevant conditions.
To further investigate whether the degraded products were toxic to ecology, it was necessary to evaluate the factors that had impact on water security upon a quantitative basis. The intermediate products of BPA in degradation process were analyzed by using UPLC-MS/MS technique (Fig. S6 and Table S2 in Supporting information). Based on the measured data, the pathways involved in BPA degradation mainly included hydroxylation, β-breakage and C—C bond cleavage, and the data were presented in Fig. 6a. First, •O2− attacked BPA molecule to achieve cleavage of C—C by oxidation reaction. Meanwhile, 1O2 was responsible for β-cleavage of the isopropyl group between the two phenyl groups to form P1 (4-(2-hydroxypropan-2-yl)phenol, m/z = 168) and P2 (2,4-di-tert-butylphenol, m/z = 206), and further being oxidized to P3 (4-isopropenyl phenol, m/z = 133) [39]. Then, P3 transformed into P5 (hydroquinone, m/z = 109) via the transitional product of P4 (1-(4-methyl phenyl) ethanone, m/z = 135). In particular, hydroquinone was a notoriously unstable chemical to fast degrade to P6 (p-benzoquinone, m/z = 108) [45]. Secondly, the benzene ring or hydroxyl group in the parent BPA was attacked via generation of •OH to form P7 (bisphenol A catechol, m/z = 243) [46]. P7 was decomposed to product P8 (4-isopropylenecatechol, m/z = 149) via hydroxylation and breakage of the C—C bond, respectively. Third, BPA could also be directly C—C broken to form P9 (4-isopropylphenol, m/z = 135) and P10 (2-phenylpropan-2-ol, m/z = 135). The intermediate products were then attacked to form P11 (lactic acid, m/z = 118), P12 (2-hydroxypropionic acid, m/z = 89) and P13 (2-hydroxyacetic acid, m/z = 75) [47]. These low molecular weight compounds were eventually mineralized to CO2 and H2O.
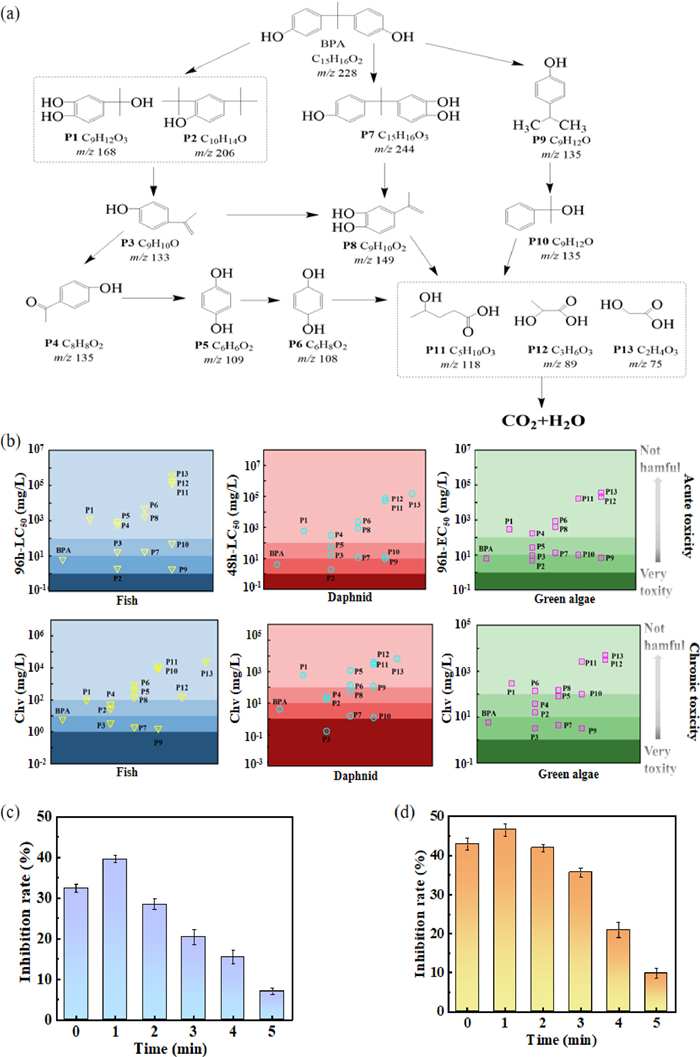
According to the intermediate products obtained from UPLC-MS/MS analysis, ECOSAR program is used to calculate the possible environmental impact and evaluate the environmental toxicity of BPA and its intermediates. As shown in Fig. 6b, ECOSAR is used to predict the acute (short-term) and chronic (long-term or delayed) toxicity of chemicals to aquatic organisms, which can be divided into four levels, including highly toxic, toxic, harmful and harmless. In CQDs-MFO@ZIF-8/PDS system, the acute toxicity of products P2 and P9 was higher than that of BPA, and the chronic toxicity of products P3, P7, P9 and P10 was higher than that of BPA. Followed with the catalytic oxidation reaction, P11, P12 and P13 became harmless via open-loop. In the CQDs-MFO@ZIF-8/PDS system, the toxicity of BPA degradation process was first increased and then decreased, and finally generated nontoxic products [48,49]. Therefore, CQDs-MFO@ZIF-8/PDS system has low ecological risk to degrade BPA wastewater through calculation.
In the light of calculation results, E. coli and Chlorella sorokiniana used as detection indexes to further prove the safety of CQDs-MFO@ZIF-8/PDS system. In Fig. 6c and Fig. 6d, the acute toxicity of BPA degradation intermediates to E. coli and Chlorella sorokiniana increase obviously, and the inhibition ratios reach 39.59% and 46.52% respectively in 1 min. The results were consistent with calculation which indicated that the degradation intermediates had high toxicity. Then the inhibition ratio of the intermediate product began to decrease nearly to noneffective after a series of reactions, indicating that BPA was finally degraded into a less toxic substance. Combine with experiment and calculation, CQDs-MFO@ZIF-8/PDS system was safe and environmentally friendly for degradation BPA.
In this study, CQDs-MnFe2O4@ZIF-8 catalyst was prepared for BPA degradation by thermal activation of PDS. Based on optimal catalyst content of 0.1 g/L, PDS of 4 mmol/L, pH 7.0 and reaction temperature of 60 ℃, the overall BPA degradation efficiency could reach 96.5%. The addition of CQDs improved the catalytic performance, which was favorable for promoting electron transfer to produce active species during PDS activation and BPA removal. Quenching tests and EPR measurement proved the •OH, SO4•−, •O2− and 1O2 be the significant active species involved in the PDS-activation system, and CQDs-MnFe2O4@ZIF-8/PDS degraded BPA by complementary free radical and non-free radical pathways, in which 1O2 played a dominant role. In the cyclic test, the degradation efficiency of BPA remained above 83% after five consecutive reactions, demonstrating good stability and reusability of the catalyst. Tests performed on the basis of different water quality conditions show the strong anti-interference capability and practicability under practically relevant conditions. The toxicity of BPA degradation intermediates was evaluated and analyzed by using ECOSAR, suggesting successful detoxification. This study provides proof-in-concept demonstration of new nanomaterials for enhanced catalytic water decontamination.
The authors declare that they have no known competing financial interests or personal relationships that could have appeared to influence the work reported in this paper.
The work was supported by the National Natural Science Foundation of China (Nos. 52270074, 52170039 and U22A20241), the National Key Research and Development Plan "Intergovernmental International Science and Technology Innovation Cooperation" (No. 2022YFE0135700), the Heilongjiang Provincial Natural Science Foundation of China (No. LH2021E117) the authors also gratefully acknowledge the financial support by the University Nursing Program for Young Scholars with Creative Talents in Heilongjiang Province (No. UNPYSCT-2020068).
Supplementary material associated with this article can be found, in the online version, at doi:
X. Qiu, S. Yang, M. Dzakpasu, et al., Chem. Eng. J. 372 (2019) 605–615. doi: 10.1016/j.cej.2019.04.175
J. You, C. Zhang, Z. Wu, et al., Chem. Eng. J. 415 (2021) 128890. doi: 10.1016/j.cej.2021.128890
D. Roy, S. Neogi, S. De, et al., Chem. Eng. J. 428 (2022) 131028. doi: 10.1016/j.cej.2021.131028
Y. Zhou, J. He, J. Lu, et al., Chin. Chem. Lett. 31 (2020) 2623–2626. doi: 10.1016/j.cclet.2020.02.008
P. Qiu, T. Zhao, X. Zhu, et al., Chin. Chem. Lett. 32 (2020) 1456–1461.
J. Yang, Y. Zhang, D. Zeng, et al., Chemosphere 247 (2019) 125780.
A. Jdss, B. Kdbm, A. Gld, et al., Colloids Surfaces A 595 (2020) 124679. doi: 10.1016/j.colsurfa.2020.124679
B. Deng, Y. Li, W. Tan, et al., Chemosphere 204 (2018) 178–185. doi: 10.1016/j.chemosphere.2018.03.194
S. Zhu, X. Li, J. Kang, et al., Environ. Sci. Technol. 53 (2019) 307–315. doi: 10.1021/acs.est.8b04669
X. Yuan, W. Zheng, S. Feng, et al., J. Solid State Chem. 304 (2021) 122596. doi: 10.1016/j.jssc.2021.122596
J. Wang, Z. Liao, J. Ifthikar, et al., Chemosphere 185 (2017) 754–763. doi: 10.1016/j.chemosphere.2017.07.084
P. Duan, T. Ma, Y. Yue, et al., Environ. Sci. Nano 6 (2019) 1799–1811. doi: 10.1039/C9EN00220K
Y. Li, W. Xiang, T. Zhou, et al., Chin. Chem. Lett. 31 (2020) 2757–2761. doi: 10.1016/j.cclet.2020.01.032
X. Liu, Y. Yang, H. Li, et al., Chem. Eng. J. 408 (2021) 127259. doi: 10.1016/j.cej.2020.127259
F.L. Wang, P. Chen, Y.P. Feng, et al., Appl. Catal. B 207 (2017) 103–113. doi: 10.1016/j.apcatb.2017.02.024
J. Huang, W. Chen, X. Yu, et al., Colloids Surfaces A 597 (2020) 124758. doi: 10.1016/j.colsurfa.2020.124758
Y.S. Zhao, Q. Li, H.J. Ren, et al., Chem. Res. Chin. Univ. 33 (2017) 415–421. doi: 10.1007/s40242-017-6485-3
H. Jiang, J. Sun, S. Zang, et al., J. Environ. Chem. Eng. 9 (2021) 105674. doi: 10.1016/j.jece.2021.105674
L.H. Wee, N. Janssens, S.P. Sree, et al., Nanoscale 6 (2014) 2056–2060. doi: 10.1039/c3nr05289c
N. Li, L. Zhou, X.Y. Jin, et al., J. Hazard. Mater. 366 (2019) 563–572. doi: 10.1016/j.jhazmat.2018.12.047
L.S. Xu, X.B. Sun, J.M. Hong, et al., J. Phys. Chem. Solids. 153 (2021) 110029. doi: 10.1016/j.jpcs.2021.110029
W. Shi, H. Lv, S. Yuan, et al., Sep. Purif. Technol. 174 (2017) 75–83. doi: 10.1016/j.seppur.2016.10.005
J. Bai, X. Wang, G. Han, et al., J. Alloy. Compd. 859 (2020) 157837.
Z.H. Wang, C. Lai, L. Qin, et al., Chem. Eng. J. 392 (2020) 124851. doi: 10.1016/j.cej.2020.124851
L.H. Kong, Y. Wu, R.F. Shen, et al., J. Environ. Chem. Eng. 10 (2022) 107808. doi: 10.1016/j.jece.2022.107808
D.D. Chu, H.R. Dong, Y.J. Li, et al., J. Hazard. Mater. 436 (2022) 129183. doi: 10.1016/j.jhazmat.2022.129183
L. Zhu, Z. Shi, L. Deng, et al., Colloids Surfaces A 609 (2020) 125637.
Y. Gao, S. Li, Y. Li, et al., Appl. Catal. B 202 (2017) 165–174. doi: 10.1016/j.apcatb.2016.09.005
Z. Lei, S. Zhou, D. Lin, et al., Colloids Surfaces A 621 (2021) 126531. doi: 10.1016/j.colsurfa.2021.126531
L. Gan, L. Wang, L. Xu, et al., J. Hazard. Mater. 413 (2021) 125305. doi: 10.1016/j.jhazmat.2021.125305
Q.L. Ma, H.X. Zhang, X.Y. Zhang, et al., Chem. Eng. J. 360 (2019) 848–860. doi: 10.1016/j.cej.2018.12.036
S. Li, Y. Wu, H. Zheng, et al., Chemosphere 288 (2022) 132558. doi: 10.1016/j.chemosphere.2021.132558
Y. Ji, Y. Shi, D. Wei, et al., Chem. Eng. J. 298 (2016) 225–233. doi: 10.1016/j.cej.2016.04.028
H. Jiang, Y. Zhong, K. Tian, et al., Appl. Surf. Sci. 577 (2022) 151902. doi: 10.1016/j.apsusc.2021.151902
L.T. Thao, T.V. Nguyen, V.Q. Nguyen, et al., J. Environ. Sci. 124 (2023) 379–396. doi: 10.1016/j.jes.2021.10.008
J. Yu, J. Zhang, T. Zeng, et al., Sep. Purif. Technol. 213 (2019) 264–275. doi: 10.1016/j.seppur.2018.12.044
H.C. Fu, S.L. Ma, P. Zhao, et al., Chem. Eng. J. 360 (2019) 157–170. doi: 10.1016/j.cej.2018.11.207
J.W. Huang, L. Li, J.Q. Chen, et al., Int. J. Hydrogen Energy 45 (2020) 1822–1836. doi: 10.1016/j.ijhydene.2019.11.078
S. Xu, L. Wen, C. Yu, et al., Chem. Eng. J. 442 (2022) 136250. doi: 10.1016/j.cej.2022.136250
Y. Fan, Z. Zhou, Y. Feng, et al., Chem. Eng. J. 383 (2020) 123056. doi: 10.1016/j.cej.2019.123056
A. Ioannidi, O.S. Arvaniti, M.C. Nika, et al., Chemosphere 287 (2022) 131952. doi: 10.1016/j.chemosphere.2021.131952
J. Wang, M. Yue, Y. Han, et al., Chem. Eng. J. 391 (2019) 123554.
S. Huang, Q. Zhang, P. Liu, et al., Appl. Catal. B 263 (2020) 118336. doi: 10.1016/j.apcatb.2019.118336
Z. Liu, Z. Gao, Q. Wu, et al., Chem. Eng. J. 423 (2021) 130283. doi: 10.1016/j.cej.2021.130283
S. Wang, J. Tian, Q. Wang, et al., Appl. Catal. B 256 (2019) 117783. doi: 10.1016/j.apcatb.2019.117783
Y. Wang, L. Wang, F. Ma, et al., Chem. Eng. J. 438 (2022) 135552. doi: 10.1016/j.cej.2022.135552
L. Li, Y. Liu, S. Zhang, et al., J. Hazard. Mater. 399 (2020) 122883. doi: 10.1016/j.jhazmat.2020.122883
Q.Y. Ji, X.Y. Cheng, Y.J. Wu, et al., Appl. Catal. B 282 (2020) 119579.
Z.Y. Li, F. Wang, Y.M. Zhang, et al., Chem. Eng. J. 423 (2021) 130093. doi: 10.1016/j.cej.2021.130093

Figure 1 (a) SEM image, (b) EDS spectra, (c, d) HRTEM images and (e-j) elemental mapping of CQDs-MFO@ZIF-8 nanocomposites.

Figure 2 (a) XRD pattern, (b) FTIR pattern, (c) LSV curves and (d) XPS survey spectra of ZIF-8, MFO@ZIF-8 and CQDs-MFO@ZIF-8 nanocomposite.

Figure 3 (a) Removal of BPA in aqueous solution by different as-fabricated samples; (b) fitting curve; effect of reaction parameters on the degradation of BPA: (c) catalyst dosage; (d) persulfate concentration; (e) initial pH value; (f) reaction temperature and Arrhenius plot for different temperatures (inset). [Reaction conditions: BPA concentration = 20 mg/L, persulfate concentration = 4 mmol/L, catalyst dosage = 1.0 g/L, reaction temperature = 60 ℃ and initial pH value = 7.0 ± 0.2].

Figure 4 BPA removal with different scavengers in the CQDs-MFO@ZIF-8/PDS system: (a) BQ, EtOH, FFA and TBA (b) TEMP for 1O2, DMPO for •O2− and DMPO for SO4•− and •OH; XPS spectra of CQDs-MFO@ZIF-8 nanocomposites before and after the reaction: (c) Mn 2p, (d) Fe 2p, (e) C 1s and (f) O 1s.

Figure 5 Effect of (a) different anions (anion concentration: 5 mmol/L); (b) different water matrices (deionized water, river water and tap water) on the degradation of BPA in CQDs-MFO@ZIF-8/PDS systems; (c) practicability of CQDs-MFO@ZIF-8 in degradation of BPA and metal ion concentration in cyclic experiments; (d) FTIR analysis; (e) XPS survey spectra and (f) XRD pattern of CQDs-MFO@ZIF-8 before and after reaction [Reaction conditions: BPA concentration = 20 mg/L, persulfate concentration = 4 mmol/L, catalyst dosage = 1.0 g/L, reaction temperature = 60 ℃ and initial pH value = 7.0 ± 0.2].

Figure 6 (a) Degradation pathways of BPA in the CQDs-MFO@ZIF-8/PDS system. (b) Toxicity evaluation of BPA and its intermediates via ECOSAR program and actual toxicity trend to (c) E. coli and (d) Chlorella sorokiniana during BPA treatment in CQDs-MFO@ZIF-8/PDS system.

 扫一扫看文章

扫一扫关注我们
 DownLoad:

 下载:
下载: