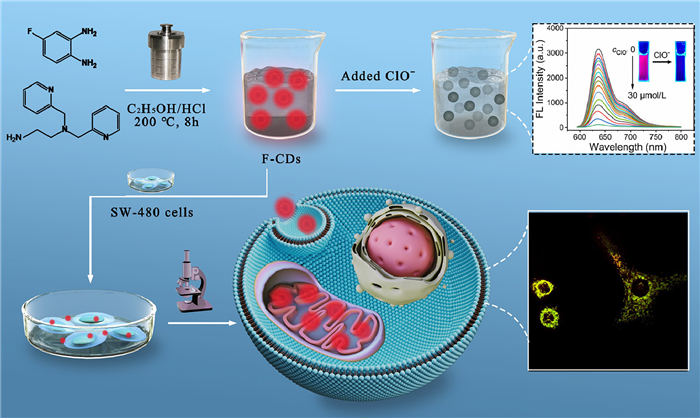
Scheme 1.
Schematic diagram of the preparation of the F-CDs, and the application for the detection of ClO− and for the labeling of mitochondria in SW-480 cells.
Fluorine-doped carbon quantum dots with deep-red emission for hypochlorite determination and cancer cell imaging
Boran Cheng , Lei Cao , Chen Li , Fang-Yi Huo , Qian-Fang Meng , Ganglin Tong , Xuan Wu , Lin-Lin Bu , Lang Rao , Shubin Wang

Carbon dots (CDs), a new kind of carbon-based nanomaterial with fluorescent properties, garnering significant attention since 2004 due to their impressive optical performance [1]. CDs possess a range of desirable attributes, including excellent biocompatibility [2,3], resistance to photobleaching [4], low cytotoxicity [5], easy functionalization [6], and high photoluminescence quantum yield (PLQY) [7]. These properties have made CDs highly sought-after in various applications, including cell imaging [8], bioimaging [9], biosensors [10], cancer therapy [11], and catalysis [6,12] among others [13,14]. In particular, CDs with deep-red (DR) or near-infrared (NIR) emission are highly advantageous, as they can reduce phototoxicity and mitigate the interference of background fluorescence in organisms or tissues [15,16]. Although, scientists have developed lots of molecular fluorophores with NIR emission [17,18], the preparation of DR or NIR emissive CDs is still a challenge due to the unclear fluorescence mechanism and the randomness of precursors [19,20].
To overcome this challenge, researchers have employed various strategies to increase the π-conjugated domain of CDs. For instances, Bi et al. developed N-CDs-F with NIR emission by employing a solvothermal method involving critic acid, urea and NH4F [21]. The doping of fluorine, which has a strong electron-withdrawing effect, resulted in a favorable donor-π-acceptor (D-π-A) configuration structure in N-CDs-F, facilitating the expansion of the conjugated sp2 domain and ultimately leading to red-shifted emission [22]. Similarly, Gao et al. prepared R-CDs210 with emission at 660 nm in the solid state by employing a solvothermal treatment of 1,2-diaminobenzene and thiourea, where the red-shifted phenomenon was attributed to the collaboration of D-π-A pattern and intramolecular charge-transfer (ICT) effect [23]. Other reports have demonstrated that the introduction of amidogen groups not only promotes the production of the D-π-A pattern but also increases the electronic cloud density, which is beneficial for decreasing the band energy gap in CDs and resulting in long-wavelength emission [24,25]. For example, Rogach et al. have reported that surface-functionalization with amidogen induced a red-shifted emission of CDs, which was probably attributed to charge transfer between the amidogen and the carbon core. This suggests that the introduction of strong electron-withdrawing groups and electron-donating groups such as —NH2 can be utilized to prepare CDs with red or NIR emission.
Hypochlorite (ClO−) is a potent source of reactive oxygen species (ROS), which plays a critical role in numerous biological processes [26]. It is noteworthy that hypochlorous acid, when used at appropriate concentrations, can be employed to eliminate pathogenic agents. Currently, the disinfection of tap water using chlorine or chlorine dioxide is a widespread practice worldwide. However, abnormal levels of ClO− have been related to some diseases, including scurvy, mental illness [27], rheumatoid arthritis [28], multiple sclerosis [29], and cancer. Although there contained numerous techniques for the detection of ClO−, including chemiluminescence [30], electrochemistry [31], and chromatographic methods [32]. These methods still have a number of disadvantages, such as the need of professional operators, expensive equipment, lengthy preparation processes. As a result, fluorescence-based assays, with their superior optical characteristics and economic operation [33], seemed the appropriated way to avoid this predicament.
In this work, we have synthesized a novel deep-red fluorine-doped carbon quantum dots (F-CDs) by introducing fluorine and amidogen (Scheme 1). The maximum emission wavelength of F-CDs was located at 636 nm with a maximum excitation wavelength of 574 nm. Additionally, F-CDs exhibited excellent optical properties, including a high absolute quantum yield (36.00% ± 0.68%), excitation-independent emission, and good photostability. In the determination of ClO−, the fluorescence intensity of F-CDs was significantly quenched by the static quenching process, the corresponding limit of detection (LOD) was calculated to be approximately 15.4 nmol/L. Furthermore, the F-CDs-based fluorescent sensor also showed an error within 2% in the detection of ClO− in real samples, indicating its potential application for accurate determination of ClO− content. In cell imaging, F-CDs not only responded to the exogenous addition of ClO− but also showed excellent targeting capability towards the mitochondria in SW-480 cells. The corresponding Pearson's correlation coefficient (PCC) in colocalization was calculated to be as high as 0.93, suggesting that F-CDs also have potential capacity to replace commercial dyes for specific labeling of mitochondria.
The F-CDs were prepared via a one-step solvothermal method of 3,4-diaminofluorobenzene, N',N'-bis(pyridin-2-ylmethyl)ethane-1,2-diamine and diluted hydrochloric acid. Transmission electron microscopy (TEM) and high-resolution TEM (HR-TEM) microscopy were performed to investigate the morphology of the F-CDs. As shown in Fig. S1a (Supporting information), the TEM image of the F-CDs revealed well-dispersed particles with an average diameter of 8.19 nm, and the corresponding HR-TEM image of the F-CDs (Fig. S1b in Supporting information) showed a spheroid morphology with a clear crystal lattice. The d-spacing of the F-CDs was measured to be 0.21 nm which was attributed to the (100) plane of the graphite facet [34], which was in accord with the result of the X-ray diffraction (XRD) pattern in Fig. S2 (Supporting information) [35]. The corresponding fast Fourier transform (FFT) and inverse fast Fourier transform (IFFT) patterns were also measured and shown in Figs. S1c and d (Supporting information), the results were consistent with the HR-TEM analysis, indicating the presence of high crystallinity. In addition, the lattice spacing of the F-CDs was calculated to be approximately 0.207 nm (Fig. S1e in Supporting information), which was in agreement with the result of the HR-TEM image.
The Fourier transform infrared (FTIR) spectroscopy and X-ray photoelectron spectroscopy (XPS) were performed to further investigate the functional groups of the F-CDs. As depicted in Fig. 1a, the FTIR spectrum of the F-CDs exhibited several peaks at 3423, 2925, 1621, 1569, and 1524 cm−1, which were attributed to the stretching vibration of N—H, C—H, C═O, C═N, C—O, and C═C, respectively [36]. The bending vibration of alkyl was located at 1478 cm−1. The stretching vibration of C—N, C—F, and C—O were located at 1316, 1265, and 1235 cm−1, respectively [37]. The total XPS spectrum in Fig. 1b confirmed the presence of C, N, O, and F elements in F-CDs. And the corresponding high-resolution XPS spectra of C 1s (Fig. S3a in Supporting information) exhibited four peaks at 248.8, 285.6, 286.5, and 288.5 eV, which were assigned to the C—C/C—N, C—O, C═O, and C-F structures, respectively. The N 1s XPS spectra (Fig. S3b in Supporting information) suggested the presence of C—N═C (399.2 eV), N—C (400.1 eV), and N—H (401.7 eV) bonds. The curve of O 1s XPS spectra (Fig. S3c in Supporting information) was deconvoluted with three peaks at 531.1, 532.5 and 533.2 eV, which were ascribed to the C═O, C—O, and O═C—O bonds. And the F 1s XPS spectra (Fig. S3d in Supporting information) revealed the presence of semi-ionic C—F (686.6 eV) and covalent C—F bonds (687.1 eV). Therefore, combined with the FTIR and XPS results, we have demonstrated the successful doping of the fluorine in the F-CDs.
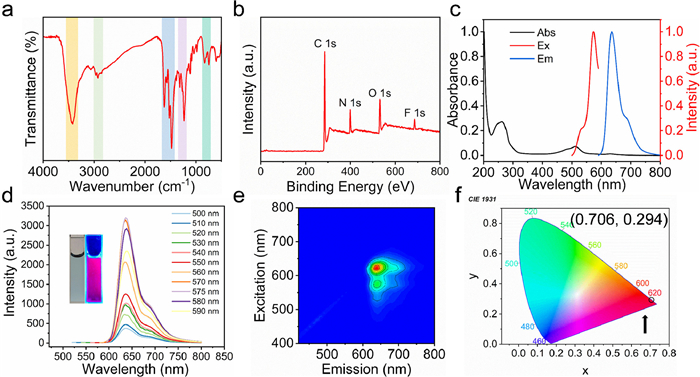
The ultraviolet-visible (UV–vis) and fluorescence spectrophotometer were used to investigate the optical properties of the F-CDs. The UV–vis absorption spectrum in Fig. 1c exhibited a strong absorbance peak at 284 nm, which was attributed to the π-π* transition of C═C in the sp2 region [38]. In addition, the broad absorption band in the range of approximately 450–550 nm indicated the n-π* transition of C═N and C═O bonds [39]. Moreover, the fluorescence spectra of the F-CDs demonstrated that the F-CDs had a maximum emission at 636 nm with a maximum excitation wavelength of 574 nm. As shown in Fig. 1d, the fluorescence spectra of the F-CDs indicated that the emission of the F-CDs was excitation-independent, and the inset were the images of the F-CDs solution under daylight and blue light (λ = 450 nm), indicating that the F-CDs exhibited bright red emission under excitation. Moreover, the total luminescence spectra of the F-CDs were measured and shown in Fig. 1e, the results showed the excitation-independent emission which was consistent with the fluorescence spectra. And the corresponding Commission Internationale de l' Eclairage (CIE) coordinate was shown in Fig. 1f, the coordinate (0.706, 0.294) was obviously located in the red region, further confirming the excellent optical properties of the F-CDs. Given the DR emission and excitation-independent properties, F-CDs possessed good anti-interference performance and could be potentially applied in cell imaging [40].
The absolute quantum yields (QY), pH stability, and salt tolerance of the F-CDs were further explored. As shown in Fig. S4 (Supporting information), the absolute QY of the F-CDs was determined to be an impressive 36.00% ± 0.68% after thrice measurements. As depicted in Fig. S5a (Supporting information), consistent with previous reports [41], the intensity of the F-CDs was significantly enhanced under acidic conditions (pH 1.0–4.0), while the fluorescence intensity decreased when the solutions changed to alkaline conditions (pH 9.0–13.0). This phenomenon is mainly attributed to the protonation and deprotonation effects of the surface amino groups [42]. The salt tolerance of the F-CDs was further performed and shown in Fig. S5b (Supporting information), the results suggested that the intensity of the F-CDs was stable in different concentrations of NaCl (0–2 mol/L) solution. Additionally, photostability was also investigated and demonstrated in Fig. S5c (Supporting information), indicating that the intensity of F-CDs remained above 85% when exposed to daylight for a week. Therefore, the prepared F-CDs possessed both wonderful optical properties and good stability, which could provide a favorable foundation for subsequent applications.
Considering the pretty high fluorescence intensity of F-CDs and the favorable dissociation of hypochlorite in acidic conditions, the system with pH 1.0 was chosen for the detection of ClO−. As shown in Fig. 2a, the intensity of the F-CDs gradually decreased with the different concentration of ClO− added. Notably, the fluorescence of F-CDs was dramatically quenched when the ClO− concentration reached 30 µmol/L. And we found that the intensity of F-CDs could be quenched by ClO− within 1 min and be stable in the next 20 min (Fig. S6 in Supporting information). The inset in Fig. 2a shows the transition of the F-CDs solution from bright red emission to colorless. The relationship between the variations in fluorescence intensity (F0/F) and the ClO− concentration was further analyzed. As shown in Fig. 2b, the results demonstrated a good linear relationship (F0/F = 100.21c – 77.22, R2 = 0.996). And LOD was calculated to be approximately 15.4 nmol/L. Therefore, compared to the published work, our prepared F-CDs exhibited a longer emission wavelength or lower LOD (Tables S1 and S2 in Supporting information).
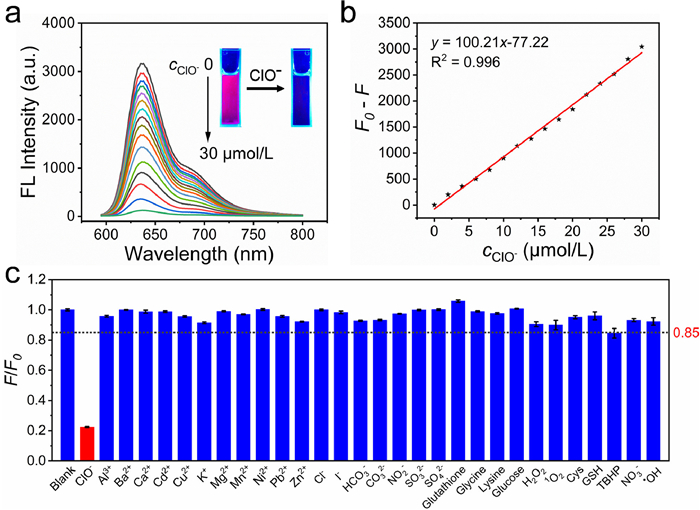
Furthermore, the selectivity of the assay system for ClO− was verified in the coexistence of interfering substances. Similar to the detection of ClO−, F-CDs were dispersed in a buffer solution (pH 1.0) followed by the addition of interfering substances, including metal cations (Al3+, Ba2+, Cd2+, Cu2+, Mg2+, Mn2+, Pb2+, Zn2+, Ca2+, K+, and Ni2+), anions (Cl−, I−, SO32−, SO42−, CO32−, NO2−, NO3−, and HCO3−), small molecules (glutathione, glycine, lysine, glucose, cysteine, and glutathione (GSH)), and some oxidizing agents (H2O2, 1O2, tert-butyl hydroperoxide (TBHP), and ·OH). The concentration of ClO− was fixed at 24 µmol/L, while the concentration of each interfering substance was 5 folds higher than ClO−. It is noticeable that the fluorescence intensity of F-CDs was significantly reduced with the presence of exogenous ClO− (Fig. 2c). On the contrary, the fluorescence of F-CDs remained stable when various interfering substances even if H2O2, TBHP and ·OH (formed by Fenton reaction) were added, demonstrating that F-CDs have superior selectivity and sensitivity for the detection of ClO− in complex conditions. These results suggest the great potential of F-CDs-based fluorescent sensor for ClO− detection in various applications. Therefore, tap water and commercial bleach were selected as model systems to assess the potential value of F-CDs in the real samples. As shown in Table S3 (Supporting information), the recoveries of the ClO− standards in tap water and commercial bleach were found to be within the ranges of 98.85% ± 0.05% to 100.88% ± 0.22%, and 98.29% ± 0.21% to 100.07% ± 0.22%, respectively. The satisfactory recovery and relative standard deviation (RSD) values obtained in this study demonstrate the accuracy of F-CDs for detecting ClO− in real-world samples.
To evaluate the quenching mechanism of the F-CDs, the relationship between the intensity of F-CDs and the concentration of ClO− was analyzed using the modified Stern-Volmer equation (Eq. 1) [43] as follows:
|
|
(1) |
where F0 and F represent the fluorescence intensities of the 20 µg/mL of the F-CDs in the absence and presence of ClO−, respectively. Ka and fa denote the Stern–Volmer quenching constant and the fractional maximum fluorescence intensity of F-CDs summed up, respectively. And [Q] represents the concentration of ClO−.
As illustrated in Fig. 3a, the modified Stern-Volmer equation of the quenching process was calculated as F0/(F0 − F) = 0.40 + 32.14/[Q], which suggests that Ka is 1.244 × 10⁴ L/mol. Additionally, the fluorescence lifetime of 20 µg/mL of F-CDs (τ) was determined to be 3.27 ns using time-correlated single-photon counting (Fig. 3c). The calculated quenching rate constant (Kq) value was approximately 3.80 × 10¹² L mol−1 s−1, indicating a static quenching process since the dynamic quenching rate constant is typically less than 1.0 × 10¹⁰ L mol−1 s−1 [44,45].
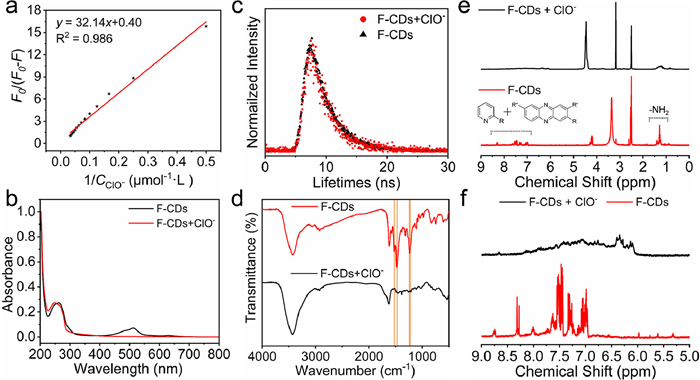
To further verify our speculation, the UV–vis absorption spectra of the F-CDs with or without ClO− were analyzed (Fig. 3b). The results indicated that the characteristic peaks of F-CDs over the range from 450 nm to 550 nm disappeared with the addition of ClO−. This phenomenon is most likely caused by the strong oxidizing property of ClO−, which may destroy the structure of F-CDs and ultimately result in fluorescence quenching. Additionally, the lifetime of F-CDs with or without ClO− were investigated based on the reported equation [46], with a lifetime of 2.78 and 3.27 ns (Fig. 3c), respectively. The FTIR spectra of F-CDs with or without ClO− were employed and shown in Fig. 3d, which suggested that the specific stretching vibrations of C═C, C—N, C═N and C—O were dramatically decreased, indicating that the phenazine ring in F-CDs was destroyed by the oxidation reaction [42]. Moreover, the 1H nuclear magnetic resonance (NMR) spectra (Figs. 3e and f) of F-CDs and F-CDs + ClO− also confirmed the structures of pyridines and phenazines in F-CDs were destroyed after adding ClO− [47,48]. Therefore, combined with the above results, the quenching mechanism of the F-CDs in the detection of ClO− mainly originated from static quenching.
A cytotoxicity assay (WST-1) was performed to assess the applicability of F-CDs for cell imaging. As depicted in Fig. S7a (Supporting information), the viability of SW-480 cells persisted over 90% upon the addition of varying concentrations of F-CDs (0, 10, 20, 30, 40, 50, 60, 80, and 100 µg/mL). And the hemolysis test shown in Fig. S7b (Supporting information) suggested that F-CDs possessed negligible effect on red blood cells from BALB/c mice (care and housing were under the supervision of authorized investigators of the animal welfare ethics committee at Shenzhen Bay Laboratory and by the international standards for animal welfare), which indicated their good biocompatibility and potential application in cell imaging.
The ability of F-CDs for cell imaging was further explored using Leica TCS-SP5 confocal laser scanning microscopy (CLSM). As shown in Fig. S8a (Supporting information), SW-480 cells exhibited distinct blue and red emissions in the nucleus and cytoplasm, which were corresponded to Hoechst and F-CDs, respectively. Upon addition of exogenous ClO− (20 µmol/L), the intensity in the red channel (λ = 633 nm) was significantly decreased (Fig. S8b in Supporting information), suggesting that F-CDs could respond to exogenous ClO− at cellular level.
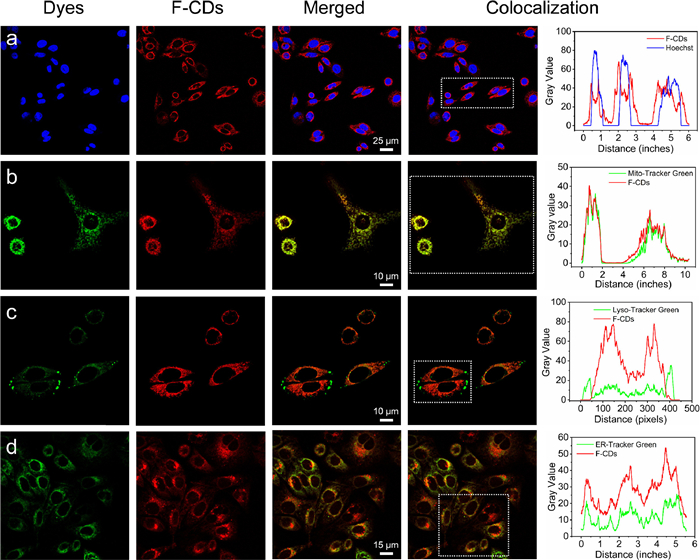
The targeting site of F-CDs in SW-480 cells was further explored by labeling the nucleus, mitochondria, lysosome, and endoplasmic reticulum, respectively. As shown in Fig. 4, unlike Hoechst (Fig. 4a), Lyso-Tracker Green (Fig. 4c), and ER-Tracker Green (Fig. 4d), the signal of F-CDs in red channel was significantly overlapped with Mito-Tracker Green (Fig. 4b). Additionally, by choosing the region within the rectangular border as the sample, the signal of the F-CDs exhibited a significant overlap with Mito-Tracker Green, demonstrating that the targeting site of F-CDs in SW-480 cells was mitochondria. This conclusion was further verified by colocalization analysis, corresponding PCC was calculated at about 0.93 (Fig. S9 in Supporting information), which is better than reported studies [49,50].
Because of the wonderful mitochondria targeting of F-CDs, the impacts of different mitochondria membrane potential (MMP), polarity, and viscosity on the biological microenvironment were investigated. As shown in Figs. S10a and b (Supporting information), some F-CDs leaked from mitochondria and distributed in the cytoplasm when the MMP of SW-480 cells decreased by treating with carbonyl cyanide 3-chlorophenylhydrazone (CCCP). However, when SW-480 cells were fixed by 4% paraformaldehyde, partial F-CDs were shed from the mitochondria and distributed in the cytoplasm and nucleolus accompanied by the disappearance of MMP (Fig. S10c in Supporting information). Thus, we speculated that the mitochondria targeting of F-CDs relied on lipophilic cations inherited from N',N'-bis(pyridin-2-ylmethyl)ethane-1,2-diamine [51]. Furthermore, the intracellular polarity was regulated by treating with dimethyl sulfoxide (DMSO) and Hank's balance salt solution (HBSS) [52]. As shown in Figs. S11a and b (Supporting information), DMSO could rapidly decrease the intracellular polarity and increase the membrane penetration [53], which eventually caused the enhancement of fluorescence and a slight signal in the nucleus. However, treatment with HBSS caused weaker fluorescence because it can increase the intracellular polarity (Fig. S11c in Supporting information). Besides that, to investigate the influence of viscosity, H2O2 and Cu2+ (heavy metal ion) were utilized to increase and decrease the viscosity of the microenvironment, respectively. As depicted in Figs. S12a and b (Supporting information), SW-480 cells treated with H2O2 exhibited a stronger fluorescent signal. Compared to this, the group of incubation with Cu2+ (Fig. S12c in Supporting information) showed a weaker emission. Considering that H2O2 and Cu2+ negligibly interfered with F-CDs, the enhanced intensity should be attributed to the inhibition of molecular rotor rotation [54].
We further investigated the cellular uptake mechanism of the F-CDs by SW-480 cells and the results were shown in Figs. S13a and b (Supporting information). Compared to the control group, SW-480 cells incubated at 4 ℃ or with chlorpromazine (CPZ), genistein, methyl-β-cyclodextrin (MβCD), and amiloride made fluorescence intensities of F-CDs decrease by 74.79%, 84.23%, 83.78%, 78.35%, and 85.38%, respectively. Therefore, the endocytosis of SW-480 cells for F-CDs is ATP-dependent and multi-endocytic pathways mediated, including clathrin-mediated endocytosis, caveolae-mediated endocytosis, lipid raft-mediated endocytosis, and macropinocytosis. Overall, our work indicate that F-CDs are capable of detecting ClO− at the intracellular level and have the potential to replace commercial dyes for labeling mitochondria in cells.
In conclusion, we have successfully synthesized red-emissive F-CDs following a solvothermal process with 3,4-diaminofluorobenzene, N',N'-bis(pyridin-2-ylmethyl)ethane-1,2-diamine and diluted hydrochloric acid. The F-CDs exhibited excellent optical properties, including high absolute QY (36.00% ± 0.68%), long wavelength emission (λ = 636 nm) and good stability. Further investigation demonstrated that the red emission of F-CDs was significantly quenched by ClO− via a static quenching process. Over the range of 0–30 µmol/L of ClO−, the intensity difference of F-CDs exhibited an excellent linear relationship with an R2 of 0.996. The LOD was calculated to be as low as 15.4 nmol/L. These results suggest the feasibility of selective and sensitive detection of ClO− using as-prepared F-CDs-based fluorescent sensors. In real samples, the F-CDs were reported with an error less than 2%, which demonstrates their suitability practical applications in daily life. In addition, the F-CDs exhibited good responsiveness to exogenous ClO− and a high capacity for mitochondria targeting in SW-480 cells. The corresponding PCC of colocalization analysis between the commercial dye and F-CDs was up to 0.93. Therefore, the F-CDs have the capability to determining the content of ClO− in daily life and replace commercial dyes for labeling mitochondria in cells.
The authors declare that they have no known competing financial interests or personal relationships that could have appeared to influence the work reported in this paper.
This work was supported by the National Natural Science Foundation of China (Nos. 82222035 and 81602489), the Guangdong Basic and Applied Basic Research Foundation (Nos. 2021A1515111036 and 2022A1515110308), the Medical Scientific Research Foundation of Guangdong Province of China (No. A2023274), and the Basic Research Program of Shenzhen Innovation Council (No. JCYJ20210324105609024).
Supplementary material associated with this article can be found, in the online version, at doi:
X. Xu, R. Ray, Y. Gu, et al., J. Am. Chem. Soc. 126 (2004) 12736–12737. doi: 10.1021/ja040082h
X. Xu, K. Zhang, L. Zhao, et al., ACS Appl. Mater. Interfaces 8 (2016) 32706–32716. doi: 10.1021/acsami.6b12252
H. Ren, Y. Yuan, A. Labidi, et al., Chin. Chem. Lett. 34 (2023) 107998. doi: 10.1016/j.cclet.2022.107998
D. Benetti, E. Jokar, C.H. Yu, et al., Nano Energy 62 (2019) 781–790. doi: 10.1016/j.nanoen.2019.05.084
K. Ghosal, A. Ghosh, Mater. Sci. Eng. C 96 (2019) 887–903. doi: 10.1016/j.msec.2018.11.060
N. Dhenadhayalan, K.C. Lin, T.A. Saleh, Small 16 (2020) 1905767. doi: 10.1002/smll.201905767
Y. Shi, W. Su, F. Yuan, et al., Adv. Mater. 35 (2023) 2210699. doi: 10.1002/adma.202210699
X. Yang, X. Li, B. Wang, et al., Chin. Chem. Lett. 33 (2022) 613–625. doi: 10.1016/j.cclet.2021.08.077
Y. Liu, Y. Yuzhen, T. Tian, et al., Chin. Chem. Lett. 32 (2021) 3061–3065. doi: 10.1016/j.cclet.2021.03.075
C. Ji, Y. Zhou, R.M. Leblanc, Z. Peng, ACS Sens. 5 (2020) 2724–2741. doi: 10.1021/acssensors.0c01556
S. Liang, J. Yao, D. Liu, et al., Adv. Mater. 35 (2023) 2211130. doi: 10.1002/adma.202211130
D. Yang, D. Qu, L. An, et al., Chin. Chem. Lett. 32 (2021) 2292–2296. doi: 10.1016/j.cclet.2021.02.005
Y. Zhai, B. Zhang, R. Shi, et al., Adv. Energy Mater. 12 (2022) 2103426. doi: 10.1002/aenm.202103426
L. Miao, X. Zhu, G. Liu, et al., Chin. Chem. Lett. 34 (2023) 107921. doi: 10.1016/j.cclet.2022.107921
X. Zeng, Y. Liao, X. Qiao, et al., Acta Pharm. Sin. B 13 (2023) 4578–4590. doi: 10.1016/j.apsb.2023.07.005
Y. Liu, M. Gu, Q. Ding, et al., Angew. Chem. Int. Ed. 62 (2023) e202214875. doi: 10.1002/anie.202214875
X. Cheng, C. Zhang, K. Shen, et al., Chem. Eng. J. 446 (2022) 136929. doi: 10.1016/j.cej.2022.136929
Y. Li, H. Zhu, X. Wang, et al., CCS Chem. 4 (2022) 3735–3750. doi: 10.31635/ccschem.022.202101547
L. Ai, Y. Yang, B. Wang, et al., Sci. Bull. 66 (2021) 839–856. doi: 10.1016/j.scib.2020.12.015
B. Wang, Z. Wei, L. Sui, et al., Light Sci. Appl. 11 (2022) 172. doi: 10.1038/s41377-022-00865-x
L. Jiang, H. Ding, M. Xu, et al., Small 16 (2020) 2000680. doi: 10.1002/smll.202000680
D. Li, E.V. Ushakova, A.L. Rogach, S. Qu, Small 17 (2021) 2102325. doi: 10.1002/smll.202102325
D. Gao, A. Liu, Y. Zhang, et al., Chem. Eng. J. 415 (2021) 128984. doi: 10.1016/j.cej.2021.128984
S.H. Jin, D.H. Kim, G.H. Jun, et al., ACS Nano 7 (2013) 1239–1245. doi: 10.1021/nn304675g
S. Qu, D. Zhou, D. Li, et al., Adv. Mater. 28 (2016) 3516–3521. doi: 10.1002/adma.201504891
Y. Xia, L. Rao, H. Yao, et al., Adv. Mater. 32 (2020) 2002054. doi: 10.1002/adma.202002054
Y. Liu, Z. Wei, W. Duan, et al., Dyes Pigm. 149 (2018) 491–497. doi: 10.1016/j.dyepig.2017.10.039
N.A. Burmistrova, R.J. Meier, S. Schreml, A. Duerkop, Sens. Actuator. B: Chem. 193 (2014) 799–805. doi: 10.1016/j.snb.2013.12.025
R. Wang, R. Wang, D. Ju, et al., Analyst 143 (2018) 5834–5840. doi: 10.1039/c8an01585f
T. Abe, T. Shimoyama, S. Fukuda, et al., Luminescence 15 (2000) 267–271. doi: 10.1002/1522-7243(200009/10)15:5<267::AID-BIO590>3.0.CO;2-E
E.E. Kalu, C. Oloman, J. Appl. Electrochem. 20 (1990) 932–940. doi: 10.1007/BF01019568
S. Wybraniec, K. Starzak, E. Szneler, Z. Pietrzkowski, J. Chromatogr. B 1036–1037 (2016) 20–32.
Y. Jiao, Y. Meng, W. Lu, et al., Talanta 219 (2020) 121170. doi: 10.1016/j.talanta.2020.121170
Z. Yan, T. Chen, L. Yan, et al., Adv. Sci. 10 (2023) 2206386. doi: 10.1002/advs.202206386
K.J. Mintz, M. Bartoli, M. Rovere, et al., Carbon 173 (2021) 433–447. doi: 10.1016/j.carbon.2020.11.017
L. Cao, T. Zhu, M. Zan, et al., Sens. Actuator. B: Chem. 370 (2022) 132424. doi: 10.1016/j.snb.2022.132424
Y. Liu, M. Zan, L. Cao, et al., Microchem. J. 179 (2022) 107453. doi: 10.1016/j.microc.2022.107453
H.Y. Wang, L. Zhou, H.M. Yu, et al., Adv. Opt. Mater. 10 (2022) 2200678. doi: 10.1002/adom.202200678
S. Lu, L. Sui, J. Liu, et al., Adv. Mater. 29 (2017) 1603443. doi: 10.1002/adma.201603443
X. Pang, R. Yan, L. Li, et al., Anal. Chim. Acta 1199 (2022) 339571. doi: 10.1016/j.aca.2022.339571
Y.J. Ju, N. Li, S.G. Liu, et al., Anal. Bioanal. Chem. 411 (2019) 1159–1167. doi: 10.1007/s00216-018-1547-z
Q. Zhang, R. Wang, B. Feng, et al., Nat. Commun. 12 (2021) 6856. doi: 10.1038/s41467-021-27071-4
Y. He, Y. Wang, L. Tang, et al., J. Fluoresc. 18 (2008) 433–442. doi: 10.1007/s10895-007-0283-0
Q.Q. Zhang, B.B. Chen, H.Y. Zou, et al., Biosens. Bioelectron. 100 (2018) 148–154. doi: 10.1016/j.bios.2017.08.049
M. Lin, H.Y. Zou, T. Yang, et al., Nanoscale 8 (2016) 2999–3007. doi: 10.1039/C5NR08177G
F. Chen, F. Xiao, W. Zhang, et al., ACS Appl. Mater. Interfaces 10 (2018) 26964–26971. doi: 10.1021/acsami.8b08887
J. Liu, Z. Liu, W. Wang, Y. Tian, Angew. Chem. Int. Ed. 60 (2021) 21351–21359. doi: 10.1002/anie.202106193
D. Sharma, N. Kotwal, P. Chauhan, Org. Lett. 25 (2023) 3772–3777. doi: 10.1021/acs.orglett.3c01270
X.W. Hua, Y.W. Bao, Z. Chen, F.G. Wu, Nanoscale 9 (2017) 10948–10960. doi: 10.1039/C7NR03658B
P. Zhu, W. Li, Y. Zhang, et al., Chin. Chem. Lett. 34 (2023) 108239. doi: 10.1016/j.cclet.2023.108239
N. Xin, D. Gao, B. Su, et al., ACS Sens. 8 (2023) 1161–1172. doi: 10.1021/acssensors.2c02451
X. Shi, Y. Hu, H.M. Meng, et al., Sens. Actuator. B: Chem. 306 (2020) 127582. doi: 10.1016/j.snb.2019.127582
K. Marren, Phys. Sportsmed. 39 (2011) 75–82. doi: 10.3810/psm.2011.09.1923
A. Zheng, H. Liu, X. Gao, et al., Anal. Chem. 93 (2021) 9244–9924. doi: 10.1021/acs.analchem.1c01511

Scheme 1 Schematic diagram of the preparation of the F-CDs, and the application for the detection of ClO− and for the labeling of mitochondria in SW-480 cells.

Figure 1 (a) The FTIR spectrum of the F-CDs. (b) The XPS spectrum of the F-CDs. (c) The UV–vis absorption (black line), excitation (red line), and emission (blue line) spectra of the F-CDs. (d) Fluorescence spectra of the F-CDs. Inset: Images of F-CDs solution under daylight and blue light (λ = 450 nm). (e) Total luminescence spectra (400–800 nm) of the F-CDs. (f) CIE color coordinate of the F-CDs, the color coordinate is (0.706, 0.294).

Figure 2 (a) Fluorescent spectra of the F-CDs with different concentrations of ClO− (from top to bottom, 0–30 µmol/L) at an excitation wavelength of 574 nm. Inset: Photographs of the F-CDs before and after the addition of ClO−. (b) The linear relationship between (F0 − F) and the concentration of ClO− over the range of 2–30 µmol/L. (c) The corresponding fluorescence intensities of the F-CDs toward ClO− (24 µmol/L) and other interfering substances (5 times concentration towards ClO−). Error bars represent the standard deviation (SD) for n = 3.

Figure 3 (a) The linear regression procedure based on the modified Stern–Volmer equation. (b) UV–vis absorption spectra of F-CDs (black line) and F-CDs + ClO− (red line). (c) Lifetimes of the F-CDs and F-CDs with the addition of ClO−. (d) FTIR spectra of the F-CDs (red line) and F-CDs with the addition of ClO− (black line). (e) 1H NMR spectra (DMSO-d6) of F-CDs and F-CDs + ClO−. (f) Partially enlarged detailed 1H NMR spectra of F-CDs and F-CDs + ClO−.

Figure 4 CLSM images and colocalization analysis of the SW-480 cells which were co-incubated with F-CDs, Hoechst, Mito-Tracker Green, Lyso-Tracker Green, and ER-Tracker Green. (a) SW-480 cells were incubated with F-CDs and Hoechst. Scale bar = 25 µm. (b) SW-480 cells were incubated with F-CDs and Mito-Tracker Green. Scale bar = 10 µm. (c) SW-480 cells were incubated with F-CDs and Lyso-Tracker Green. Scale bar = 10 µm. (d) SW-480 cells were incubated with F-CDs and ER-Tracker Green. Scale bar = 15 µm. The concentration of F-CDs in incubation was 20 µg/mL. From left to right: blue channel (λ = 405 nm) or green channel (λ = 488 nm), red channel (λ = 633 nm), and merged images.

 扫一扫看文章

扫一扫关注我们
 DownLoad:
 下载:
下载: