
Scheme 1.
Synthesis route of fluorescent probe PyHP (A) and proposed fluorescence sensing mechanism of the probe for HClO (B). Red arrow in (B) indicates C=N isomerization.

Cancer has been a severe threat to human health, and millions die of cancer yearly [1,2]. According to the evaluation of the World Health Organization, by 2035, there will be 24 million new cancer cases and 14.5 million cancer-related deaths, out of which approximately 30% could hold the chance if the cancers could be diagnosed earlier [3]. However, owing to the lack of specificity and sensitivity of current techniques, accurate diagnosis can be achieved only in the middle or late stage of the tumor [4]. Most patients with cancer, including breast, stomach, ovarian, colonic, and so forth, are already at the late stages of disease when diagnosed [5,6]. As a result, patients often miss the optimal treatment window, which also is one of the leading causes of high death rates. In addition, studies demonstrated that the five-year survival rate for many early-stage cancers is above 50%, and it falls to below 20% when cancer cells are metastasized to distant tissue [3,7–9]. Overall, it is highly urgent for early detection and diagnosis of cancers, the key of which lies in the discrimination of cancer cells/tissues from normal cells/tissues using efficient tools [7,10–13].
Small molecule-based fluorescent techniques, featured with the advantages of visualization, sensitivity, easy modification, and low biological damage [14–18], have shown great potential as noninvasive diagnostics tools for diagnosing cancers. The most commonly used strategy for designing tumor-targeted fluorescent probes has been the use of chemical conjugation of fluorophores with recognition units that can specifically bind to or react with the overexpressed cancer biomarkers. Among those biomarkers, reactive oxygen species (ROS), such as hypochlorous acid (HClO) [19–23], is gaining increasing attention, given that cancer cells commonly have the elevated ROS level due to the dysregulated metabolism, i.e., aerobic glycolysis (Warburg effect) [24,25]. Taking advantage of this exclusive feature, in recent years, many efforts have been devoted to discriminating cancer cells from normal ones by exploiting fluorescent ROS probes [7,26–31]. However, the efficacy of these probes has been challenged. One possible reason is that the HClO level between cancer cells and normal cells, although being higher in the former, is still of little difference, making it difficult to reach the clinical requirement (tumor-to-normal (T/N) cell/tissue ratios being more than 2-fold). To solve this problem, there are two ways for choice: one is to increase the ROS level in cancer cells, but not in normal cells, through drug stimulation [11]; the other is to enhance the sensitivity of fluorescent ROS probes so that the probes can sensitively respond to the minor differences in ROS levels to realize the distinction between cancer cells and normal cells. But in any case, designing highly sensitive and selective fluorescent ROS probes is highly desired at present.
Meso-substituted pyronine, boron dipyrromethene (BODIPY), and cyanine have been researched and highlighted in recent literatures [32–37], because the photophysical properties of these dyes, such as fluorescence off-on switching, Stokes shift, and absorption and emission wavelengths, can be adjusted by analyte-triggered changing of meso–substituents [33,34]. On this basis, we recently introduced an aldehyde functional group at the 9th position of pyronine fluorophore to achieve meso–formyl pyronine (PyCHO) in a hope that it can serve as a molecular platform to construct fluorescent probes [38]. In this work, a new pyronine-based fluorescent probe was developed by condensing PyCHO with 2-hydrazinopyridine to form meso–pyridylhydrazone-functionalized pyronine PyHP (Scheme 1A). PyHP displayed a great fluorescence off-on response (200-fold) toward HClO based on the HClO-triggered formation of meso–triazolopyridyl pyronine PyTP (Scheme 1B) that abolishes the C=N isomerization-induced fluorescence quenching. The detection limit of the probe for HClO was determined to be 0.9 nmol/L based on 3σ/k, indicative of its high sensitivity. This probe has successfully been utilized to distinguish cancer from normal cells/tissues in vitro and in vivo in terms of their difference in intracellular basal ROS levels.
With probe PyHP in hand, we first evaluated its photophysical properties and its ability to sense HClO in phosphate buffered saline (PBS, 10 mmol/L, pH 7.4, containing 0.1% CH3CN). As shown in Fig. 1, PyHP presented two broad absorption peaks at 500 and 595 nm, respectively, and exhibited almost no fluorescence (Φf = 0.007) upon excitation at 580 nm due to the rotation of the C=N bond [39]. After adding HClO to the PyHP solution, a prominent absorption peak centered at 600 nm was observed, accompanied by a strong fluorescence emission at 628 nm (Φf = 0.135). The fluorescence enhancement reaches up to 200-fold, indicating that the reaction of PyHP and HClO generates highly fluorescent PyTP [40,41]. The generation of PyTP was further confirmed by 1H-nuclear magnetic resonance (NMR), 13C NMR, and high performance liquid chromatography-high resolution mass spectroscopy (HPLC—HRMS) analysis (Figs. S9–S11 in Supporting information), where the main product produced by the reaction of PyHP and HClO could be classified as PyTP (m/z = 440.2444, calculated value 440.2445, Fig. S11). It is worth noting that the reaction of PyHP and HClO could be completed in less than 15 s, indicative of the rapid sensing ability of the probe for HClO (Fig. S1 in Supporting information).

Subsequently, we performed the fluorescence titration assay. As shown in Fig. 2A, after adding 0−5 equiv. HClO to the PyHP solution, the fluorescence intensity at 628 nm gradually increased and reached saturation at about 2 equiv. And the fluorescence intensity of PyHP at 628 nm has an excellent linear relationship (R2 = 0.9947) with the HClO concentrations in the range of 0−1.4 equiv. (Fig. 2B). Thereby, the detection limit was determined to be as low as 0.9 nmol/L (3σ/k), indicating the possibility of the probe to sense a basal level of HClO within cancer cells. Furthermore, to evaluate the selectivity, we tested the fluorescence response of PyHP towards various biologically relevant species, including various cations, anions, reducing substances, and oxidizing substances. As expected, except for HClO, other biologically relevant species only trigger minor or negligible fluorescence enhancement at 628 nm (Figs. 2C and D, Fig. S2 in Supporting information), indicative of the excellent selectivity of PyHP toward HClO. In addition, the responses of PyHP to HClO at different pH environments were also studied, aiming to explore whether PyHP is also applicable in various physiological environment. In fact, in the pH range of 4−8, PyHP displayed obvious fluorescence off−on response towards HClO (Fig. S3 in Supporting information), indicating that the probe can be used to image HClO under physiological pH. Taken together, the above results establish that PyHP has superior sensitivity and selectivity for HClO, thus being promising to be used to distinguish cancer from normal cells.

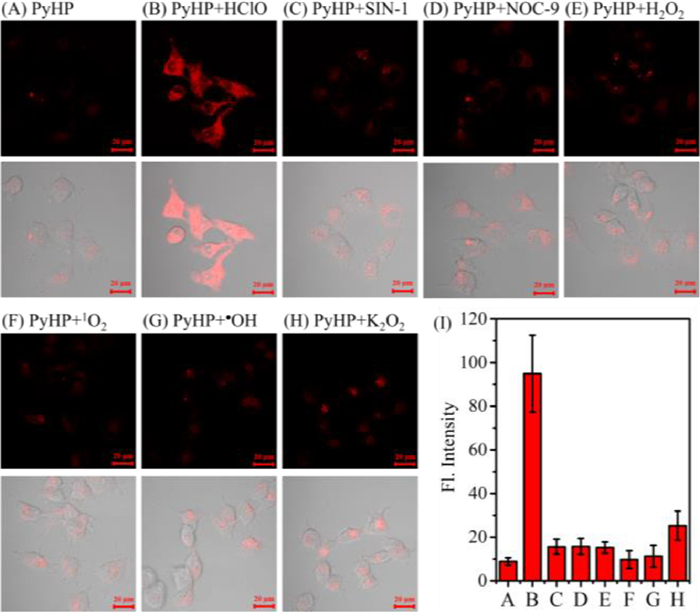
To figure out whether the high selectivity of PyHP for HClO observed in PBS is also feasible in the complex cell environment, we performed the cell imaging assays. As shown in Fig. 3, when normal COS-7 cells were pretreated with PyHP (1 µmol/L) and then treated respectively with various ROS, including HClO, ONOOˉ, NO, H2O2, 1O2, •OH, and O2•− only the HClO-treated cells produced strong fluorescence, which is about 4 times stronger than that observed in other groups. These results strongly indicate that PyHP could selectively image HClO in the complex cell environment. And note that, the costaining assays revealed that PyHP accumulated preferentially in lysosomes (Fig. S4 in Supporting information).
Further, we want to know whether PyHP could also be used to image intracellular endogenous HClO. Thus, the ability of the PyHP to image exogenous HClO was investigated. A series of images was captured in RAW264.7 cells incubated with PyHP under different conditions. As shown in Fig. 4, when RAW264.7 cells were treated with PyHP, only very weak fluorescence was observed; when the cells were pretreated with PyHP and then incubated with HClO, a noticeable fluorescence enhancement was observed; when the cells were treated with lipopolysaccharides (LPS) [42] to induce inflammation, and then incubated with PyHP, bright intracellular fluorescence was also observed, indicating that the probe could also image endogenous HClO. It is known that endogenous HClO is generated from hydrogen peroxide and chloride under the catalysis of myeloperoxidase. As expected, when RAW264.7 cells were pretreated with LPS and 4-aminobenzoic acid hydrazide (ABAH, a myeloperoxidase inhibitor) [43] and then incubated with PyHP, the intracellular fluorescence was effectively inhibited due to the blockage of the HClO production pathway. Taken together, these results revealed that PyHP could also be used to image intracellular endogenous HClO.

Encouraged by the above excellent results, we subsequently assessed the potential of PyHP to distinguish cancer cells from normal ones based on the elevated level of endogenous HClO in cancer cells relative to that in normal cells. A variety of normal cells (BEAS-2B, HUCEC, COS-7) and cancer cells (A549, HepG2, T98G) were selected for the assays. As shown in Fig. 5, when normal cells were incubated with PyHP for 10 min, only a weak fluorescence signal was detected, consistent with the low level of HClO in normal ones; when cancer cells were treated with PyHP under the same condition, they displayed remarkable fluorescence, approximately 4-fold stronger than that in normal cells and exceeding the clinically acceptable threshold of 2.0. The results reveal that PyHP can be utilized to distinguish cancer cells from normal cells.

Further, we investigated the potential of PyHP to image endogenous HClO in living nude mice using a Bruker In vivo FX Pro-small animal optical imaging system with an excitation filter at 590 nm and an emission filter at 700 nm. As shown in Fig. S5 (Supporting information), when the mouse was intraperitoneally (i.p.) injected with PyHP, almost no fluorescence signal was observed; when the mouse was i.p. injected with LPS (2 mg/mL, 100 µL) for 4 h to induce inflammation, followed by i.p. injection of PyHP, an obvious fluorescence signal was observed in the abdominal region, indicating that PyHP could image endogenous HClO in the inflamed mouse model. All the animal experiments were carried out in accordance with the relevant laws and guidelines issued by the Ethical Committee of Shanxi University and the studies were approved by Ethical Committee of Shanxi University.
Encouraged by the above results, we finally appraised the capacity of PyHP in lighting up tumor from mouse models. As shown in Fig. 6, when PyHP (1 mmol/L) was injected into mouse through tail vein, apparent fluorescence was observed at the tumor site after 20 h (Fig. 6A), indicating that PyHP could light up tumor. Then, by dissecting the tumor-bearing mice and imaging heart, liver, spleen, lung, kidney, and tumor, it was found that these organs, except for tumor, only displayed negligible fluorescence; in sharp contrast, tumor presented bright fluorescence (Fig. 6B). The results suggested that PyHP could selectively image tumors due to the overexpressed HClO. Therefore, PyHP is promising to serve as a detection tool to assist in tumor resection in a clinical setting.

In summary, by condensing PyCHO with 2-hydrazinopyridine, a meso–pyridylhydrazone-functionalized pyronine PyHP as a fluorescent probe for HClO was facilely achieved. The probe could highly selectively sense HClO based on the HClO-triggered generation of meso–triazolopyridyl pyronine PyTP that abolishes the C=N isomerization-induced fluorescence quenching and greatly enhances the fluorescence. The excellent sensing performance of the probe for HClO is reflected by large fluorescence off−on response (> 200-fold), short response time (< 15 s), high selectivity, and low detection limit (0.9 nmol/L). Based on the elevated level of HClO in cancer cells or tumors, the probe has been successfully utilized to distinguish cancer cells/tumors from normal ones with high T/N ratios of more than 4. The future research work would concentrate on red-shifting the excitation/emission wavelengths of this type of probe by employing silicon-pyronine or phospha-pyronine for long-term and deep imaging of HClO.
The authors declare that they have no known competing financial interests or personal relationships that could have appeared to influence the work reported in this paper.
We acknowledge Scientific and Technological Innovation Program of Colleges and Universities in Shanxi Province (Nos. 2021L529, 2021L530) and the Fund for Shanxi "1331 Project".
Supplementary material associated with this article can be found, in the online version, at doi:
W. Wang, J. Xiong, X. Song, et al., Anal. Chem. 92 (2020) 13305–13312. doi: 10.1021/acs.analchem.0c02587
H. Zhang, J. Fan, J. Wang, et al., J. Am. Chem. Soc. 135 (2013) 11663–11669. doi: 10.1021/ja4056905
L. Fass, Mol. Oncol. 2 (2008) 115–152. doi: 10.1016/j.molonc.2008.04.001
H. Zhang, J. Liu, B. Hu, et al., Chem. Sci. 9 (2018) 3209–3214. doi: 10.1039/c7sc05407f
T. Huang, W. Kang, B. Zhang, et al., Mol. Cancer 15 (2016) 9. doi: 10.1186/s12943-016-0493-7
M. Mao, X. Wei, H. Sheng, et al., Oncol. Lett. 14 (2017) 7417–7424.
K. Wang, C. Liu, H. Zhu, et al., Coordin. Chem. Rev. 477 (2023) 214946. doi: 10.1016/j.ccr.2022.214946
J. Li, X. Guan, Z. Fan, et al., Cancers 12 (2020) 2767. doi: 10.3390/cancers12102767
D. Crosby, S. Bhatia, K.M. Brindle, Science 375 (2022) eaay9040. doi: 10.1126/science.aay9040
H. Zhang, J. Liu, L. Wang, et al., Biomaterials 158 (2018) 10–22. doi: 10.1016/j.biomaterials.2017.12.013
J. Liu, M. Liu, H. Zhang, W. Guo, Angew. Chem. Int. Ed. 60 (2021) 12992–12998. doi: 10.1002/anie.202102377
J. Yan, X. Liang, Q. Zhang, L. Wang, W. Lin, Chin. Chem. Lett. 35 (2024) 108408. doi: 10.1016/j.cclet.2023.108408
Y. Sun, X. Zhou, L. Sun, et al., Chin. Chem. Lett. 33 (2022) 4229–4232. doi: 10.1016/j.cclet.2022.01.087
W. Chen, Q. Fang, D. Yang, et al., Anal. Chem. 87 (2015) 609–616. doi: 10.1021/ac503281z
L. Yuan, F. Jin, Z. Zeng, et al., Chem. Sci. 6 (2015) 2360–2365. doi: 10.1039/C4SC03883E
W. Zhang, F. Huo, F. Cheng, C. Yin, J. Am. Chem. Soc. 142 (2020) 6324–6331. doi: 10.1021/jacs.0c00992
J. Han, S. Yang, B. Wang, X. Song, Anal. Chem. 93 (2021) 5194–5200. doi: 10.1021/acs.analchem.0c05266
L. Jiang, T. Chen, E. Song, et al., Chem. Eng. J. 427 (2022) 131563. doi: 10.1016/j.cej.2021.131563
Q. Zhou, S. Wang, X. Ran, et al., Chin. Chem. Lett. 34 (2023) 107922. doi: 10.1016/j.cclet.2022.107922
M. Chen, S. Lin, X. Chen, et al., Sens. Actuator. B: Chem. 386 (2023) 133749. doi: 10.1016/j.snb.2023.133749
C. Duan, M. Won, P. Verwilst, et al., Anal. Chem. 91 (2019) 4172–4178. doi: 10.1021/acs.analchem.9b00224
S. Wang, B. Zhu, B. Wang, et al., Chin. Chem. Lett. 32 (2021) 1795–1798. doi: 10.1016/j.cclet.2020.12.039
D. Sun, Z. Chen, J. Hu, et al., Chin. Chem. Lett. 33 (2022) 4478–4494. doi: 10.1016/j.cclet.2021.12.043
R.M. Pascale, D.F. Calvisi, M.M. Simile, C.F. Feo, F. Feo, Cancers 12 (2020) 2819. doi: 10.3390/cancers12102819
M.G. Vander Heiden, L.C. Cantley, C.B. Thompson, Science 324 (2009) 1029–1033. doi: 10.1126/science.1160809
H. Zhu, J. Fan, J. Wang, H. Mu, X. Peng, J. Am. Chem. Soc. 136 (2014) 12820–12823. doi: 10.1021/ja505988g
Z. Liang, Y. Sun, H. Zeng, et al., Anal. Chem. 92 (2020) 16130–16137. doi: 10.1021/acs.analchem.0c03806
Y. Xiao, X. Yin, P. Sun, et al., Chin. Chem. Lett. 33 (2022) 5051–5055. doi: 10.1016/j.cclet.2022.03.109
Y. Chen, J.Y. Lim, X.H. Wu, et al., Dyes Pigm. 195 (2021) 109666. doi: 10.1016/j.dyepig.2021.109666
X. Wei, H. Zhang, Y. Sun, J. Liu, Z. Li, Analyst 146 (2021) 495–501. doi: 10.1039/d0an01925a
Z. Wu, Z. Liang, S. Guo, et al., Sens. Actuator. B: Chem. 359 (2022) 131577. doi: 10.1016/j.snb.2022.131577
C. Wang, W. Chi, Q. Qiao, et al., Chem. Soc. Rev. 50 (2021) 12656–12678. doi: 10.1039/d1cs00239b
M. Yan, D. He, L. Zhang, et al., TrAC Trends Analyt. Chem. 157 (2022) 116771. doi: 10.1016/j.trac.2022.116771
D. He, L. Zhang, Y. Sun, Coordin. Chem. Rev. 461 (2022) 214507. doi: 10.1016/j.ccr.2022.214507
Y. Song, H. Zhang, X. Wang, et al., Anal. Chem. 93 (2021) 1786–1791. doi: 10.1021/acs.analchem.0c04644
W. Chi, Q. Qiao, R. Lee, et al., Angew. Chem. Int. Ed. 58 (2019) 7073–7077. doi: 10.1002/anie.201902766
K.M. Atkinson, J.J. Morsby, S.S.R. Kommidi, B.D. Smith, Org. Biomol. Chem. 19 (2021) 4100–4106. doi: 10.1039/d1ob00426c
L. Wang, J. Liu, H. Zhang, W. Guo, Sens. Actuator. B: Chem. 334 (2021) 129602. doi: 10.1016/j.snb.2021.129602
J.S. Wu, W.M. Liu, X.Q. Zhuang, et al., Org. Lett. 9 (2007) 33–36. doi: 10.1021/ol062518z
H. Teng, J. Tian, D. Sun, et al., Sens. Actuators B: Chem. 319 (2020) 128288. doi: 10.1016/j.snb.2020.128288
Y. Zhang, H. Teng, Y. Gao, et al., Chin. Chem. Lett. 31 (2020) 2917–2920. doi: 10.1016/j.cclet.2020.03.020
R.B. Lorsbach, W.J. Murphy, C.J. Lowenstein, S.H. Snyder, S.W. Russell, J. Biol. Chem. 268 (1993) 1908–1913. doi: 10.1016/S0021-9258(18)53940-5
J.J. Hu, N.K. Wong, Q. Gu, et al., Org. Lett. 16 (2014) 3544–3547. doi: 10.1021/ol501496n

Scheme 1 Synthesis route of fluorescent probe PyHP (A) and proposed fluorescence sensing mechanism of the probe for HClO (B). Red arrow in (B) indicates C=N isomerization.

Figure 1 The absorption and emission spectra of PyHP (2 µmol/L) before and after the reaction with 2 equiv. HClO at room temperature. λex = 580 nm, slits: 5/5 nm, voltage: 700 V.

Figure 2 (A) Fluorescence spectra of PyHP (2 µmol/L) treated with HClO (0−10 µmol/L. (B) The linear relationship between fluorescence intensity of PyHP at 628 nm and concentrations of HClO. (C, D) Fluorescence responses of PyHP toward NaClO and various biologically relevant species, including (1) HClO, (2) ONOO−, (3) 1O2, (4) HO•, (5) H2O2, (6) KO2, (7) nitric oxide (NO), (8) NO2−, (9) cystein (Cys), (10) homocysteine (Hcy), (11) glutathione (GSH), (12) HS−, (13) L-ascorbic acid (Vc), (14) dl-dithiothreitol (DTT), (15) Fe3+, (16) Fe2+, (17) Cu2+, (18) Ca2+, (19) Mg2+, (20) Zn2+, (21) Br−, (22) Cl−, (23) I−, (24) SO32−, (25) SO42−, and (26) ClO4−. Concentrations for (1–2), 4 µmol/L; for (3–7), 20 µmol/L; for (8–26), 200 µmol/L. λex = 580 nm; λem = 628 nm; slits: 5/5 nm; voltage: 700 V; T = 25 ℃.

Figure 3 (A–H) Confocal microscopic images of COS-7 cells pretreated with PyHP (1 µmol/L) for 20 min and then treated with various ROS, including (A) control, (B) HClO (20 µmol/L), (C) SIN-1 (200 µmol/L), (D) NO (NOC-9: 200 µmol/L), (E) H2O2 (200 µmol/L), (F) 1O2 (ClO−/H2O2: 20 µmol/L/200 µmol/L), (G) •OH (Fe2+/H2O2: 100 µmol/L/200 µmol/L, and (H) O2•− (xanthine/xanthine oxidase: 200 µmol/L/0.01 U/mL). (I) Average fluorescence intensity from images of A–H. Results are statistical analyses of > 10 cells, and error bars represent standard deviations. Emission was collected at 570–670 nm (λem = 561 nm). Scale bar: 20 µm.

Figure 4 (A) Fluorescence images of RAW264.7 cells under different conditions. (ⅰ) PyHP (1 µmol/L, 10 min)-loaded cells; (ⅱ) PyHP-loaded cells treated with 20 µmol/L of HClO; (ⅱ, ⅳ) cells pretreated with LPS (10 µg/mL) for 12 h in the absence and presence ABAH (200 µmol/L), and then treated with PyHP (1 µmol/L) for 10 min. Emission was collected at 570–670 nm (λex = 561 nm). Scale bar: 20 µm. (B) Quantification of the mean fluorescence density of A. Results are statistical analyses of > 10 cells, and error bars represent standard deviations. Scale bar: 20 µm.

Figure 5 (A) Fluorescence images of normal BEAS-2B, HUCEC, and COS-7 cells and cancerous A549, HepG2, and T98G cells, all of which were treated with PyHP (1 µmol/L) for 10 min., Emission was collected at 570−670 nm (λex = 561 nm). (B) Average fluorescence intensity from images of A. Scale bar: 50 µm.

Figure 6 (A) Fluorescence imaging of HeLa tumor-bearing mice 20 h after injection of PyHP (1 mmol/L) via tail vein. (ⅰ) Bright field; (ⅱ) fluorescence field; (ⅲ) superposition of bright field and fluorescence field. (B) Images of the anatomical organs of mice injected with the probe (from left to right): heart, liver, spleen, lung, kidney, and tumor. (ⅰ) Bright field; (ⅱ) fluorescence field; (ⅲ) superposition of bright field and fluorescence field. An excitation filter of 590 nm and an emission filter of 700 nm were used.

 扫一扫看文章

扫一扫关注我们
 DownLoad:
 下载:
下载: