Received Date:
28 June 2023 Accepted Date:
10 August 2023 Revised Date:
09 August 2023 Available Online:
15 June 2024
Abstract:
Artemisinin (ART) resistance has been an emerging clinical problem, severely compromising antimalarial efficacy and threatening the global malaria elimination campaign. Albeit intensive studies about the molecular mechanism for ART resistance are under way, no effective therapeutic targets for reversing resistance have been applied. Here, we explore glutathione (GSH) as a therapeutic target to develop a thermo-responsive nanoplatform to specifically co-deliver ART and GSH synthesis inhibitor (L-buthionine sulfoximine, BSO) in a sustained manner, effectively reversing ART resistance in vivo. By combining with BSO, ART exerts increased antimalarial activity with reduced half-maximal inhibitory concentration (IC50) by 7.43-fold in ART-resistant strains. This work reveals that the GSH in ART-resistant parasites can be a promising therapeutic target for reversing ART resistance, paving the way for developing drug candidates and intelligent nanomedicines in malaria therapy.
Malaria has historically influenced human lives and remains one of the life-threatening infectious diseases with more than 200 million new cases annually [1]. Current antimalarial drugs are rapidly losing efficacy, and standard-of-care artemisinin (ART)-based combination therapies (ACTs) fail to cure malaria in about 50% of patients in some regions of Asia [2]. Clinically validated ART resistance has now been found in the African region where the malaria transmission cases are consistently high [3,4]. Emergence and spread of ART resistance raise risk of reducing world-wide malaria burden and threaten future malaria control and elimination. Current ways to solving ART resistance mainly involve developing new drugs [5,6], but no alternative drug is effective enough to replace ART [7]. Thus, effective strategies are urgently needed to reverse ART resistance, expand possible therapy options, and enable more effective combination treatments.
Molecular mechanism for the ART resistance remains elusive, albeit intensive molecular and phenotypical characterization are under way [8,9]. Genome wide association studies have revealed that more than 1000 genes associated with clinical resistance to artemisinins [10]. In addition to gene mutations, ART resistance in P. falciparum parasites can be explained as a redox-mediated phenomenon [11]. Since the action mechanism of ART involves iron-catalyzed reductive homolytic cleavage of the unique endoperoxide bridge, generating an alkylating carbon-centered radicals which react with heme to produce massive reactive oxygen species (ROS) [12], leading to the enhanced oxidative stress and protein damage [13–15]. To detoxify the ROS-induced damage, glutathione (GSH), as one of the parasite's main antioxidant systems, is upregulated to maintain a better homeostasis regulation to resist ART exposure [16,17]. GSH is expected as a therapeutic target for reversing ART resistance, but has not been applied yet.
In this work, we select a GSH synthesis inhibitor (L-buthionine sulfoximine, BSO) to downregulate GSH level in Plasmodium-infected erythrocytes. Nanomaterials, serving as promising tools to accommodate multiple drugs and modulate their release profiles, have gained increasing attention in recent years [18–20]. We leveraged a thermo-responsive nanoplatform (TRN) to specifically co-deliver ART and BSO to erythrocytes infected with ART-resistant parasites, reversing ART resistance (Fig. 1). TRNs possess core-shell structure for loading hydrophobic ART in the core and absorbing BSO in the shell. They swell at 4 ℃ to accommodate drugs and deswell at 37 ℃ to obtain sustained release pattern of cargos. To selectively enter infected erythrocytes instead of normal red blood cells (RBCs), TRNs were modified with choline analogs to recognize erythrocyte choline carriers (ECCs) which expressed specifically on parasite-infected erythrocytes membrane [21,22]. In mice infected with ART-resistant parasites, the TRN nanoformulations comprising low-dose ART (20% of the standard dose) and BSO remarkably prolonged their survival time in contrast to free ART at the standard dose. Our work validates the efficacy of GSH as a therapeutic target for reversing ART resistance. We envision that other approach to enhance oxidative stress would be potential for overcoming ART resistance.
Figure 1
Figure 1.
Reversing ART resistance by downregulating GSH level using a TRN to co-deliver ART and BSO in a sustained manner. TRN is decorated with Chos and encapsulates ART inside the core and BSO inlaid the shell layer. After intravenous injection, TRN enables selective entrance to the infected erythrocytes by recognizing the specific ECCs on the membrane. Subsequently, intracellular TRNs are slowly disassembled and initiate sustained release of both agents. The released BSO downregulates GSH level in parasites, companying with the intramolecular chain oxidation of ART, resulting in elevated ROS level. The unbalanced redox environment leads to mitochondrial dysfunction and DNA fragmentation of parasites, potentiating antimalarial efficacy of ART in ART-sensitive Plasmodium, and more importantly reversing ART resistance in ART-resistant Plasmodium.
We proposed that the elevated GSH was a general mechanism for Plasmodium to resist ART treatment. A clinical strain 6218 isolated from Battambang [23] was used as ART-resistant parasites to validate the hypothesis, with ART-sensitive strain 3D7 as comparison. Firstly, we evaluated the antimalarial efficacy of ART and BSO in ART-resistant versus sensitive strains by measuring its half-maximal inhibitory concentration (IC50) using SYBR Green I fluorescence assay [24]. The IC50s determined for ART in 3D7 and 6218 strain were 5.90 and 32.48 nmol/L, respectively. When combined with BSO, IC50 value of ART was reduced by 0.23-fold in 3D7 parasites and by 7.43-fold in 6218 parasites, respectively (Figs. 2a and b). While IC50s of BSO in 3D7 and 6218 strains were 59.75 and 56.66 µmol/L, respectively, implying the poor and nearly indiscriminate antimalarial activities in both parasites (Fig. S1 in Supporting information). Furthermore, to clearly describe the interaction effects between ART and BSO in 6218 strains, their combination index (CI) values were calculated via 25 combinations with different ratios of both drugs (Fig. 2c and Table S1 in Supporting information). ART and BSO exhibited obvious synergistic interaction (CI < 1) at most concentration combinations. To note, for the combination of ART and BSO both at their IC50, the CI value was 0.26 in 6218 parasites and the inhibition rate was up to 99% (Table S2 in Supporting information). For the further assays in vitro, the concentrations of ART and BSO at their respective IC50 were selected.
Figure 2
Figure 2.
BSO improves the antimalarial efficacy of ART in ART-resistant parasites. Viability of ART-sensitive parasites (a) and ART-resistant parasites (b) treated with ART or BSO. The infected RBCs were incubated with various concentrations of ART or 30 nmol/L BSO for 72 h, with untreated parasites as control. BSO-mediated reduction of IC50 for ART was indicated. (c) Normalized isobologram analysis in 6218 parasites. DART, DBSO, (EDX)ART and (EDX)BSO are the dose of ART and BSO used in combination or alone to produce effect x (inhibition%). The various colored symbols show data points of various combinations. The red line indicates additive effect. The data points below the red line indicate synergy, whereas the data points above denote antagonism. (d) Schematics of biosynthesis and transport of GSH in P. falciparum and its host cell, and the action effects of ART and BSO on this process. (e) Determination of relative GSH levels of ART-sensitive and resistant parasites. The foldchange of GSH changes (f), GSH/GSSG ratio changes (g) and ROS changes (h) for ART and ART + BSO treatment between 3D7 and 6218 parasites. Data are represented as means ± standard deviation (SD) of three independent experiments. Statistical analyses were done with two-tailed unpaired Student's t-test.
In malaria parasites, GSH is a key player in the detoxification of reactive oxygen which is produced by antimalarial drugs, hemoglobin digestion, and the host's immune system [25,26]. The GSH level has been reported to correlate with chloroquine (CQ) resistance in parasites, and even drug resistance in cancer cells [27]. The aforementioned tests demonstrated that BSO improved the antimalarial efficacy of ART, the mechanism behind which was further explored. As a γ-glutamylcysteine synthetase (γ-GCS) inhibitor, BSO could inhibit the biosynthesis of GSH as well as its transportation (Fig. 2d). Thus, the total GSH in parasites and the changes after exposure to various treatments were evaluated. Results showed that the total GSH level in ART-resistant P. falciparum was significantly higher by 27.71% than that in ART-sensitive one (P = 0.0009), correlating with higher potentials of protecting parasites from oxidative stress (Fig. 2e). In ART-sensitive strain (3D7), relative to the untreated group, ART + BSO treatment induced 10.30% increase versus ART alone in downregulating GSH level, while the increase was more obvious (24.01%) in ART-resistant strain (Fig. S2 in Supporting information). The change in GSH levels for ART and ART + BSO between 3D7 and 6218 strains was significantly obvious (P = 0.0036) (Fig. 2f).
GSH levels are not only regulated via biosynthesis but also by efflux and reduction to oxidized glutathione (GSSG) [28]. The GSH/GSSG redox couple is the major redox buffer in the cytosol and acts as an indicator of the cellular redox status [29–31]. The GSH/GSSG ratio was calculated after measuring the amount of GSSG. In both strains, the GSH/GSSG ratios were decreased more after ART + BSO treatment than single ART therapy. While the combination treatment induced 12.24% reduction of GSH/GSSG ratio for 3D7 strain and 39.74% for 6218 parasites (Fig. S3 in Supporting information). Thus, BSO improved the efficacy of ART in ART-resistant parasites in decreasing GSH/GSSG ratio by 2.25-fold compared with its effect on ART-sensitive parasites (Fig. 2g).
The GSH/GSSG redox system in parasites is the primary defense against oxidative damage caused by ROS. And ART increases the content of ROS in the infected red blood cells (iRBCs) via intramolecular oxygen bridge breakage, which results in damage to the structure and function of the iRBCs. As a consequence, the decreased GSH caused by BSO would further aggravate the oxidative stress caused by ART, finally leading to the death of iRBCs. To evaluate the oxidative stress, ROS was measured using fluorescence spectrophotometry. Compared with the untreated control, BSO could not enhance the ROS level caused by ART in 3D7 strain, but significantly improve that in 6218 parasites (Fig. S4 in Supporting information). And the elevated ROS level for ART + BSO versus ART in 6218 strains was 148% of that in 3D7 strain (Fig. 2h). Altogether, BSO could significantly improve the effect of ART on increasing oxidative stress characterized as ROS level by downregulating the total GSH level and GSH/GSSG ratio in ART-resistant parasites. And ART-resistant parasites are more easily affected by BSO treatment than ART-sensitive parasites.
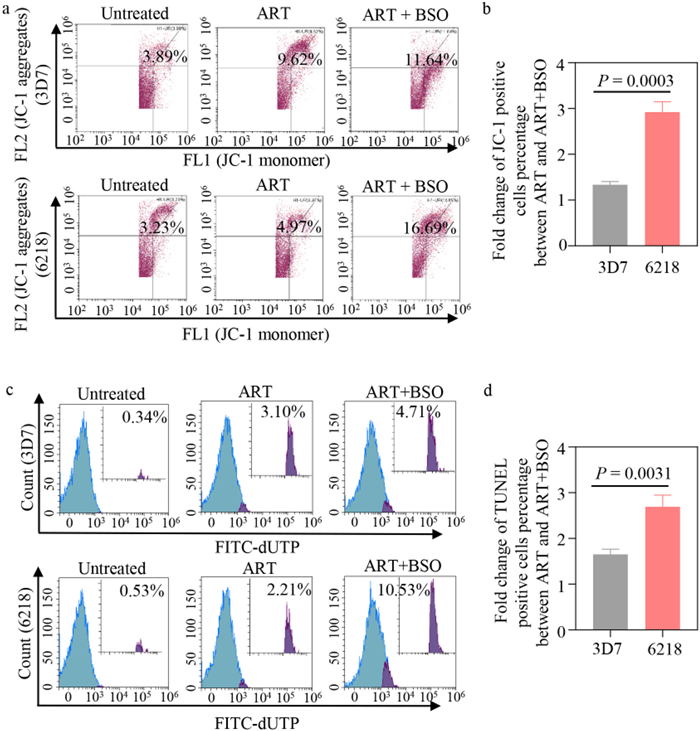
It is well known that mitochondria are especially sensitive to oxidative stress and enhanced ROS levels can affect the function of mitochondria as a result of aggravated oxidative damage [32,33]. Mitochondrial membrane potential is a key indicator of mitochondrial activity, because it reflects the process of electron transport and oxidative phosphorylation, and is the driving force behind ATP production [34]. To detect mitochondrial dysregulation, we conducted mitochondrial membrane potential assay using JC-1 probe. Malaria parasites receiving different treatments were stained with JC-1 dye and analyzed using flow cytometry (Fig. S5a in Supporting information) [35]. In 3D7 strain, the parasites that exposed ART and ART + BSO at their IC50 displayed mitochondrial potential loss as 9.00% and 12.02%, respectively (Fig. 3a, Figs. S6a and b in Supporting information). In 6218 parasites, the discrepancy of green fluorescence value between both groups was more obvious (3.01-fold) than that in 3D7 strain (1.34-fold) (Fig. 3b, Figs. S6c and d in Supporting information).
Figure 3
Figure 3.
The enhanced oxidative stress induces the apoptosis of P. falciparum. The flow cytometry analysis of mitochondrial membrane potential loss (a) and DNA fragmentation (c) in ART-sensitive (3D7) and resistant parasites (6218) after treatment of ART (IC50) and ART + BSO (ART, IC50; BSO, IC50). The comparison of the mitochondrial damage changes (b) and DNA fragmentation changes (d) for ART and ART + BSO between 3D7 and 6218 parasites. Data are presented as mean ± SD (n = 3), with two-tailed unpaired Student's t-test.
As mitochondrial dysfunction is an early common event in the apoptosis of malaria parasites, DNA fragmentation is a characteristic event when parasites die [36]. DNA alterations could be detected by the terminal deoxynucleotidyl transferase dUTP nick end labeling (TUNEL) assay, which is the preferred method for detecting apoptosis (Fig. S5b in Supporting information) [37]. Results showed that the percentage of TUNEL-positive cells increased from 0.30% (the untreated) to 2.91% for ART and to 4.80% for ART + BSO in 3D7 parasites, respectively (Fig. 3c, Figs. S7a and b in Supporting information). By contrast, in 6218 strain ART+BSO and ART treatment induced the foldchange of DNA fragmentation relative to the untreated control was 3.56 and 9.60, respectively (Fig. 3c, Figs. S7c and d in Supporting information). The more obvious increase of in-situ DNA fragmentation between ART and ART + BSO in ART-resistant parasites than sensitive parasites (2.69-fold versus 1.65-fold) revealed that BSO could enhance the vulnerability of ART-resistant parasites to ART (Fig. 3d).
The results above show that BSO + ART treatment induces the loss of mitochondrial membrane potential and DNA fragmentation in both ART-sensitive and resistant parasites, as a result of elevated ROS levels. To note, the more severe oxidative damage was observed in ART-resistant parasites, consistent with the speculation that the sensitivity of parasites to ART and the effectiveness of the drugs combination may be relative to the elevation extent of GSH.
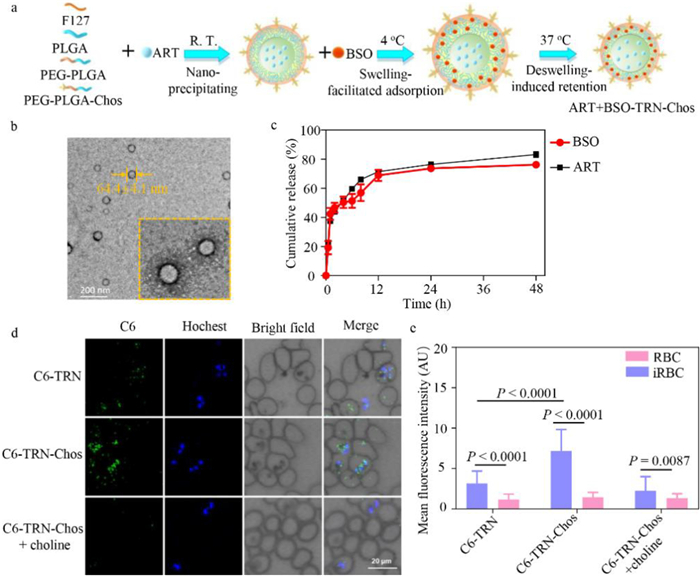
To co-deliver ART and BSO, a TRN was fabricated using fine-tuned method as described before [38]. The designed TRN was constructed from poly(lactic-co-glycolic acid) (PLGA), poly(ethylene glycol)-block-PLGA (PEG-PLGA) and Pluronic F127, and was decorated with choline analogs (Chos). Hydrophobic ART was easily encapsulated in the core via hydrophobic-hydrophobic interactions, and BSO was inlaid in the shell by electrostatic interaction with COO− and by the extended space caused by the swelling shell at 4 ℃ (Fig. 4a). At first, we explored the suitable PLGA/F127 ratio to get the smaller hydrodynamic diameter of 113.7 ± 1 nm, with 1:10 as the best ratio (Fig. S8a in Supporting information). A total of 9 tests were further set to optimize the preparation conditions of TRNs by regulating the feeding ratio, acetone volume and dropping speed, obtaining the highest encapsulation efficiency of ART (48.4%) (Table S3 in Supporting information). The temperature-responsive swelling/deswelling behavior of TRNs was validated as the hydrodynamic diameter decreased with the increasing temperature (Fig. S8b in Supporting information). At this basis, the exploration of BSO adsorption was then conducted at different temperature (4, 25 and 37 ℃), and the encapsulation efficiency of BSO increased up to 34.8% at 4 ℃ (Table S4 in Supporting information). And TRNs showed spherical core-shell structure whose size was 64.4 ± 4.1 nm and shell thickness was 20.4 ± 2.3 nm (zoomed-in image) (Fig. 4b). Besides, TRNs possessed good stability in phosphate-buffered saline (PBS) with the negligible hydrodynamic diameter change and the zeta potential maintaining −20 mV for 7 days (Fig. S8c in Supporting information). Furthermore, in vitro drug accumulative release kinetics were performed to evaluate the release capability of the vehicle [39]. As shown in Fig. 4c, the encapsulated ART exhibited sustained release up to 83.2% at 48 h. Also, the loaded BSO slowly released 76.2% within 48 h, probably due to the constraint of the deswelling shell in 37 ℃. Results above showed that TRNs could be used as an optimal vector to realize sustained release of ART and BSO.
Figure 4
Figure 4.
The TRN enables co-encapsulation and sustained release of ART and BSO. (a) Schematic illustration of the fabrication process of ART+BSO-TRN-Chos. (b) Transmission electron microscope (TEM) images of TRNs with a zoom-in view shown at the bottom right. Scale bar: 200 nm. (c) In vitro accumulative release profiles of ART and BSO from TRNs in the PBS buffer (pH 7.4) at 37 ℃. (d) Fluorescence confocal microscopy images of the erythrocytes from malaria-infected mice co-incubated with C6-TRN-Chos and C6-TRN for 1.5 h at 37 ℃ with or without the pre-treatment of choline solution (2 mg/mL). Scale bar, 20 µm. (e) The florescence intensity in (d) was further statistically quantified. Data are represented as mean ± standard error of mean (S.E.M.) (n ≥ 3 independent experiments).
To endow the targetability with TRNs, Chos which could specifically recognize ECCs on the membrane of the iRBCs were conjugated with PLGA polymer. We synthesized PEG-PLGA-Chos as the procedure displayed in Fig. S9 (Supporting information). The obtained product was validated by nuclear magnetic resonance (1H NMR) spectroscopy (Fig. S10 in Supporting information). We assumed that TRN-Chos could selectively enter into iRBCs mainly through the specific ECCs on iRBCs membrane. In order to verify the speculation, we used coumarin 6 (C6), a fluorescent dye, as the payload of TRNs, to reveal the selective accumulation of TRN-Chos under the confocal microscopy. Results showed C6-TRN-Chos could specifically enter iRBCs in larger numbers comparing with C6-TRN. To confirm the specificity of the interaction, we conducted competitive inhibition experiment by co-incubating with choline, which was naturally transported by ECCs. Confocal images showed that with the simultaneous addition of choline with C6-TRN-Chos, the number of green fluorescence dots inside the iRBCs was significantly reduced (Fig. 4d). The fluorescence intensity in different groups was quantified by flow cytometry, and consistent with the change tendency in confocal images (Fig. 4e). All these results supported that TRNs could efficiently co-deliver ART and BSO to iRBCs and release them in a sustained manner.
To explore the antimalarial efficacy of combining ART and BSO in vivo, we conducted animal experiments which complied with the guidelines and protocols approved by the Care and Use of Laboratory Animals of Shanxi Medical University. We leveraged TRN modified with Chos to specifically deliver both drugs to iRBCs, aiming at improving the therapy effect of ART in ART-resistant parasites. The in vivo therapeutic effect was evaluated using a 4-day suppressive standard test. First we explored the in vivo dose effect of both agents on antimalarial efficacy. At the 24 h post treatment with varying doses of ART, inhibitory rate was calculated by measuring parasitaemia, obtaining the median effective concentration (EC50) of ART: 3 mg/kg (Table S5 in Supporting information). At this basis, the optimal dosage of BSO was chosen as 200 mg/kg, with the inhibitory rate as high as 74.33% (Table S6 in Supporting information). As shown in Fig. 5a, ART-resistant animal model was built. The standard-dose ART reduced parasitemia of mice comparing with the saline group (21.63% versus 31.51%), with 42.35% inhibitory rate. Despite low-dose ART (20% of the standard dose) slightly inhibited parasitemia (24.45% inhibitory rate), its combination with BSO significantly increased the inhibitory rate up to 47.52%. Interestingly, when low-dose ART and BSO co-encapsulated in TRN, obvious elevation in parasitemia inhibition (78.29%) was found as compared to their physical mixture (P < 0.0001) (Figs. 5b and c). Moreover, the survival time of all mice was assessed over a period of 40 days. Saline-treated mice began to die on the 11th day after infection, with the median survival time of 12 days. The standard-dose ART moderately prolonged the survival time to 17 days, which is better than low-dose ART (16 days) and comparable to low-dose ART plus BSO (18 days). When ART and BSO were delivered by TRN, the nanoformulation remarkably prolonged survival time of malaria mice, with optimal survival rate of 71% until day 40 (Fig. 5d).
Figure 5
Figure 5.
Therapeutic efficacy evaluation in vivo. (a) Schematic illustration of the treatment regime. Briefly, the ICR mice were i.p. engrafted with RBCs infected with 1 × 10⁷ ART-resistant Plasmodium berghei (K173 strain) on day 1 and then received intravenous injection of various formulations: saline, free ART (standard dosage, 15 mg/kg), free low-dose ART (20% of standard dosage, 3 mg/kg), physical mixture of ART (20% of standard dosage, 3 mg/kg) and BSO (200 mg/kg), and ART+BSO-TRN-Chos (ART, 3 mg/kg; BSO, 200 mg/kg) on day 1, 2, 3 and 4. The parasitemia of mice was monitored every day until the mice died. (b) The percentage of parasitemia in mice received different treatments on day 5 (n = 7). (c) The parasitemia inhibitory rate of various treatments with the saline group as comparison. Data are presented as mean ± SD, with two-tailed unpaired Student's t-test. (d) Survival curves of mice received the indicated treatments. Data were analyzed using log-rank test (n = 7). Data are presented as mean ± SD, with two-tailed unpaired Student's t-test.
Therapeutic safety is another important aspect for the application of the combinational nanoformulations, in addition to therapeutic efficacy. Although we have demonstrated that TRN carrier components and the drugs-loaded TRN formulations possessed good biosafety in vitro (Fig. S11 in Supporting information), the in vivo safety was evaluated after therapy. During the overall treatment period, compared with the healthy mice, the body weight of untreated malaria mice apparently declined due to the infection, and so did the ART-treated mice maybe because of the side effect of high dosage. While TRN-treated mice did not reduce body weight, suggesting no severe systemic toxicity induced by TRN treatment (Fig. S12 in Supporting information). At the end of treatment, the infected mice were euthanized, and their blood samples and major organs were harvested for blood examination and histology analysis. The levels of aspartate aminotransferase (AST), alanine aminotransferase (ALT) and alkaline phosphatase (ALP) in all groups were measured. Using the blood biochemical indexes of healthy mice as the standard, their levels in TRN-treated mice were within the normal range but those in other groups were not all normal (Figs. S13a–c in Supporting information).
Besides, hematoxylin and eosin (H & E) staining results suggested that no obvious heart disruption, kidney injury and pulmonary toxicity were found for all groups. Whereas for liver section of the untreated mice, there was observable inflammation infiltration (red arrow) and large brown-yellow pigmentation (yellow arrow) positing the liver sinusoids comparing with those of healthy mice. And in the spleen images from untreated mice, the number of white pulp was greatly reduced and with unclear structure (black arrow), and the red pulp existing massive brown-yellow pigmentation (yellow arrow). The standard-dose ART also induced abnormal white pulp (black arrow) (Fig. S13d in Supporting information). The severe symptoms above were absent in TRN-treated mice, implying therapeutic safety of the nanoformulation. The hematological analysis results also showed that the number of white blood cells (WBCs) and lymphocytes of untreated mice was elevated significantly and out of the normal range, suggesting the disorder of immune system due to the infection of malaria. The RBCs, as the host cells of parasites, was strongly decreased in untreated group and standard-dose ART group (Fig. S13e in Supporting information). The results above corroborated that malaria infection would damage the liver and spleen tissues of mice. Compared with low-dose ART, standard-dose ART may cause nonspecific toxicity to some extent. Whereas no obvious abnormalities appeared in TRN-treated mice, owing to the low dosage used and TRN-mediated specific antimalarial efficacy, which was displayed by plenty of nanomaterials [40–43]. Altogether, TRN could function as an optimal delivery system for ART and BSO to synergistically exert antimalarial efficacy in ART-resistant mice, and be helpful for lowing the ART dosage used and avoiding undesirable side effect.
In summary, our findings validated that the elevated GSH in ART-resistant parasites could be a mechanism for ART tolerance, highlighting it as a potential therapeutic target for reversing ART resistance. BSO was selected to downregulate GSH level whereby the antimalarial efficacy of ART was proven to be potentiated. Our work provides first demonstration of the high synergy of ART and BSO with CI values of 0.26 in their IC50s in ART-resistant parasites. With the assistance of BSO, ART exerted enhanced antimalarial activity, characterized as the reduced IC50 by 6.97-fold in ART-resistant strain. The mechanism exploration showed that the decreased GSH mediated by BSO sensitized parasites to the oxidative damage caused by ART, leading to elevated mitochondrial dysfunction and DNA fragmentation of parasites. In vivo we leveraged a thermo-responsive nanoplatform to specially co-deliver ART and BSO to the iRBCs via the modification of Chos. TRN could alter the pharmacodynamics and biosafety of the payloads, enabling the improved antimalarial effects and decreased biotoxicity in mice infected with ART-resistant parasites. To be notable, TRN nanoformulation comprising 20% of the standard-dose ART and BSO could strongly prolong the survival time of mice infected with ART-resistant parasites compared with free ART at the standard dose. It is worthy to highlight that the lowered dosage of ART used would decrease the drug pressure on parasites and benefit the delay of the emergence of ART resistance. We envision that the targeted TRN nanoformulation is expected to serve as a therapeutic candidate for translation in clinics. As an example of nanomaterial-based antimalarials, this work paves the way for the development of available drugs combinations, and intelligent nanomedicines to overcome ART resistance.
Declaration of competing interest
The authors declare that they have no known competing financial interests or personal relationships that could have appeared to influence the work reported in this paper.
Acknowledgment
This work was supported by the National Natural Science Foundation of China (Nos. 81803470 and 82173767).
Supplementary materials
Supplementary material associated with this article can be found, in the online version, at doi:10.1016/j.cclet.2023.108929.
[1]
World malaria report 2021, World Health Organization, 2021, https://www.who.int/data/gho/data/themes/malaria.
[2]
A.M. Dondorp, F. Nosten, P. Yi, et al., N. Engl. J. Med. 361 (2009) 455–467. doi: 10.1056/NEJMoa0808859
[3]
F. Lu, R. Culleton, M. Zhang, et al., N. Engl. J. Med. 376 (2017) 991–993. doi: 10.1056/NEJMc1612765
[4]
A.O. Talisuna, C. Karema, B. Ogutu, et al., Lancet Infect. Dis. 12 (2012) 888–896. doi: 10.1016/S1473-3099(12)70241-4
[5]
S.C. Xie, R.D. Metcalfe, E. Dunn, et al., Science 376 (2022) 1074–1079. doi: 10.1126/science.abn0611
Figure 1
Reversing ART resistance by downregulating GSH level using a TRN to co-deliver ART and BSO in a sustained manner. TRN is decorated with Chos and encapsulates ART inside the core and BSO inlaid the shell layer. After intravenous injection, TRN enables selective entrance to the infected erythrocytes by recognizing the specific ECCs on the membrane. Subsequently, intracellular TRNs are slowly disassembled and initiate sustained release of both agents. The released BSO downregulates GSH level in parasites, companying with the intramolecular chain oxidation of ART, resulting in elevated ROS level. The unbalanced redox environment leads to mitochondrial dysfunction and DNA fragmentation of parasites, potentiating antimalarial efficacy of ART in ART-sensitive Plasmodium, and more importantly reversing ART resistance in ART-resistant Plasmodium.
Figure 2
BSO improves the antimalarial efficacy of ART in ART-resistant parasites. Viability of ART-sensitive parasites (a) and ART-resistant parasites (b) treated with ART or BSO. The infected RBCs were incubated with various concentrations of ART or 30 nmol/L BSO for 72 h, with untreated parasites as control. BSO-mediated reduction of IC50 for ART was indicated. (c) Normalized isobologram analysis in 6218 parasites. DART, DBSO, (EDX)ART and (EDX)BSO are the dose of ART and BSO used in combination or alone to produce effect x (inhibition%). The various colored symbols show data points of various combinations. The red line indicates additive effect. The data points below the red line indicate synergy, whereas the data points above denote antagonism. (d) Schematics of biosynthesis and transport of GSH in P. falciparum and its host cell, and the action effects of ART and BSO on this process. (e) Determination of relative GSH levels of ART-sensitive and resistant parasites. The foldchange of GSH changes (f), GSH/GSSG ratio changes (g) and ROS changes (h) for ART and ART + BSO treatment between 3D7 and 6218 parasites. Data are represented as means ± standard deviation (SD) of three independent experiments. Statistical analyses were done with two-tailed unpaired Student's t-test.
Figure 3
The enhanced oxidative stress induces the apoptosis of P. falciparum. The flow cytometry analysis of mitochondrial membrane potential loss (a) and DNA fragmentation (c) in ART-sensitive (3D7) and resistant parasites (6218) after treatment of ART (IC50) and ART + BSO (ART, IC50; BSO, IC50). The comparison of the mitochondrial damage changes (b) and DNA fragmentation changes (d) for ART and ART + BSO between 3D7 and 6218 parasites. Data are presented as mean ± SD (n = 3), with two-tailed unpaired Student's t-test.
Figure 4
The TRN enables co-encapsulation and sustained release of ART and BSO. (a) Schematic illustration of the fabrication process of ART+BSO-TRN-Chos. (b) Transmission electron microscope (TEM) images of TRNs with a zoom-in view shown at the bottom right. Scale bar: 200 nm. (c) In vitro accumulative release profiles of ART and BSO from TRNs in the PBS buffer (pH 7.4) at 37 ℃. (d) Fluorescence confocal microscopy images of the erythrocytes from malaria-infected mice co-incubated with C6-TRN-Chos and C6-TRN for 1.5 h at 37 ℃ with or without the pre-treatment of choline solution (2 mg/mL). Scale bar, 20 µm. (e) The florescence intensity in (d) was further statistically quantified. Data are represented as mean ± standard error of mean (S.E.M.) (n ≥ 3 independent experiments).
Figure 5
Therapeutic efficacy evaluation in vivo. (a) Schematic illustration of the treatment regime. Briefly, the ICR mice were i.p. engrafted with RBCs infected with 1 × 10⁷ ART-resistant Plasmodium berghei (K173 strain) on day 1 and then received intravenous injection of various formulations: saline, free ART (standard dosage, 15 mg/kg), free low-dose ART (20% of standard dosage, 3 mg/kg), physical mixture of ART (20% of standard dosage, 3 mg/kg) and BSO (200 mg/kg), and ART+BSO-TRN-Chos (ART, 3 mg/kg; BSO, 200 mg/kg) on day 1, 2, 3 and 4. The parasitemia of mice was monitored every day until the mice died. (b) The percentage of parasitemia in mice received different treatments on day 5 (n = 7). (c) The parasitemia inhibitory rate of various treatments with the saline group as comparison. Data are presented as mean ± SD, with two-tailed unpaired Student's t-test. (d) Survival curves of mice received the indicated treatments. Data were analyzed using log-rank test (n = 7). Data are presented as mean ± SD, with two-tailed unpaired Student's t-test.


 DownLoad:


 下载:
下载:


