Received Date:
16 June 2023 Accepted Date:
03 August 2023 Revised Date:
28 July 2023 Available Online:
15 June 2024
Abstract:
Surface modification of microporous bone scaffolds using nanoparticles has been broadly studied in bone tissue engineering. Aiming at improving vascularized bone regeneration (VBR), zeolitic imidazolate framework-8 (ZIF-8) was encapsulated with dimethyloxallyl glycine (DMOG) and the drug-carrying nanoparticles (D@Z) could be uniformly coated onto the surface of the bone scaffold. The osteogenic and angiogenic actions of D@Z are closely correlated with the amount of slowly released DMOG, and in general, exhibited a favorable association. Then, the D7.5@Z group, which showed the greatest capacity to induce in vitro osteogenesis–angiogenesis coupling, was utilized for surface modification of the bone scaffold. Biological processes including phosphate-containing compound metabolic process, cell differentiation, cell proliferation and cell motility might contribute to enhanced ability to induce VBR by the coated scaffold and signaling pathways such as Rap1, Ras, phosphatidylinositol 3-kinase/protein kinase B (PI3K-AKT) and vascular endothelial growth factor (VEGF) signaling pathways participated in these processes. Finally, as depicted by in vitro real time-polymerase chain reaction (RT-PCR), Western blot (WB) and in vivo cranial bone defect model, the microporous scaffold coated with nano-D7.5@Z greatly promoted VBR. To conclude, nano-D@Z has significant promise for practical application in modification of microporous bone scaffolds to enhance VBR, and DMOG loading quantity has a beneficial influence on D@Z to improve osteogenesis–angiogenesis coupling.
Bone abnormalities of critical magnitude caused by trauma, tumors, congenital malformations, or other causes cannot be restored without intervention [1]. Composite bone transplants offer good yields and eliminate the requirement for a second surgical site [2]. In addition, 3 dimensional (3D)-printed composite bone grafts have a regular and controllable micron-scale porosity structure, including pore size, interconnectivity, orientation, and so on [1]. Consequently, they are frequently employed for bone restoration. However, the inert components of these materials, such as polycaprolactone (PCL), make it difficult for the materials themselves to induce bone growth. Surface modification is required to effectively increase the biocompatibility and osteogenic qualities of these composite bone transplants [3]. Numerous nanoparticles (NPs) have been successfully coated or grafted onto the surfaces of bone grafts for osteogenic purposes [4,5]; coating is extensively employed among all surface modification approaches due to its effectiveness and practicability [6].
Among these, zeolite imidazolate framework-8 (ZIF-8) is gaining increasing attention for its desirable features [7,8]. It possesses the qualities of both metal-organic frameworks and zeolite-like materials, such as large and high porosity, unsaturated metal sites, and better stability due to its zeolite-like structure [9,10]. Numerous studies have investigated the potential of ZIF-8 in bone tissue engineering [11–18]. Our lab has effectively included nano-ZIF-8 into the modification of biomaterials like bone-adhesive hydrogels [14] and titanium implants [11,16,19], obtaining significantly improved osteogenesis. Both in vivo and in vitro investigations have validated ZIF-8′s remarkable osteoinductive ability [11,14], which was explained by the discovery that ZIF-8 could enter cells via endocytosis and slowly breakdown to release Zn2+ with osteogenic activity inside and outside the cell [12]. Moreover, covering these implant materials with submicro-nano ZIF-8 particles contributes to the formation of a hierarchical micron-submicron-nano surface morphology [11,18]. The Zn2+ release and surface morphological alteration further triggered the mitogen-activated protein kinase (MAPK) and Wnt pathways, consequently dramatically boosting bone regeneration [12].
Bone formation involves a series of sequential stages such as hematoma formation, blood vessel ingrowth, callus formation, and bone remodeling [20–22]. The reconstruction of blood vessels plays a crucial role throughout the entirety of this process [20,23,24]. In addition to providing the necessary nutrition and biochemical environment, they participate directly in osteogenesis [25,26]. In addition, it has been established that bone formation-related cells are primarily derived from mesenchymal cells, perivascular cells, vascular endothelial cells, periosteum, and endosteal cells, immature cells, and bone marrow cells located outside the bone formation area [27,28], which are primarily transported into the area via the vasculature [29,30]. Improving local angiogenic activity can therefore not only improve the physiological environment for bone regeneration but also directly contribute to bone formation.
From this perspective, ZIF-8′s ability to induce bone formation could be improved by endowing it with enhanced angiogenic activity. Additionally, the characteristics of ZIF-8 provide some hints. As stated previously, ZIF-8 has been shown to have high porosity, large specific surface area, and unsaturated metal ion sites, making it an effective drug carrier [31–34]. Therefore, the present study aimed to encapsulate ZIF-8 with angiogenic drug molecules and further apply it to the modification of a 3D-printed bone scaffold for the purpose of enhancing its ability to induce bone formation.
Dimethyloxallyl glycine (DMOG) is a small molecule that can preserve hypoxia inducible factor-1α (HIF-1α) under normal oxygen pressure and thus can stimulate angiogenesis [35–38]. In bone tissue engineering, DMOG is frequently applied for promotion of microvessel formation around the material in order to provide a more favorable physiological environment for bone regeneration [39]. Peng and colleagues [40] treated ovaries-removed mice with DMOG for prevention of bone loss. They found that the drug played its role by activation of HIF-1α and Wnt/beta-catenin signaling pathways. However, attention should be paid to the potential side effects of burst-released DMOG [41], and a local delivery system is a common method for overcoming the potential side effects of burst-released drugs and expanding their application [42].
Thereafter, carrying DMOG with ZIF-8 might be able to promote angiogenesis of ZIF-8 and to avoid the possible adverse effect of burst-released DMOG. In a previous study, DMOG was successfully encapsulated into ZIF-8 and the drug-loading nanoparticles (D@Z NPs) significantly promoted angiogenesis–osteogenesis coupling [43]. Initially, how does DMOG loading amount affect the bioactivity of D@Z was determined in this study. The potential application of D@Z nanoparticles in bone tissue engineering was then investigated further. Briefly, a 3D-printed microporous bone scaffold was coated with D@Z nanoparticles, and its ability to promote vascularized bone regeneration (VBR) was comprehensively studied using a rabbit cranial defect model.
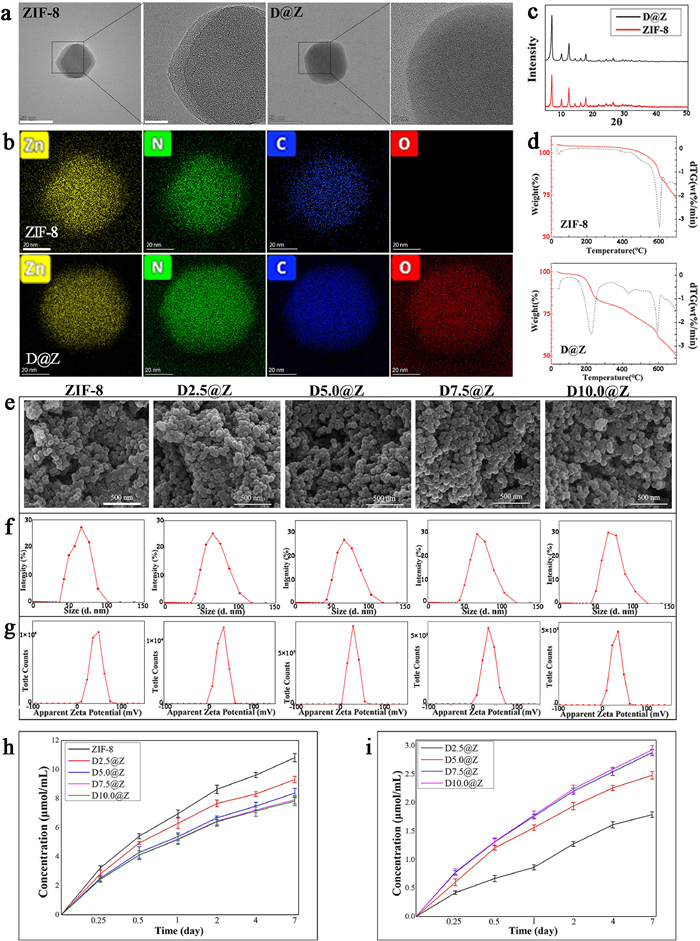
First, characterization of the drug-carrying NPs was conducted. The one-pot encapsulation of DMOG by ZIF-8 was confirmed to be successful. On the ZIF-8 crystal surface, pores were discernible, whereas they were indistinct on the D@Z crystal surface (Fig. 1a). The presence of oxygen in the D@Z crystal, as depicted in Fig. 1b, demonstrated the successful encapsulation of DMOG by ZIF-8. By comparing D@Z's powder X-ray diffraction (PXRD) pattern to that of ZIF-8, the purity and crystallinity of D@Z were validated (Fig. 1c). The thermal stability of D@Z was subsequently evaluated using thermo-gravimetric analysis (TGA). At approximately 400 ℃, ZIF-8 began to degrade, as depicted in Fig. 1d. In this temperature range, the disintegration of D@Z was comparable to that of pure ZIF-8, demonstrating ZIF-8 integrity of in the drug carrying system. D@Z also exhibited weight loss between 150 ℃ and 300 ℃ (Fig. 1d), which may be correlated with the decomposition of DMOG.
Figure 1
Figure 1.
(a) Crystal morphology and (b) elemental mapping of ZIF-8 and D@Z detected by TEM. Characterization of ZIF-8 and D@Z including (c) PXRD patterns and (d) TGA patterns. Characteristics of the D@Z NPs loaded with different content of DMOG including (e) crystal morphology, (f) crystal size, and (g) zeta potential. Biodegradation of the D@Z NPs loaded with different content of DMOG including (h) zinc ion release kinetics, and (i) DMOG release kinetics. Scale bar: 50 nm, 10 nm (a), 20 nm (b), 500 nm (e). Data expressed as mean ± standard deviation (SD), n = 3.
Effect of the DMOG loading amount on the D@Z characteristics was determined. As shown by the scanning electron microscope (SEM) images in Fig. 1e and the dynamic light scattering (DLS) results in Fig. 1f, the crystal morphology and crystal size of each group were identical. Zeta potential decreased from 30.2 mV to 26.7 mV as DMOG concentration rose from 2.5 mg to 10.0 mg (Fig. 1g). The zinc ion and DMOG release kinetics in Fig. 1 confirmed that the loading efficiencies of the four groups may differ, as indicated by the zeta potential results. Inductively coupled plasma-atomic emission spectrometer (ICP-AES) detected the release of zinc ions to demonstrate the D@Z NPs degradation (Fig. 1h). The release pattern indicates that a fast release happened within the first 12 h. After that, the speed of release slowed down gradually and reached equilibrium on the seventh day. During this time period, the Zn2+ concentration in each group (ZIF-8, D2.5@Z, D5.0@Z, D7.5@Z, and D10.0@Z) was approximately 10.82 ± 0.28, 9.31 ± 0.22, 8.38 ± 0.32, 7.92 ± 0.28, and 7.82 ± 0.31 µmol/mL, respectively. Then, the pattern for drug release determined by ultraviolet-visible spectrophotometer in Fig. 1i displayed a similar pattern to that of zinc ion release, demonstrating that drug release largely depends on ZIF-8 decomposition. In addition, the DMOG concentration released at each time point increased as the amount of DMOG added during synthesis increased from 2.5 mg to 7.5 mg, and the DMOG concentration released on day 7 was 1.79 ± 0.05, 2.48 ± 0.07, and 2.88 ± 0.06 µmol/mL for D2.5@Z, D5.0@Z, and D7.5@Z, respectively. However, when we increased the addition of DMOG to 10 mg, the concentration of released DMOG remained nearly unchanged (2.92 ± 0.07 µmol/mL), indicating that the drug loading efficiency of ZIF-8 has reached its maximum with this method. Due to the comparable drug loading efficiency of the D10.0@Z and the D7.5@Z, the D10.0@Z group was omitted from subsequent in vitro studies. In addition, the loading efficiency was calculated using the formula (loading efficiency = weight of drug in the NPs/weight of the NPs administered × 100%). The drug loading efficiencies for D2.5@Z, D5.0@Z, D7.5@Z, and D10.0@Z were 12.9%, 18.5%, 21.9%, and 22.4%, respectively.
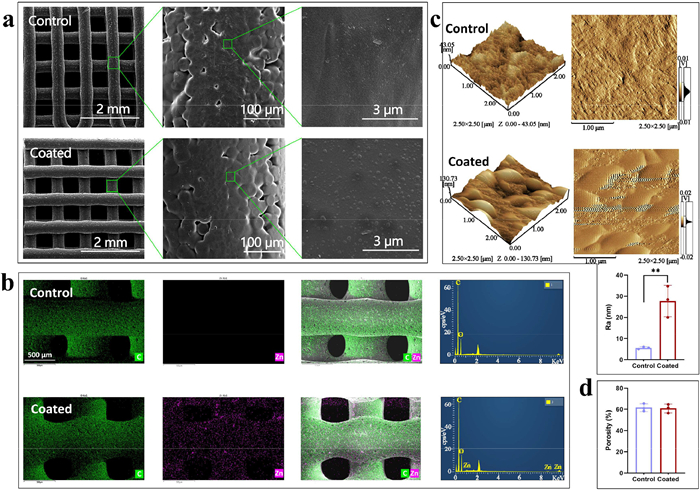
The obtained D@Z was then utilized to coat microporous PCL scaffold. The SEM image in Fig. 2a demonstrated that the scaffold was microporous and that the scaffold fibers were uniformly distributed. In addition, there were micron-scale wrinkles on the fiber surface, which was consistent with the results reported in the literature [44]. Further observation under high magnification revealed that the control group's surface was relatively smooth, whereas the coated group's surface was characterized by nano morphology. The energy dispersive spectroscopy (EDS) mapping in Fig. 2b indicated that the drug-loading NPs were uniformly distributed on the surface of PCL scaffold. Using atomic force microscope (AFM), the microscopic structure and roughness of the surface were detected. As depicted in Fig. 2c, the coated scaffolds showed significantly higher surface roughness. Then, Fig. 2d showed similar porosity in the two groups.
Figure 2
Figure 2.
Characterization of the 3D printed scaffold including (a) SEM images, (b) EDS mapping of Zn, (c) AFM images and surface roughness, and (d) porosity. Data expressed as mean ± SD, n = 3. ** P < 0.01.
To study the effect of D@Z coating on PCL bone scaffold, bone marrow stem cells (BMSCs) and human umbilical vein endothelial cells (HUVECs) were incubated with either coated or uncoated (control) scaffolds. After two days of incubation, RNA extraction and transcriptome sequencing analysis were performed.
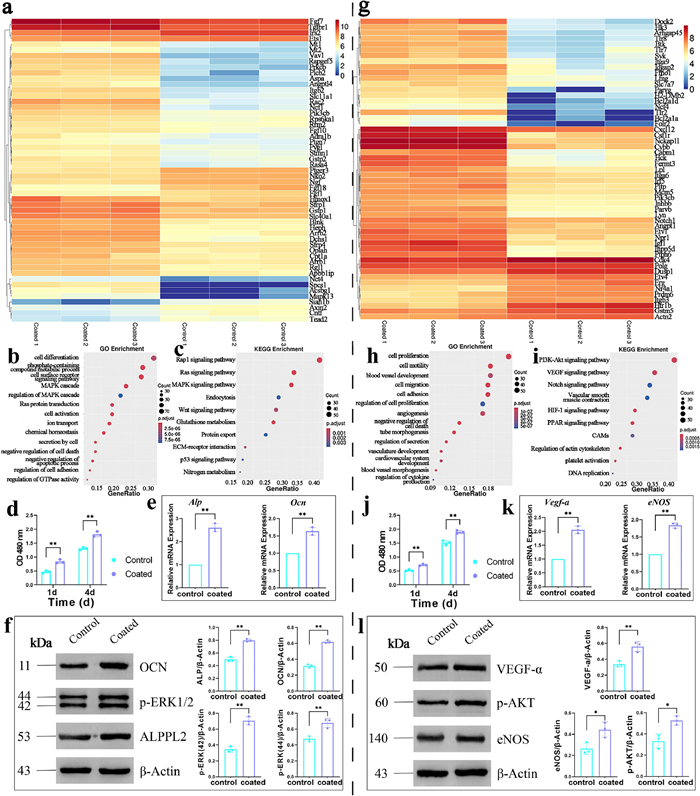
For BMSCs, 325 differentially expressed genes (DEGs), including 265 upregulated and 60 downregulated genes, were identified within the two groups (Fig. 3a). The gene ontology (GO) enrichment of these genes was conducted (Fig. 3b) and the top enriched GO terms involved cell differentiation, phosphate-containing compound metabolic process, cell surface receptor signaling pathway, MAPK cascade and so on. The functionally related Kyoto Encyclopedia of Genes and Genomes (KEGG) enrichment depicted that signaling pathways including Rap1, Ras, MAPK and Wnt were potentially related to the promoted osteogenesis of the scaffold, and the D@Z might play the role by endocytosis (Fig. 3c) [45]. The in vitro cell proliferation and osteogenesis promotion were further verified with cell counting kit-8 (CCK-8), real time-polymerase chain reaction (RT-PCR) and Western blot (WB). Results in Fig. 3d displayed that BMSCs were easier to proliferate on the coated scaffolds as determined with CCK-8 assay. Moreover, the coated scaffolds also showed higher osteogenic activities than bare scaffolds, as indicated by related gene expression and protein secretion (Figs. 3e and f).
Figure 3
Figure 3.In vitro osteogenesis evaluation of 3D printed scaffolds. (a) Heat map displaying the fold change of DEGs; scatter map of the (b) GO enrichment, and (c) KEGG enrichment. (d) Cell proliferation examined with a CCK-8 assay after culturing for 1 and 4 days. (e) Osteogenesis-related gene expression including Alp (7 d) and Ocn (14 d) determined with PCR. (f) WB analysis of protein secretion of p-ERK1/2 (7 d), ALP (7 d) and OCN (14 d). In vitro angiogenesis evaluation of 3D printed scaffolds. (g) Heat map displaying the fold change of DEGs; scatter map of the (h) GO enrichment, and (i) KEGG enrichment. (j) Cell proliferation examined with a CCK-8 assay after culturing for 1 and 4 days. (k) Angiogenesis-related gene expression including Vegf-a (3 d) and eNOS (3 d) determined with PCR. (l) WB analysis of protein secretion of p-AKT (3 d), VEGF-a (3 d) and eNOS (3 d). P < 0.05, ** P < 0.01. Data expressed as mean ± SD, n = 3.
For HUVECs, 569 DEGs, involving 395 upregulated and 174 downregulated genes, were identified within the two groups (Fig. 3g). The GO enrichment of these genes was conducted (Fig. 3h), and the top enriched GO terms involved cell proliferation, cell motility, blood vessel development, cell migration, cell adhesion and so on. The functionally related KEGG enrichment depicted that signaling pathways including phosphatidylinositol 3-kinase/protein kinase B (PI3K-AKT), vascular endothelial growth factor (VEGF), Notch and HIF-1 were potentially related to the promoted osteogenesis of the scaffold (Fig. 3i) [46]. The in vitro cell proliferation and osteogenesis promotion were further verified with CCK-8, RT-PCR and WB. Results in Fig. 3j displayed that HUVECs were easier to proliferate on the coated scaffolds as determined with CCK-8 assay. Moreover, the coated scaffolds also showed higher osteogenic activities than bare scaffolds, as indicated by related gene expression and protein secretion (Figs. 3k and l).
In addition to the chemical components of D@Z as discussed above, coating these PCL bone scaffolds with nano MOG@Z particles contributed to the formation of a hierarchical micron-nano surface morphology and the increasing of surface roughness, as depicted in Fig. 2. According to previous research, nanoscale structure alone can stimulate osteoblast proliferation. Moreover, when nanoscale structure is combined with micro- or submicro-scale morphology, osteogenesis- and angiogenesis-related cell differentiation and local factor production could be stimulated [47,48]. The effect was further strengthened by the increased surface roughness of the coated scaffolds [49].
Operations related to animals have been approved by the Ethics Committee of West China School of Stomatology, Sichuan University. In vivo safety of the scaffolds, including in vivo histopathology of major organs (heart, spleen, liver, lung and kidney), blood biochemistry indexes and hematological examination, were investigated. Fig. S3a (Supporting information) displayed images and hematoxylin-eosin (H&E)-stained images of major organs and found no obvious damage in both groups 4 weeks after implantation surgery. Blood biochemistry and hematological examination of the three groups detected no significant abnormality (Figs. S3b and c in Supporting information). All these results proved that the scaffolds were highly biocompatible.
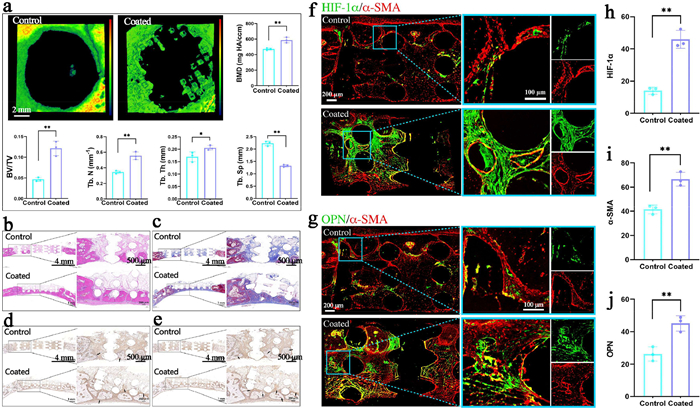
The effect of D@Z NPs on the ability of PCL scaffold to induce in vivo VBR was explored with a cranial defect model in rabbit. The micro-computed tomography (micro-CT) reconstructive images in Fig. 4a depicted that bone reconstruction in the coated group was more effective than that in the control group. Then, parameters including bone mineral density (BMD), bone volume/tissue volume (BV/TV), trabecular thickness (Tb.Th) and trabecular number (Tb.N), in the coated group were much higher than those in the control group, whereas the trabecular separation (Tb.Sp) in the two groups showed an opposite trend. Then, the push out test was utilized to assess the bone-implant integrate strength. The results in Fig. S4 (Supporting information) showed that the coated group showed significantly higher push-out force than the control group, indicating better osseointegration of microporous scaffold with the bone tissue in the coated group.
Figure 4
Figure 4.
Bone formation detected with (a) Micro-CT reconstructive images of cranial defect model and corresponding quantitative analysis including BMD, BV/TV, Tb. Th, Tb.N, and Tb.Sp. Tissues around bone block stained with (b) H&E, (c) Masson trichrome, (d) ALP, and (e) VEGF-a. Immunofluorescence staining with (f) α-SMA and HIF-1α, (g) α-SMA and OPN. Quantitative results including (h) HIF-1α, (i) α-SMA, and (j) OPN. Data expressed as mean ± SD, n = 3. * P < 0.05, ** P < 0.01.
In the Masson trichrome and H&E-stained sections, the PCL artificial bone block cannot be stained and the scaffold can be observed. In both groups, as shown in Figs. 4b and c, there was an abundance of collagen deposition. However, the majority of collagen in the uncoated group was not mineralized, and only a small amount of new bone was formed, as demonstrated by the H&E stain. In the coated group, however, a substantial amount of newly formed bone was observed. In addition, it was discovered that the newly formed bone was predominantly formed close to the meninges. After implantation of the bone block, the defect has not been covered with a membrane. Therefore, bone tissue was unable to form because the upper layer was occupied by ingrown soft tissues [50]. In the future, we would like to consider covering the artificial bone block with a guided tissue regeneration membrane to prevent soft tissue from interfering.
Immunostaining revealed positive secretion of vascular endothelial growth factor-a (VEGF-a) and alkaline phosphatase (ALP) around and within the newly formed bone in both groups (Figs. 4d and e). In addition, the coated group stained more strongly for VEGF-a and ALP molecules, indicating enhanced angiogenesis and osteogenesis, which resulted in significantly more newly formed bone as indicated by the H&E and Masson stains. The increased signaling of α-smooth muscle actin (α-SMA) and HIF-1α by immunofluorescence staining, as shown in Fig. 4f, indicated that the D@Z coating significantly promoted blood vessel formation. The results of osteopontin (OPN) staining suggest that the D@Z coating also promoted bone regeneration at the surgical site (Fig. 4g). The mean gray value-based quantitative results confirmed the results (Figs. 4h–j).
In summary, we successfully synthesized nano-D@Z and modified 3D-printed bone scaffolds with it. The encapsulation of DMOG significantly promoted in vitro osteogenesis–angiogenesis coupling. By controlling the DMOG loading efficiency, we discovered that the osteogenic and angiogenic activities of nano-D@Z are closely related to DMOG loading and generally exhibit a positive correlation. Using the D7.5@Z for surface coating of PCL bone scaffold, the drug carrying NPs were uniformly coated onto the scaffold and significantly promoted the angiogenesis-osteogenesis coupling according to biological processes including phosphate-containing compound metabolic process, cell differentiation, cell proliferation, cell motility and so on. Finally, the excellent ability of the D@Z coating to promote in vivo VBR was verified using a model of cranial bone defect. In conclusion, nano-D@Z proved to be a drug loading system with promising applications for bone scaffold surface modification in bone tissue engineering to promote VBR.
Declaration of competing interest
The authors declare that they have no known competing financial interests or personal relationships that could have appeared to influence the work reported in this paper.
Acknowledgments
This work was supported by the National Natural Science Foundation of China (Nos. 82201128, 82271034), Special Funding for Post-doctoral Research Projects in Sichuan Province (No. TB2022045), Sichuan Province Science and Technology Plan Projects (No. 23NSFSC1723), China Postdoctoral Science Foundation (No. 2022M722250) and Research and Development Program (West China Hospital of Stomatology Sichuan University) (Nos. RD-02–2022012, RD-03–202107).
Supplementary materials
Supplementary material associated with this article can be found, in the online version, at doi:10.1016/j.cclet.2023.108889.
[1]
H. Ma, J. Chang, C. Feng, C. Wu, Acta Biomater. 79 (2018) 37–59. doi: 10.1117/12.2507580
[2]
G.J. Dias, P. Mahoney, N.A. Hung, et al., J Biomed. Mater. Res. B 105 (2017) 2034–2044. doi: 10.1002/jbm.b.33735
Figure 1
(a) Crystal morphology and (b) elemental mapping of ZIF-8 and D@Z detected by TEM. Characterization of ZIF-8 and D@Z including (c) PXRD patterns and (d) TGA patterns. Characteristics of the D@Z NPs loaded with different content of DMOG including (e) crystal morphology, (f) crystal size, and (g) zeta potential. Biodegradation of the D@Z NPs loaded with different content of DMOG including (h) zinc ion release kinetics, and (i) DMOG release kinetics. Scale bar: 50 nm, 10 nm (a), 20 nm (b), 500 nm (e). Data expressed as mean ± standard deviation (SD), n = 3.
Figure 2
Characterization of the 3D printed scaffold including (a) SEM images, (b) EDS mapping of Zn, (c) AFM images and surface roughness, and (d) porosity. Data expressed as mean ± SD, n = 3. ** P < 0.01.
Figure 3In vitro osteogenesis evaluation of 3D printed scaffolds. (a) Heat map displaying the fold change of DEGs; scatter map of the (b) GO enrichment, and (c) KEGG enrichment. (d) Cell proliferation examined with a CCK-8 assay after culturing for 1 and 4 days. (e) Osteogenesis-related gene expression including Alp (7 d) and Ocn (14 d) determined with PCR. (f) WB analysis of protein secretion of p-ERK1/2 (7 d), ALP (7 d) and OCN (14 d). In vitro angiogenesis evaluation of 3D printed scaffolds. (g) Heat map displaying the fold change of DEGs; scatter map of the (h) GO enrichment, and (i) KEGG enrichment. (j) Cell proliferation examined with a CCK-8 assay after culturing for 1 and 4 days. (k) Angiogenesis-related gene expression including Vegf-a (3 d) and eNOS (3 d) determined with PCR. (l) WB analysis of protein secretion of p-AKT (3 d), VEGF-a (3 d) and eNOS (3 d). P < 0.05, ** P < 0.01. Data expressed as mean ± SD, n = 3.
Figure 4
Bone formation detected with (a) Micro-CT reconstructive images of cranial defect model and corresponding quantitative analysis including BMD, BV/TV, Tb. Th, Tb.N, and Tb.Sp. Tissues around bone block stained with (b) H&E, (c) Masson trichrome, (d) ALP, and (e) VEGF-a. Immunofluorescence staining with (f) α-SMA and HIF-1α, (g) α-SMA and OPN. Quantitative results including (h) HIF-1α, (i) α-SMA, and (j) OPN. Data expressed as mean ± SD, n = 3. * P < 0.05, ** P < 0.01.

 DownLoad:

 下载:
下载:


