
Figure 1.
Schematic diagram of the microfluidic device for screening and controlling the crystal habit and solid form of Ph3COH.
Controlling solid form and crystal habit of triphenylmethanol by antisolvent crystallization in a microfluidic device
Jun Lu , Jinrui Yan , Yaohao Guo , Junjie Qiu , Shuangliang Zhao , Bo Bao

Crystallization plays an important role in medicine, food, inorganic salts, agriculture, and material fields as an eco-friendly technology for separating, refining, and purifying substances [1]. Organic compounds can exist in a variety of solid forms, such as polymorph, amorphous, solvate, and hydrate. The difference in crystal form causes the differences in hygroscopicity [2], melting point [3], dissolving rate, stability, fluidity, and other physical and chemical properties [4,5] of products obtained. Crystallization conditions such as supersaturation [6], solvent, temperature [7], pH [8], and additives [9] affect the polymorphism. Furthermore, the crystal habit refers to the external macroscopic morphology of the crystal [10,11]. Good crystal habits not only enhance the purity, density, mechanical strength, particle fluidity, polymerization characteristics, and mixing properties [12,13] but also improve the efficiency of products in transportation, grinding, washing, drying, packaging, and storage [14,15]. Chemical factors including solvents and additives, as well as process factors such as supersaturation, temperature, and stirring, exert a pronounced influence on the crystal habit [16,17]. The key to optimizing crystal habit is to first determine the crystal form of substances [18,19]. Controlling the formation of target crystal form and crystal habit products is a significant issue in industrial production [20,21].
Triphenylmethanol (Ph3COH), is a crucial pharmaceutical and organic synthesis intermediate that is used to synthesize triphenylmethyl chloride [22], trityl ether [23], etc. Weber et al. [24] found that Ph3COH is used as a host molecule to embed methanol (MeOH) and dimethyl sulfoxide (DMSO) with high selectivity, forming Ph3COH·MeOH and 2Ph3COH·DMSO, respectively. The special inclusion properties of Ph3COH are suitable for the concentration, separation, and purification of MeOH and DMSO from industrial and environmental solutions and vapors. Eckardt et al. [25] reported the crystal structure of inclusion complexes of Ph3COH with solvent molecules such as acetone, DMSO, N, N-dimethylformamide (DMF), and MeOH. Consequently, Ph3COH is prone to polymorphic problems due to its strong encapsulation of solvent molecules when it crystallized from solutions. Current works focused more on the study of the inclusion behavior of Ph3COH with solvent molecules. The crystallographic parameters of Ph3COH have not been thoroughly and fully studied. Since considering that temperature may affect the binding of solvent molecules with Ph3COH, we used antisolvent crystallization to further investigated crystallographic parameters of Ph3COH and affecting factors. At present, Ph3COH can be widely used as an important chemical raw material, but its various solvates have not been reported for valuable applications. Therefore, DMSO and DMF were chosen as the main solvent and water (H2O) as the antisolvent in this work.
Existing antisolvent crystallization technologies mostly rely on external mechanical agitation devices to mix solutions. The inadequate agitation results in a steep concentration gradient or practically discontinuous variation in concentration that is apparent around the interface [26]. Moreover, poor control in the mixing of reagents often leads to dispersed crystal size distributions and impure crystal forms, resulting in low product utilization. Changes in local conditions in a kettle crystallizer affect the entire crystallization process. Variations in conditions further complicate the collection of basic research and crystallization kinetics data [27]. Therefore, the poor environmental consistency and the consumption of both time and samples restrict the application of existing methods in the screening crystallization conditions and high-precision verification in the study of crystal properties [28]. Consequently, it is urgent and crucial to developing a crystallization technique applied in rapid screening crystallization conditions, obtaining highly reproducible products, and controlling the preparation of target crystal forms and crystal habits.
Microfluidics is a multidisciplinary science based on the manipulation of fluids at the submillimeter scale, which is widely used in many fields such as polymer synthesis, fine chemical processing, biomedicine [29-31], and flow mass transfer mechanism research [32,33]. It significantly increases the efficiency of heat mass transfer due to a reduction in linear scale compared with macro-scale fluids, which in turn greatly reduces the residence time required to achieve the given goal [29-34]. Microfluidics enables solution mixing through molecular diffusion without the need for an external mechanical stirring device [35]. The flow field is laminar flow rather than turbulent flow [36]. Consequently, the promising technique has been demonstrated in the crystallization of proteins [37,38], drugs [39,40], and nanocrystals [41-43]. Bhamidi et al. [44] investigated the glycine polymorph selectivity using slow diffusion at the laminar flow interface. This technique allowed for examining polymorph selectivity before the metastable crystal transition. Shi et al. [28] used hexanitrohexaazaisowurtzitane (HNIW, also known as CL-20) as the research object and proposed a microfluidic strategy to study the crystal morphology of explosives by combining morphological prediction with microfluidic experiments, which showed the feasibility of an efficient and accurate strategy for controlling explosive crystal morphology based on a microfluidic platform. Microchannel-restricted crystallization provides unprecedented control of crystallization conditions at the microscale compared with current screening methods, improving control of properties such as crystal morphology, particle size, and polymorphism while decreasing chemical consumption and scrap [45,46]. The advantages of the antisolvent crystallization process in the microchannels include improving treatment accuracy, saving cost [47], low energy consumption, good reproducibility, ease of control, and safe [48-50].
In this study, we developed a microfluidic method to investigate the antisolvent crystallization process of Ph3COH as a by-product of AZT. The novel method separates the primary solution mixing from the crystal formation (nucleation and growth) by introducing the microfluidic device. We established the efficient approach to screen and control solid forms and crystal habits of Ph3COH by regulating the initial concentration (C0) of Ph3COH, antisolvent flow rate (Q), and solvent ratio. This paper aims to use the advantages of microfluidic technology, which can realize fine gradient screening, to analyze the reasons for the highly selective binding of Ph3COH with DMSO and explore the factors affecting the formation of the solvate. This work successfully identified and analyzed the transformation process of crystal habit and crystal form through a series of small-gradient experiments. The microfluidic technique offers fresh perspectives on the preparation of specific crystal forms and crystal habits.
To reduce the risk of clogging within the microchannels, the microfluidic device developed in this work used a microchip to achieve rapid and homogeneous mixing of the solution, while the nucleation and growth process of the crystals took place in the beaker outside the microfluidic device. We used a glass microchip with a T-shaped mixed structure as a crystallizer, and the micro-mixing channel was designed as a short and straight structure. The width and depth of the microchannel were 800 µm and 200 µm, respectively, and the length of the hybrid channel was 7.6 mm. By controlling the residence time, the mixture solution was discharged from the microchannel without nucleation or obvious crystals, it was possible to separate the primary mixing process of the solution from the crystal formation process (nucleation and growth). As shown in Fig. 1, the microchip was loaded into a polytetrafluoroethylene (PTFE) jig, covered with a glass plate, and finally packaged with a metal cover plate to ensure the sealing and safety of the whole device. The syringe pumps (Harvard pump, 33DDS) simultaneously injected the solution containing Ph3COH and the antisolvent into the microchip. A PTFE tube with an outside diameter of 1/16 inch connected the jig to the syringe. The window opened by the metal cover plate can be used to in-situ monitor the liquid flow in the microchannel by optical microscope to assist in screening the velocity conditions Moreover, we fixed the mixing time of fluids in microchips at 40 min under each group of crystallization conditions.
The preparation, initial concentration determination method, and solubility determination results of Ph3COH were provided in the supplementary materials. Furthermore, the diffraction patterns of product crystals were recorded using an X-ray polycrystalline diffractometer (PXRD, D8 Advance). The thermal behaviors of products were analyzed by simultaneous thermogravimetry and differential scanning calorimetry (TG-DSC, Mettler TGA/DSC1). The molecular structure of the product was characterized by Fourier infrared spectroscopy (FTIR, Nicolet 6700). The crystal morphology is observed by a polarizing light microscope (PLM, Nikon ECLIPSE Ni-U) and scanning electron microscope (SEM, Nova Nano SEM 450).
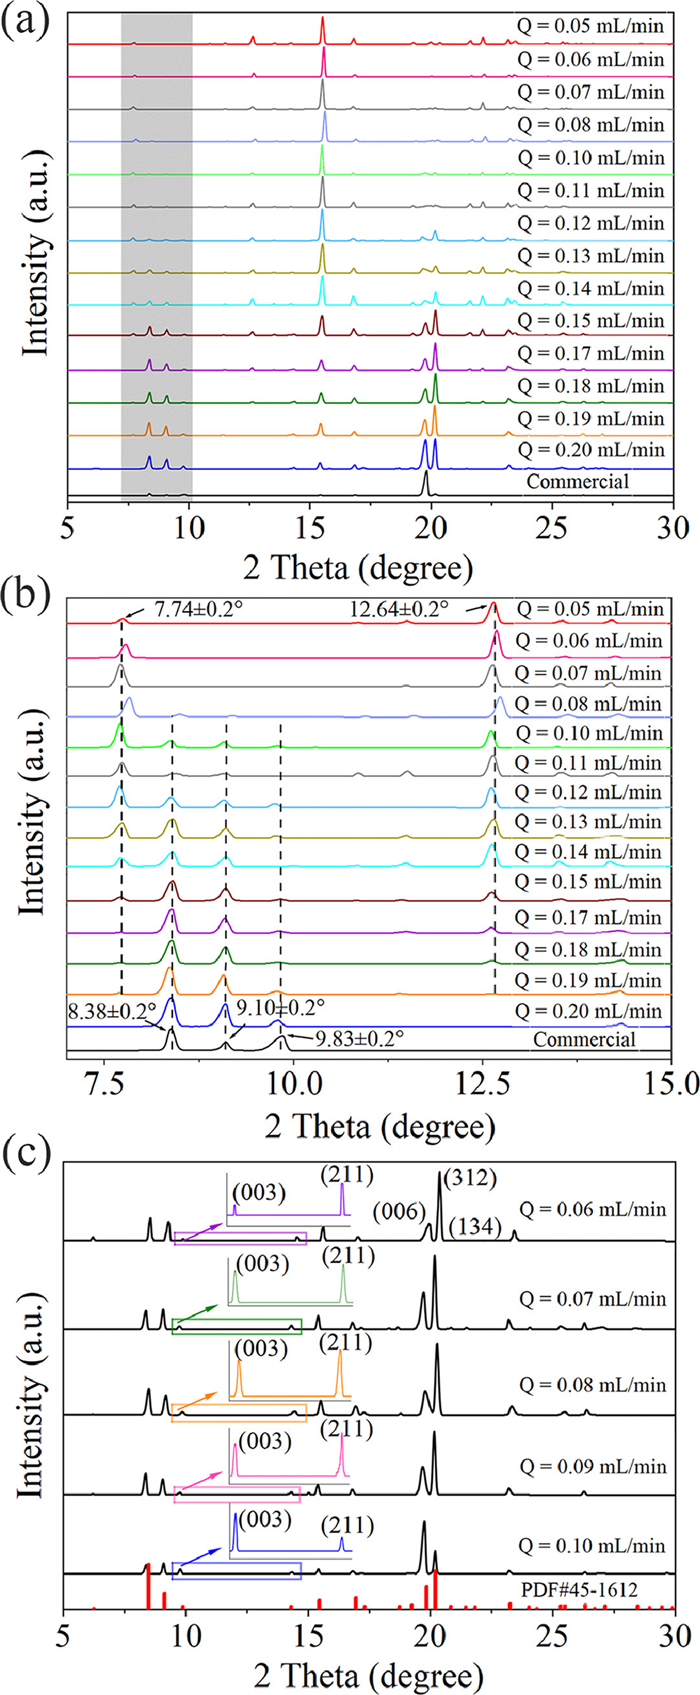
First, when the flow rate of the Ph3COH solution was fixed at 0.1 mL/min, we investigated the effect of antisolvent flow rate on the solid form in DMSO—H2O (C0 = 4.2702 mg/mL) and DMF-H2O (C0 = 12.5200 mg/mL) systems at different initial concentrations (C0). The PXRD characterization patterns shown in Figs. 2a and b confirm that we obtained two solid forms of Ph3COH in the DMSO—H2O system using the microfluidic technique. The 2θ values of the primary characteristic peaks of the crystals obtained in the antisolvent flow rate range of 0.05–0.07 mL/min are located at 7.74° ± 0.2°, 10.81° ± 0.2°, 11.48° ± 0.2° and 12.64° ± 0.2°. We demonstrated the existence of the DMSO molecule in the unit cell structure of the new solid form obtained in the DMSO—H2O by Raman spectrum (Fig. S15 in Supporting information). Therefore, DMSO solvate was obtained in this range of antisolvent flow rate. The TG-DSC curve (Fig. S2a in Supporting information) indicates the presence of desolvation-induced weight loss steps and heat absorption peaks during the heating process of DMSO solvate (2Ph3COH·DMSO). However, the diffraction peaks of the crystals obtained at the antisolvent flow rate of 0.2 mL/min are consistent with the commercially available Ph3COH, with characteristic 2θ values located at 8.38° ± 0.2°, 9.10° ± 0.2°, and 9.83° ± 0.2°, which we named here as form β. The crystals obtained in the antisolvent flow rate range of 0.08–0.19 mL/min are mixtures of these two crystal forms. Moreover, the products obtained under different crystallization conditions were β-form in the DMF-H2O system (Fig. 2c). The TG-DSC characterization results (Figs. S2c, e, and f in Supporting information) proved that the form β obtained in different systems is pure Ph3COH. Since different solid forms have different stability and solubility (Fig. S6 in Supporting information), the crystal form with high solubility (metastable crystal form) tends to transform to the crystal form with low solubility (stable crystal form) in the crystallization process of Ph3COH polymorph system, thus the phenomenon of solvent-mediated phase transition occurs.
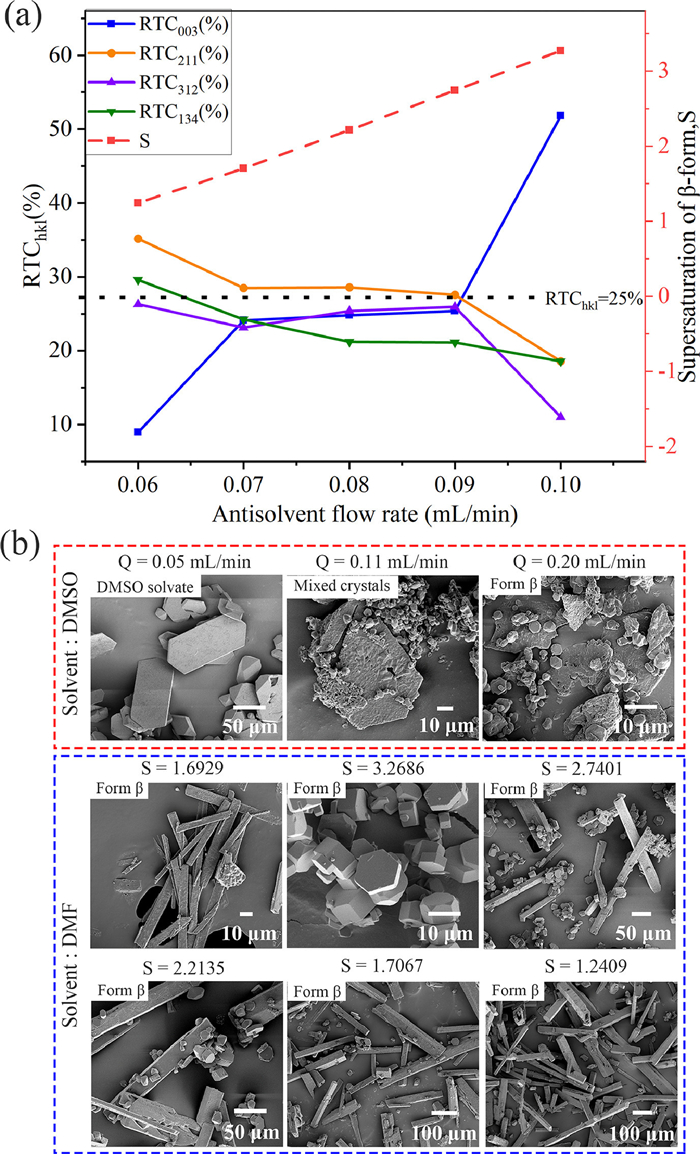
The difference in morphology (Fig. 3b) of different solid forms also provides a method for distinguishing DMSO solvate and form β. In the DMSO—H2O system, we obtained DMSO solvate crystals with hexagonal flakes and blocks in the morphology, while the form β grew as short hexagonal prism crystals with severe agglomeration. In the DMF-H2O system, we obtained long needle-like and short hexagonal prism β-form crystals in the supersaturation (S) environment of 1.6929 (C0 = 6.4844 mg/mL) and 3.2686 (C0 = 12.5200 mg/mL), respectively, under the condition that both the antisolvent and the solution flow rate were fixed to 0.1 mL/min. To understand the growth mechanism of Ph3COH in this system, when the initial concentration of Ph3COH was 12.5200 mg/mL, we introduced the relative texture coefficient (RTC) to analyze the effect of antisolvent flow rate on the crystal morphology of Ph3COH. The RTC of the crystal face is used to quantitatively analyze the preferred orientation level based on the results of the PXRD data. RTChkl is estimated using Eq. 1 [51], [52]:
|
|
(1) |
where I(hkl) and I0(hkl) are the diffraction intensities of the (hkl) planes measured in the diffractogram for the product and the standard Ph3COH powder sample (JCPDS No. 45–1612), respectively. The principle of selecting crystal faces for quantitative analysis of the morphology of β-form crystals is based on the RTC of crystal faces, detailed analysis steps are provided in supplementary materials. We selected the (003), (211), (312) and (134) crystal face for analysis. If RTChkl is greater than the average value of 25%, it means that the preferred crystal face is the one. The larger the RTChkl, the higher the degree of preferred orientation of the corresponding crystal face (n = 4).
Fig. 3a demonstrates that the supersaturation of the DMF-H2O system increases with the increase of the antisolvent flow rate in the range of 0.06–0.1 mL/min. SEM micrographs (Fig. 3b) in the DMF-H2O system and the calculation results of the RTC (Fig. 3a) show that when the supersaturation is 3.2686, the crystal grows into the short hexagonal prism crystals with the preferred crystal face of (003), which is shown as I(003) > I(211) in the PXRD pattern (Fig. 2c). When the supersaturation is 1.2409 and 1.6929, the crystals obtained are long needle-like crystal habit with the preferred crystal face of (211), and I(003) < I(211). Therefore, it is inferred that the supersaturation range generated by long needle-like crystals is 1.2409–1.6929. However, in the supersaturation range of 1.7067–2.2135, the RTCs of each crystal face are about 25%, I(003) ≈ I211), which is caused by the mixing of the two kinds of crystal habits. Moreover, the decrease in the antisolvent flow rate causes the reduction in short hexagonal prism crystals and the increase in long needle-like crystals based on the SEM micrographs. The difference in the effect of supersaturation on the growth rate of each crystal surface plays a decisive role in the crystal morphology. Therefore, the decrease in supersaturation results in a significant difference in the growth rate of each crystal face, which tends to grow into long needle-like crystals. However, short hexagonal prism crystals arise as a result of a reduction in the disparity between the growth rates of each crystal face due to the crystallization driving force increase. We found that supersaturation in the DMF-H2O system affects crystal habits by influencing the growth of (003) and (211) crystal faces. The microfluidic method developed in this study can achieve controllable conversion of these two crystal habits. We only obtained short hexagonal prism crystals with the (003) crystal face as the preferred crystal face in different supersaturation environments (Fig. S17 in Supporting information).
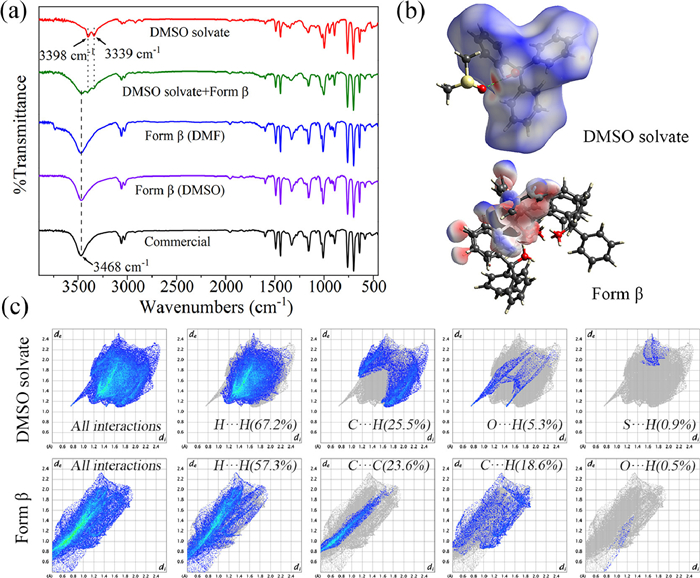
We studied the molecular structure and chemical bonds of two solid forms by FTIR spectrum (Fig. 4a). The obvious difference is that the O—H absorption peak of form β is the single peak at 3468 cm−1, while the O—H absorption peaks of DMSO solvate are the double peak at 3398 cm−1 and 3339 cm−1. The mixed crystals exhibit both the O—H absorption peaks of the two crystal forms. To understand the origin of differences in the FTIR spectrum for different crystal forms, we quantified intermolecular interactions in crystal forms using CrystalExplorer21.5 software. The dark red spots represent the locations of hydrogen bonds forming in the Hirshfeld surface of DMSO solvate (Fig. 4b). The difference in the profiles of the two solid forms is due to the difference in the type and proportion of intermolecular forces (Fig. S13 in Supporting information). The 2D fingerprint plots shown in Fig. 4c reflect the proportion of primary interactions. O—H interactions in DMSO solvate are considerably larger than that in form β. The main reason is that the S=O of DMSO in DMSO solvate crystal cell forms a new hydrogen bond with the Ph3COH. This effect affects the distribution of the electron cloud and the chemical environment, which will cause the original O—H bond absorption peak of Ph3COH in the FTIR spectrum to split and move to the low wavenumber.
To further investigate the factors affecting the different solid forms of Ph3COH, we first drew a mass fraction calibration curve using the relationship between the PXRD characteristic peak area and the content of form β. The quantitative analysis of form β in the mixed crystal forms is carried out according to the fitting equation y = 0.01041x − 0.01373 (Fig. 5a). The analysis method was provided by the supplementary materials. Therefore, the effects of the initial concentration of Ph3COH and the antisolvent flow rate on the form β content can be quantified in the DMSO—H2O system using the mass fraction calibration curve for the content analysis of β-form when the flow rate of Ph3COH solution was fixed at 0.1 mL/min. The results shown in Fig. 5b indicate that the form β content increases with the increase in both the antisolvent flow rate and the initial concentration of Ph3COH. In addition, we can obtain the supersaturation of form β in the antisolvent flow rate range of 0.1–0.2 mL/min, which increases with the increase of the antisolvent flow rate and the initial concentration of Ph3COH (Fig. 5c). Based on the analysis of the experimental results in the range of 0.1–0.2 mL/min, it is known that under the same initial concentration or the same antisolvent flow rate, the increase of supersaturation promotes the nucleation of β-form crystals, thus inhibiting the combination of Ph3COH and DMSO molecules, and further increasing the form β content.
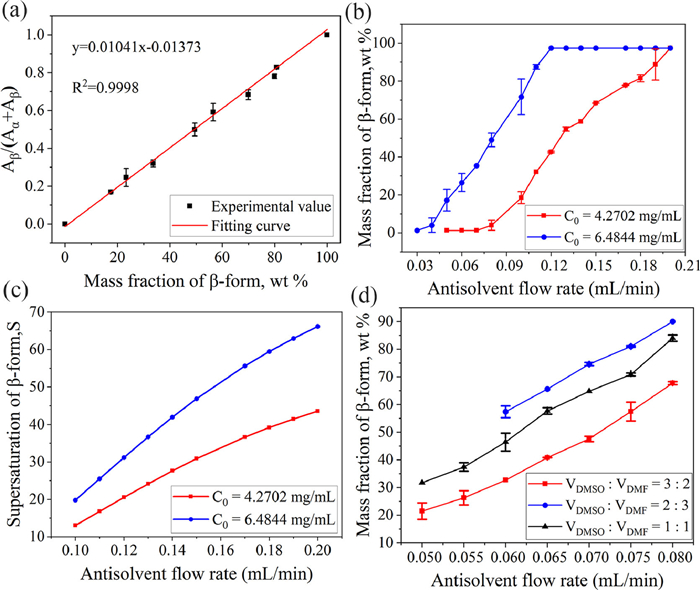
In addition, we explored the effects of solvent composition and antisolvent flow rate on the microcrystalline parameters of Ph3COH in binary solvent systems with different volume ratios of DMSO and DMF under the condition that the total volume of the main solvent was fixed at 30 mL and the initial concentration was 6.4844 mg/mL. The PXRD diffraction patterns shown in Fig. S8 (Supporting information) exhibit that the crystals obtained under the binary solvent system are all mixtures of DMSO solvate and form β. The increase in both the proportion of DMF and the antisolvent flow rate results in an increase in the form β content (Fig. 5d). However, the form β content is higher than what is obtained in DMSO—H2O under the same reactants mass and flow rate. Although the solubility measurement results (details see Supporting information) show that the addition of DMF will increase the solubility of Ph3COH and then reduce the supersaturation of the solution, the decrease in the proportion of DMSO molecules in the main solvent is also not conducive to the formation of DMSO solvate. Therefore, although the above change of the main solvent system reduces the yield of both crystal forms, the decrease in DMSO molecular content has a more significant inhibitory effect on the formation of crystal DMSO solvate than the decrease in the precipitation of crystal form β due to the decrease in supersaturation. Therefore, the decrease in the proportion of DMSO in the solvent is more unfavorable to the formation of DMSO solvate, which leads to an increase in the mass fraction of form β.
Furthermore, we found that the crystal habits are diverse and the particle size distribution is wide under the binary solvent system based on SEM pictures (Fig. 6), which is also the result of the simultaneous existence of two crystal forms. However, the aspect ratio of crystals with hexagonal cross-sections is very sensitive to changes in crystallization conditions. Therefore, we quantified the morphology of the crystals by counting the aspect ratio of the characteristic crystals mainly using polarized light microscope micrographs and SEM images. The specific method for determining the aspect ratio was indicated by the supplementary material. The aspect ratio of crystals with hexagonal cross-sections under VDMSO: VDMF = 3:2, the aspect ratio is widely distributed in the range of 0.86–2.46. Under VDMSO: VDMF = 1:1, the aspect ratio is mostly between 0.66-1.46. Under VDMSO: VDMF = 2:3, the aspect ratio is mainly concentrated in the range of 0.46-1.26.
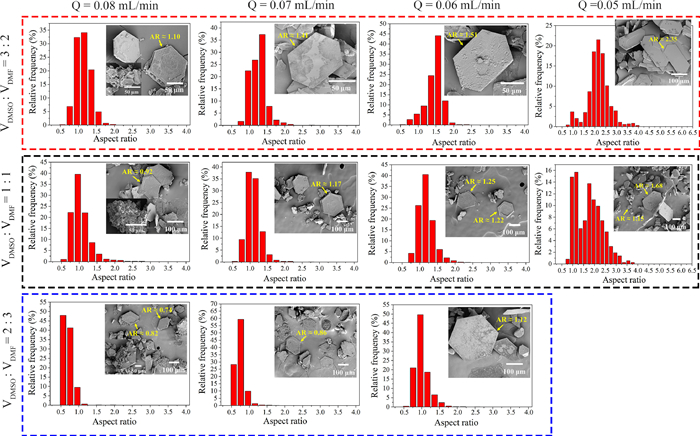
The analysis revealed that the aspect ratio of crystals with hexagonal cross-sections obtained at all three solvent compositions increases with decreasing both the DMF content in mixed solvents and the antisolvent flow rate. Changes in the solvent environment also affect the action of solvent molecules on each crystal face, which changes the relative growth rate of crystal faces under different crystallization conditions, resulting in the formation of hexagonal crystals with different aspect ratios. Moreover, we found that short hexagonal prism crystals with severe agglomeration were also obtained under the antisolvent flow rate condition of relatively high form β content. The particle size is smaller than that obtained at the same time as the hexagonal sheet-like crystal habit. Raman spectrum characterization was used to qualitatively analyze the solid form of crystals with different morphologies obtained in DMSO-DMF-H2O. According to the results shown in Fig. S16 (Supporting information), we found that the bulk crystals with smaller particle sizes are basically consistent with the Raman spectrum of Ph3COH (Fig. S16d). The Raman spectrum (Figs. S16a-c) of hexagonal sheet-like crystals with different aspect ratios shows the characteristic vibration peaks of DMSO at 672.5 ± 2 cm−1 and 2929.4 ± 1 cm−1. Therefore, combined with the crystal morphology characteristics obtained in a single main solvent, we think that in the binary mixed main solvent system, β-form crystals tend to grow into short hexagonal prismatic crystals, while DMSO solvates tend to grow into hexagonal sheet-like crystals with different aspect ratios.
In this study, we developed a microfluidic antisolvent crystallization approach to investigate the effects of the solvent, initial concentration of Ph3COH, and antisolvent flow rate on the polymorph and crystal habit of Ph3COH. The findings demonstrate that we obtained pure 2Ph3COH·DMSO (DMSO solvate), pure Ph3COH (form β), and their mixtures with controllable ratios. We revealed for the first time that the decrease in DMSO content in mixed solvents and the increase in supersaturation result in the relative decrease in hydrogen bonding sites of DMSO and the increase in nucleation rate of β-form crystal, respectively, which inhibit the formation of DMSO solvate and facilitates the crystallization of form β. Furthermore, crystal habits of DMSO solvate using the microfluidic approach exhibit the well-controlled shapes of hexagonal sheet-like and bulk. In binary solvents, we can regulate the aspect ratios of hexagonal sheet-like crystals to vary between 0.46–2.46 by adjusting the solvent composition and antisolvent flow rate. In DMF-H2O, the unique crystallization technique prompts products to crystallize in the β-form without the influence of solvent molecules. Moreover, we can control the transition of the preferred crystal face of the β-form crystal from (211) to (003) by increasing supersaturation, which regulates the crystal habit to transform from long needle-like shapes to short hexagonal prisms. We also supplemented the Raman spectrum characterization of form β and DMSO solvate, which complemented the FTIR spectrum to determine the crystal structure of Ph3COH in different solid forms. Therefore, this work also provides new spectral characterization data for the identification of different solid forms of Ph3COH.
This superior technique plays a vital role in avoiding clogging in microchannels and preparing high-quality crystals with regular shape, high purity, and structural integrity due to isolating the primary mixing of the solution from the crystal formation (nucleation and growth). Consequently, microfluidics demonstrates significant advantages in screening and controlling the solid form and crystal habit. Furthermore, both the method and fundamental findings in this work lay a solid foundation for understanding and optimizing the mechanism of multi-product reactions with Ph3COH as the by-product, such as the production of AZT. The promising approach is also suitable for studying the crystallographic parameters of other substances.
We declare that we do not have any commercial or associative interest that represents a conflict of interest in connection with the work submitted.
This work is supported by the National Natural Science Foundation of China (No. 22278128).
Supplementary material associated with this article can be found, in the online version, at doi:
J.B. Gong, Y. Wang, S.C. Du, et al., Chem. Eng. Technol. 39 (2016) 807–814. doi: 10.1002/ceat.201500718
T. Ono, J.H. ter Horst, P.J. Jansens, Cryst. Growth Des. 4 (2004) 465–469. doi: 10.1021/cg0342516
A.D. Bond, Curr. Opin. Solid. St. M 13 (2009) 91–97. doi: 10.1016/j.cossms.2009.06.004
Z.H. Li, J.M. Zhou, X. Zhang, S.G. Wu, J.B. Gong, Chin. Chem. Lett. 34 (2023) 107983. doi: 10.1016/j.cclet.2022.107983
J.T. Li, J.Q. Li, H.J. Liu, et al., Chin. Chem. Lett. 33 (2022) 4069–4073. doi: 10.1016/j.cclet.2022.03.090
M. Kitamura, T. Hara, M. Takimoto-Kamimura, Cryst. Growth Des. 6 (2006) 381–386.
M. Kitamura, S. Hironaka, Cryst. Growth Des. 6 (2006) 146–153.
I.S. Lee, K.T. Kim, A.Y. Lee, A.S. Myerson, Cryst. Growth Des. 8 (2008) 108–113. doi: 10.1021/cg700890m
C.P. Price, A.L. Grzesiak, A.J. Matzger, J. Am. Chem. Soc. 127 (2005) 5512–5517. doi: 10.1021/ja042561m
C.S. Strom, F. Leusen, R.M. Geertman, G. Ariaans, J. Cryst. Growth 171 (1997) 236–249. doi: 10.1016/S0022-0248(96)00486-1
R. Mohan, A.S. Myerson, Chem. Eng. Sci. 57 (2002) 4277–4285. doi: 10.1016/S0009-2509(02)00344-5
M.A. Lovette, M.F. Doherty, Cryst. Growth Des. 12 (2012) 656–669. doi: 10.1021/cg200855p
G. Yang, N. Kubota, Z. Sha, M. Louhi-Kultanen, J. Wang, Cryst. Growth Des. 6 (2016) 2799–2803.
D. Iohara, K. Yoshida, K. Yamaguchi, et al., Cryst. Growth Des. 12 (2012) 1985–1991. doi: 10.1021/cg201691c
N.A. Mugheirbi, L. Tajber, Mol. Pharm. 12 (2015) 3468–3478. doi: 10.1021/acs.molpharmaceut.5b00480
X.Y. Liu, J. Cryst. Growth 198–199 (1999) 1281–1286.
R. Grimbergen, E.S. Boek, H. Meekes, J. Cryst. Growth 207 (1999) 112–121. doi: 10.1016/S0022-0248(99)00352-8
K. Srinivasan, J. Cryst. Growth 311 (2008) 156–162. doi: 10.1016/j.jcrysgro.2008.10.084
X. Wang, S. Wu, W. Dong, J. Gong, Org. Process. Res. Dev. 17 (2013) 1110–1116. doi: 10.1021/op400165c
Z. Li, Y. Ma, J. Lin, et al., J. Cryst. Growth 596 (2022) 126818. doi: 10.1016/j.jcrysgro.2022.126818
K. Patchigolla, D. Wilkinson, Ind. Eng. Chem. Res. 47 (2008) 804–812. doi: 10.1021/ie061381d
J.O. Halford, J. Am. Chem. Soc. 53 (1931) 105–112. doi: 10.1021/ja01352a016
H.H. Hatt, J. Chem. Soc. (Resumed) (1933) 776–786. doi: 10.1039/jr9330000776
E. Weber, K. Skobridis, I. Goldberg, J. Chem. Soc., Chem. Commun. (1989) 1195–1197.
K. Eckardt, H. Paulus, H. Fuess, N. Onoda-Yamamuro, R. Ikeda, J. Incl. Phenom. Macrocycl. Chem. 35 (1999) 431–449. doi: 10.1023/A:1008016520974
Y. Yamauchi, S. Ookawara, S. Yoshikawa, J. Chem. Eng. Jpn. 44 (2011) 895–900. doi: 10.1252/jcej.11we049
M. Sultana, K.F. Jensen, Cryst. Growth Des. 12 (2012) 6260–6266. doi: 10.1021/cg301538y
J.Y. Shi, P. Zhu, S.F. Zhao, et al., Reac. Chem. Eng. 5 (2020) 1093–1103. doi: 10.1039/D0RE00119H
L.L. Lin, Y.J. Yin, S.A. Starostin, et al., Chem. Eng. J. 425 (2021) 131511. doi: 10.1016/j.cej.2021.131511
L.Y. Ma, A. Nilghaz, J.R. Choi, X.Q. Liu, X.N. Lu, Food Chem. 246 (2018) 437–441. doi: 10.1016/j.foodchem.2017.12.022
W. Luo, F. Liu, Y.H. Guo, et al., Chin. Chem. Lett. 34 (2023) 107636. doi: 10.1016/j.cclet.2022.06.059
J.J. Qiu, W.Q. Tang, B. Bao, S.L. Zhao, Chem. Eng. J. 424 (2021) 130486. doi: 10.1016/j.cej.2021.130486
Y.H. Guo, F. Liu, J.J. Qiu, Z. Xu, B. Bao, Energy 256 (2022) 124524. doi: 10.1016/j.energy.2022.124524
C.X. Zhao, A. Middelberg, Chem. Eng. Sci. 66 (2011) 1394–1411. doi: 10.1016/j.ces.2010.08.038
P. Agnihotri, V.N. Lad, J. Braz. Soc. Mech. Sci. 40 (2018) 301. doi: 10.1007/s40430-018-1203-8
A. Nishigaki, M. Maruyama, M. Numata, et al., Eng. Life. Sci. 20 (2020) 395–401. doi: 10.1002/elsc.202000021
C. Sauter, K. Dhouib, B. Lorber, Cryst. Growth Des. 7 (2008) 2247–2250.
L. Li, R.F. Ismagilov, Annu. Rev. Biophys. 39 (2010) 139–158. doi: 10.1146/annurev.biophys.050708.133630
M.R. Thorson, S. Goyal, B.R. Schudel, et al., Lab Chip 11 (2011) 3829–3837. doi: 10.1039/c1lc20645a
F. Liu, W. Luo, J.J. Qiu, et al., Ind. Eng. Chem. Res. 61 (2022) 6693–6702. doi: 10.1021/acs.iecr.2c00655
L. Frenz, A. El Harrak, M. Pauly, et al., Angew. Chem. Int. Ed. 47 (2008) 6817–6820. doi: 10.1002/anie.200801360
Y.J. Song, H. Modrow, L.L. Henry, et al., Chem. Mater. 18 (2006) 2817–2827. doi: 10.1021/cm052811d
J.C. Wang, F. Zhang, Y.J. Wang, G.S. Luo, W.B. Cai, Chem. Eng. J. 293 (2016) 1–8. doi: 10.1016/j.cej.2016.02.053
V. Bhamidi, S.H. Lee, G. He, et al., Cryst. Growth Des. 15 (2015) 3299–3306. doi: 10.1021/acs.cgd.5b00420
F.Y.H. Yan, P. Zhu, S.F. Zhao, et al., Chem. Eng. J. 428 (2022) 131096. doi: 10.1016/j.cej.2021.131096
L. Li, H.J. Ling, J. Tao, C.H. Pei, X.H. Duan, CrystEngComm 24 (2022) 1523–1528. doi: 10.1039/D1CE01524A
Y.C. Tan, J.S. Fisher, A.I. Lee, V. Cristini, A.P. Lee, Lab Chip 4 (2004) 292–298. doi: 10.1039/b403280m
B. Zheng, J.D. Tice, R.F. Ismagilov, Anal. Chem. 76 (2004) 4977–4982. doi: 10.1021/ac0495743
M. van der Woerd, D. Ferree, M. Pusey, J. Struct. Biol. 142 (2003) 180–187. doi: 10.1016/S1047-8477(03)00049-2
T. Nisisako, T. Torii, T. Higuchi, Lab Chip 2 (2002) 24–26. doi: 10.1039/B108740C
Y.F. Tu, X.H. Chao, J.P. Sang, S.Y. Huang, X.W. Zou, Physica A 387 (2008) 4007–4014. doi: 10.1016/j.physa.2008.02.074
L.N. Bengoa, W.R. Tuckart, N. Zabala, G. Prieto, W.A. Egli, J. Mater. Eng. Perform. 24 (2015) 2274–2281. doi: 10.1007/s11665-015-1503-4

Figure 1 Schematic diagram of the microfluidic device for screening and controlling the crystal habit and solid form of Ph3COH.

Figure 2 (a, b) PXRD patterns of crystals obtained in the DMSO—H2O system at different antisolvent flow rates in the range of 2θ = 5°−30° and 7°−15°, respectively, with C0 = 4.2702 mg/mL. (c) PXRD pattern of crystals obtained in the DMF-H2O system at different antisolvent flow rates, C0 = 12.5200 mg/mL.

Figure 3 (a) Changing trend of supersaturation and RTChkl with antisolvent flow rates in DMF-H2O system, C0 = 12.5200 mg/mL. (b) SEM micrographs of products obtained under different crystallization conditions in a single main solvent system.

Figure 4 (a) Comparison of FTIR spectrum of DMSO solvate, form β, mixed crystals and commercial Ph3COH. (b) Hirshfeld surfaces of Ph3COH molecules in the DMSO solvate unit cell structure (green dashed line indicates hydrogen bond: O—H…O) and β-form cell structure. (c) 2D fingerprint plots of DMSO solvate and form β.

Figure 5 (a) Calibration curve of characteristic peak area ratio and β-form mass fraction, expressed in wt%. (b) The solid form selectivity of Ph3COH as a function of antisolvent flow rate at different initial concentrations in the DMSO—H2O system. (c) Changing trend of supersaturation with antisolvent flow rate at different initial concentrations in the DMSO—H2O system. (d) The solid form selectivity of Ph3COH as a function of antisolvent flow rate in different binary main solvent systems.

 扫一扫看文章

扫一扫关注我们
 DownLoad:
 下载:
下载:

 下载:
下载: