Figure 1.
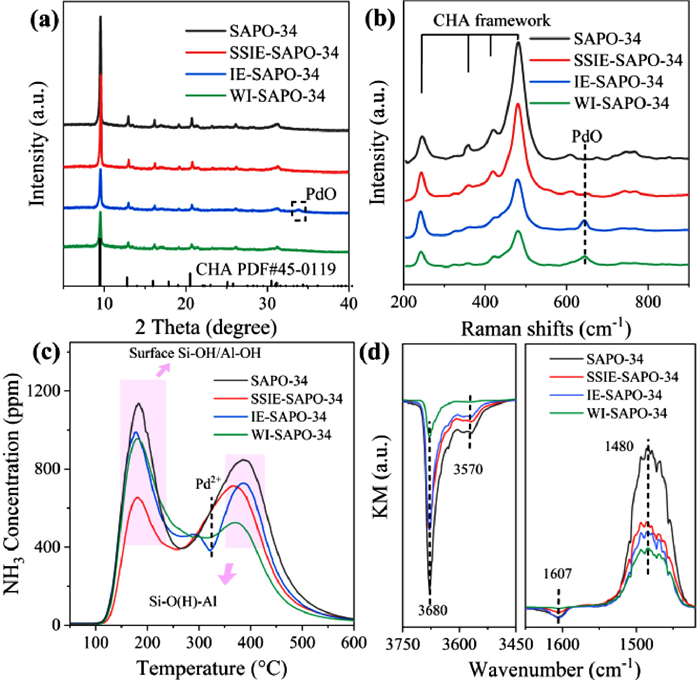
(a) XRD patterns, (b) UV-Raman spectra, (c) NH3-TPD curves and (d) NH3-DRIFT spectra of SAPO-34, SSIE-SAPO-34, IE-SAPO-34 and WI-SAPO-34.
Efficient NOx abatement by passive adsorption over a Pd-SAPO-34 catalyst prepared by solid-state ion exchange
Linhui Liu , Wuwan Xiong , Mingli Fu , Junliang Wu , Zhenguo Li , Daiqi Ye , Peirong Chen

Increasingly stringent regulations on nitrogen oxide emissions (NOx) from diesel vehicles prompt researchers to explore high-efficiency after-treatment technologies [1–4]. Selective catalytic reduction (SCR), currently the mainstream technology for NOx purification, performs poorly below 200 ℃, hindering the abatement of NOx during the cold-start period of vehicle operation (i.e., within the first 1000s from start-up while exhaust temperature is below 200 ℃) [5,6]. Recently, passive NOx adsorbers (PNAs), which are capable of adsorbing NOx at low temperatures and releasing the adsorbed NOx when the temperature rises above 200 ℃, have been used in combination with SCR to effectively improve DeNOx efficiency [7,8]. Palladium-exchanged chabazite (Pd-CHA) catalysts are considered as the best PNAs due to their high adsorption capacity, ideal desorption temperature range and structural stability compared to other Pd-based materials (e.g., Pd/ZSM-5, Pd/BEA and Pt/CeO2) [9–11]. The highly dispersed Pd2+ ions in Pd-CHA are confirmed to be the main trapping sites for NOx at low temperatures, and enormous efforts have been devoted to synthesize Pd-CHA materials with high Pd2+ density [12–14].
Kivantsev et al. developed a modified incipient impregnation method and obtained Pd-zeolite catalysts with atomically dispersed Pd sites even at a high Pd loading of 1.9 wt%, using NH4-form CHA-type SSZ-13 zeolite and Pd(NO3)2 precursor [14]. Zhao et al. subsequently validated the effectiveness of this method, and demonstrated that NH4+ ions on the zeolite could combine with Pd2+ to form Pd(NH3)x2+ intermediates favoring the dispersion of Pd2+ ions within the zeolite matrix [15]. However, such solvent-based ion exchange process involved complex synthetic operations, such as continuous washing and filtration, as well as the consumption of a large amount of chemical reagents, which is not favorable in industrial application and disobeys the concept of green chemistry [16]. Moreover, the zeolites (in particular those aluminosilicophosphate-based) are prone to irreversible hydrolysis during the ion exchange process, which reduces the crystallinity of the catalysts [17,18]. Solid-state ion exchange (SSIE), which is a simplified process involving no water, is considered as an alternative to overcome the problems of solvent-based methods and thus explored repeatedly recently [16–20]. Ryou et al. first used a SSIE method for Pd loading [19]. However, the Pd precursor, i.e. PdCl2, agglomerated at high temperatures forming large Pd6Cl12 intermediates, resulting in poorly distributed Pd particles on the catalyst and extremely low NOx adsorption [19,20]. The use of metal chloride precursors in SSIE, however, often results in residual chlorine in the obtained catalyst, which blocks the active sites from contacting with gas molecules [21,22]. Recent studies suggest that metal oxides can be used as precursor in the SSIE synthesis of metal ion-exchanged zeolites. For example, Gao et al. used CuO as Cu precursor in the SSIE synthesis of Cu-SAPO-34 with excellent Cu site distribution and superior high-temperature hydrothermal stability [17].
In this work, Pd-SAPO-34 was synthesized via a SSIE method using PdO as Pd precursor, and was compared with Pd-SAPO-34 catalysts by solvent-based ion exchange (IE) and wet impregnation (WI) methods. Details about the preparation and characterization procedures are provided in Supporting information. Furthermore, various in situ techniques were combined to trace the transformation of PdO to PNA-active Pd sites during SSIE.
X-ray diffraction (XRD) patterns of the four SAPO-34 samples suggest that the CHA-type skeletal structure of SAPO-34 was all maintained after Pd loading by different methods (Fig. 1a) [23]. Notably, as compared to the Pd-free fresh SAPO-34, both IE-SAPO-34 and WI-SAPO-34 showed a significant decrease in intensity of the diffraction peak at 9.5°, indicating a structural disruption of the zeolite. SEM images in Fig. S1 (Supporting information) also clearly show a collapse of the cubic structures of IE-SAPO-34 and WI-SAPO-34 and the appearance of irregular particle agglomerates. For the IE-SAPO-34, an additional diffraction peak at 33.9° for PdO appeared, indicating the formation of PdO due to insufficient dispersion of Pd2+ during the IE process [23,24].
Ultraviolet Raman spectroscopy (UV-Raman) was then employed to understand the fine structures and the properties of PdOx (x = 1, 2) species in the Pd-SAPO-34 catalysts. The bands at 245 cm−1, 360 cm−1, 417 cm−1 and 489 cm−1 (Fig. 1b) are typical framework vibrations of SAPO-34 [25,26]. An intensity comparison of the framework bands of the four samples indicates that the SAPO-34 structure was attacked by H2O during catalyst preparation by the IE and WI methods. The band at 650 cm−1 that appears in the spectra of IE-SAPO-34 and WI-SAPO-34 samples is assigned to the Pd-O vibration of PdO [27]. It has to be noted that the presence of PdOx in WI-SAPO-34, while clearly visible in UV-Raman, was not detectable in XRD, presumably due to the formation of small PdO2 agglomerates in the catalyst [17].
In the NH3-temperature programmed desorption (NH3-TPD) profiles (Fig. 1c), two distinct desorption peaks are present in all the four samples, namely the low-temperature desorption peak (LT peak) at 120~220 ℃ for NH3 on weakly acidic sites (such as surface Si-OH, Al-OH and P-OH) [28], and the high-temperature desorption peak (HT peak) at 300-450 ℃ for NH3 on Brønsted acid sites (BASs) [29]. The HT peak decreased after Pd loading regardless of the preparation method, which is attributed to a consumption of BASs during Pd2+ introduction into the zeolite lattice [29,30]. The exceptionally markable reduction of HT peak in case of WI-SAPO-34 was associated with its skeletal collapse, in agreement with XRD and UV-Raman observations (Figs. 1a and b). In addition, the HT peak shifts towards lower temperatures, due to the desorption of NH3 from Pd2+ ions in the temperature range of 300-350 ℃ [24]. The SSIE-SAPO-34 catalyst exhibits peculiarly more pronounced NH3 desorption in this temperature range, implying a higher prosperity of Pd2+ ions. Meanwhile, LT peak intensity decreased drastically in case of SSIE-SAPO-34, which is attributed to a consumption of surface -OH groups during ion exchange via the following route (Eq. 1):
|
|
(1) |
Indeed, in situ diffuse reflection infrared Fourier transform spectroscopy (DRIFTS) over NO-saturated SSIE-SAPO-34 (Fig. S3 in Supporting information) recorded the lowest intensity for the broad band at 3200-2100 cm−1 arising from H-bonded hydroxyl species [31,32], confirming the consumption of surface -OH species via Eq. 1 during SSIE.
Fig. 1d shows the DRIFTS spectra of four SAPO-34 samples after NH3 saturation at 30 ℃. Characteristic peaks in the 1400-1700 cm−1 range are N—H vibrations for NH4+ and NH3, namely the 1480 cm−1 band for the N—H vibrations of NH4+ at the BASs (including terminal Si-OH, P-OH and Al-O(H)-Si) and the 1617 cm−1 band for NH3 at Lewis acid sites (LASs, including transition metal ions and the extra-framework Al species) [31,33]. Within the -OH stretching range (i.e., 3450-3750 cm−1), the negative bands at 3680 cm−1 and 3570 cm−1 arise from the NH3 occupying of P-OH sites and the depletion of Si-O(H)-Al by NH3, respectively [34]. The two characteristic peaks for Si-O(H)-Al (at 1480 cm−1 and 3570 cm−1, respectively) originate from -OH within the different oxygen coordination environment [31], and show the same intensity variation trend upon Pd loading. The in situ DRIFTS results suggest that Pd2+ ions enter the zeolite framework and occupy the Si-O(H)-Al sites, leading to decreased NH3 adsorption on the zeolite. Furthermore, in conjunction with the change in intensity of the 3680 cm−1 band for P-OH and the structural analysis (Figs. 1a and b), structural disruption is considered to be another trigger for the weakening of the characteristic peaks at 1480 cm−1 and 3570 cm−1 for IE-SAPO-34 and WI-SAPO-34.
Chemical nature of Pd species in the Pd-SAPO-34 zeolites were analyzed by XPS. The Pd 3d spectra with peak deconvolutions are shown in Fig. 2a, and the applied fitting parameters are listed in Table S2 (Supporting information). Pd species in IE-SAPO-34 and WI-SAPO-34 are mainly present in the +2 and +4 valence states, corresponding to Pd2+/PdO and PdO2, respectively, in PdOx agglomerates [24]. A larger fraction of Pd in the +2 valence was observed in IE-SAPO-34, suggesting a predominant presence of PdO and/or Pd2+ on the catalyst surface. On the contrary, WI-SAPO-34 shows a large amount of Pd in the +4 valence, demonstrating the occurrence of large amounts of PdOx on the catalyst surface. SSIE-SAPO-34 exhibited a distinct difference in Pd valence state with the presence of Pd mainly in +2 valence and 0 valence (i.e., Pd0) [2]. The 0-valent state of Pd, namely Pd0, formed by the decomposition of PdO at high temperatures, labile to be oxidized again during the cooling process. The stable existence of Pd0 on SSIE-SAPO-34 indicates a good dispersion of Pd over the catalyst [2]. An additional pathway for PdO conversion during solid-state ion exchange is indicated (Eq. 2):
|
|
(2) |
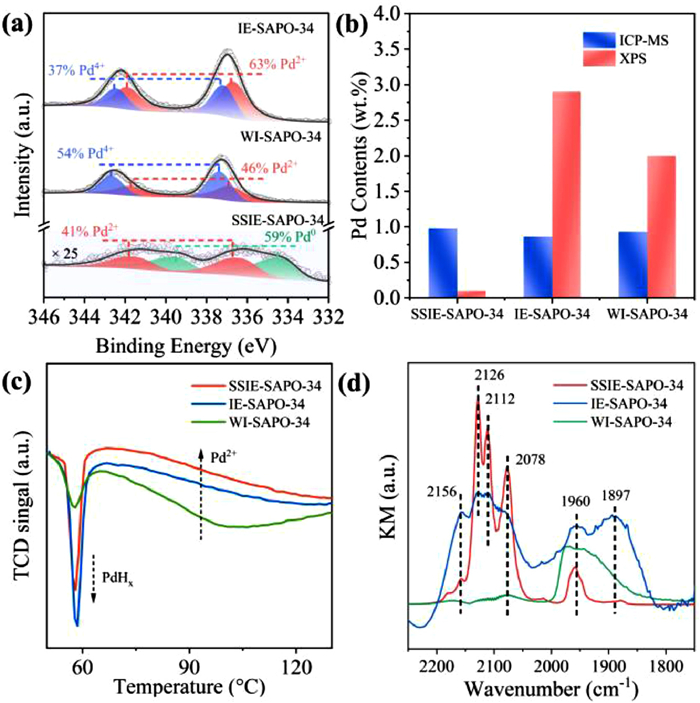
Pd contents in the Pd-SAPO-34 zeolites were determined by ICP-MS and XPS (Fig. 2b). Notably, XPS is only capable of detecting atomic dispersed Pd mainly in the outmost ten layers on the catalyst surface [35]. The ICP-MS results showed nearly 1 wt% Pd loading for all Pd-SAPO-34. Atomic concentrations of Pd on the catalyst surface were determined to be 0.57% (2.9 wt%) and 0.40% (2.0 wt%) for IE-SAPO-34 and WI-SAPO-34, respectively (Table S4 in Supporting information). On the contrary, SSIE-SAPO-34 shows a Pd atomic concentration of only 0.02% (0.1 wt%), indicating almost all the Pd species are dispersed inside the zeolite lattice [36].
The form of Pd were probed by H2-temperature programmed reduction (H2-TPR), and the results are shown in Fig. 2c. The sharp negative peak at approximately 60 ℃ is the decomposition of PdHx, which is generated by the adsorption of H2 by Pd0, hence the peak can also indicate the sum of PdO and Pd0 on the catalyst [20,33]. The broad peak at approximately 100 ℃ is the reduction of isolated Pd2+ [37]. IE-SAPO-34 exhibits the strongest PdHx decomposition peak due to a large fraction of PdO on surface; WI-SAPO-34 exhibits both the weakest PdHx decomposition peak and the least Pd2+ distribution due to the agglomerated PdOx on surface, which is difficult to reduce by H2; SSIE-SAPO-34 exhibits a strong PdHx decomposition peak as well as the largest Pd2+ distribution due to the distribution of Pd2+ and Pd0 on it [34].
In situ DRIFTS with CO as a probe molecule (Fig. 2d) was employed to probe the oxidation state and local coordination environment of Pd on the catalyst. While the characteristic peaks at 2156 cm−1, 2126 cm−1, 2112/2078 cm−1, and 1960 cm−1 belong to CO-[Pd(OH)]+, (CO)2-Pd2+ or CO-[Pd(OH)]+, linear CO adsorption on Pd0, and CO on Pd0/Pd+, respectively, the 1897 cm−1 band can be attributed to the formation of Pdx(CO)y by CO adsorption on small Pd clusters [38,39]. Significantly different adsorption characteristics are shown on the three catalysts. While CO adsorption on Pd2+ and Pd0 (at 2126 cm−1, 2112/2078 cm−1, and 1960 cm−1) was observed on SSIE-SAPO-34, IE-SAPO-34 also exhibited CO adsorption on PdOx clusters (at 1897 cm−1) in addition to CO adsorption on Pd2+ and Pd0. On the contrary, WI-SAPO-34 exhibits only CO adsorption on PdOx, which may be due to the accumulation of PdOx on the surface and/or the collapsed pore structure of zeolite hindering CO adsorption on Pd2+ [40].
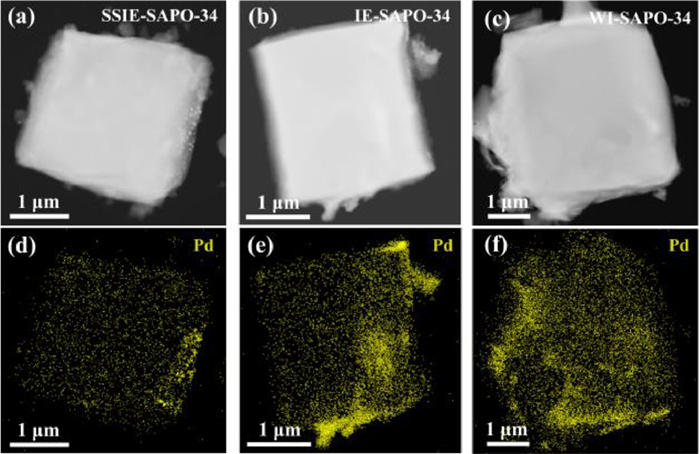
TEM and EDS analyses were conducted to visualize the effect of loading process on the Pd dispersion, and the collected images are shown in Fig. 3, Figs. S4 and S5 (Supporting information). In Fig. 3, well Pd dispersion was clearly observable on SSIE-SAPO-34, in good agreement with the CO-DRIFTS and XPS results. Meanwhile, Pd aggregates were also observed on IE-SAPO-34. Pd dispersion in WI-SAPO-34 is similar to that in IE-SAPO-34, except that even more Pd aggregates were noted. In Fig. S4, dark regions in the O-profiles of WI-SAPO-34, indicating a reduced density of T-O-T bonds in the structure, confirms a structural collapse of the SAPO-34 zeolite as also observed by UV-Raman and XRD. Particle size distributions in Fig. S5 show that Pd species on WI-SAPO-34 are mainly present as large PdOx particles, while Pd species on IE-SAPO-34 are well distributed Pd nanoparticles with ~2 nm in size.
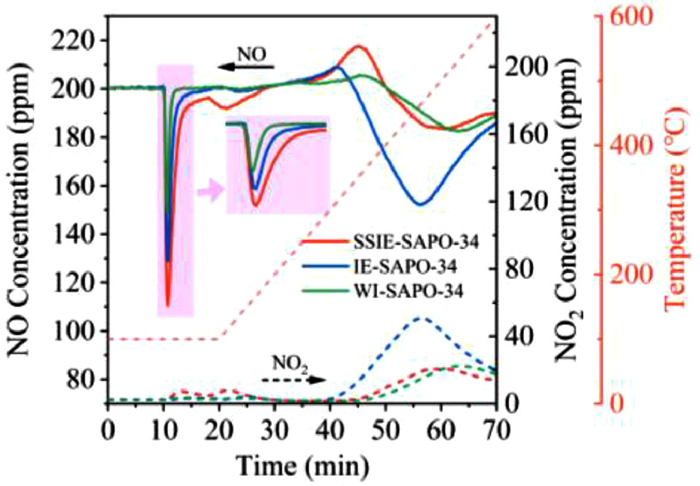
The PNA results of Pd-SAPO-34 catalysts at 100 ℃ are shown in Fig. 4. The NOx adsorption capacities of SSIE-SAPO-34, IE-SAPO-34 and WI-SAPO-34 were measured to be 32.12 µmol/g, 15.62 µmol/g and 6.03 µmol/g, respectively. In line with the characterization results, SSIE-SAPO-34 with the most Pd2+ species exhibited the best PNA performance, whereas WI-SAPO-34 with the highest degree of Pd agglomeration due to structural collapse exhibited the poorest PNA performance. In PNA over SSIE-SAPO-34, a NOx adsorption peak observed at the onset of the temperature ramp was observed and can be attributed to H2O desorption freeing new sites for NOx adsorption [25]. The formed nitrite decomposed to form NO at temperatures above 200 ℃. Further increase of temperature led to the generation of NO2, particularly over IE-SAPO-34, presumably due to a significant oxidation of NO catalyzed by PdO nanoparticles [25]. This was confirmed by additional CO oxidation tests over the three Pd-SAPO-34 catalysts. As shown in Fig. S6 (Supporting information), IE-SAPO-34 exhibits the lowest temperature to achieve 50% CO conversion (T50), because of its highest fraction of well distributed PdO nanoparticles that are known to be active in CO oxidation [41,42].
In summary, we developed a simplified and scalable SSIE method to obtain well-dispersed Pd-SAPO-34 zeolite catalysts. Various in situ techniques were combined to trace the transformation of PdO to PNA-active Pd sites during SSIE. It was revealed that PdO precursor was mainly converted to Pd2+ cations coordinated to the zeolite framework by consuming -OH groups of the zeolite, while a small fraction of PdO was thermally decomposed into highly dispersed Pd0 clusters in the zeolite pore channels. Such SSIE method avoids structural disruption and Pd agglomeration that appears in Pd-SAPO-34 prepared by conventional wet-chemistry methods. More importantly, the Pd-SAPO-34 catalyst by SSIE demonstrated the highest NOx adsorption capacity at low temperatures in PNA tests. This modified SSIE method paves a new way for the cost-effective synthesis of defect-free high-performance Pd-SAPO-34 zeolites as PNA catalysts.
The article has no conflict of interest.
This work was supported by the National Natural Science Foundation of China (No. 21976058), the Natural Science Foundation of Guangdong Province (No. 2023A1515011682), the Fundamental Research Funds for the Central Universities (No. 2022ZYGXZR018) and the National Engineering Laboratory for Mobile Source Emission Control Technology (No. NELMS2020A10). P. Chen appreciates the funding from the Pearl River Talent Recruitment Program of Guangdong Province (No. 2019QN01L170) and the Innovation & Entrepreneurship Talent Program of Shaoguan City.
Supplementary material associated with this article can be found, in the online version, at doi:
C. Bian, D. Li, Q. Liu, et al., Chin. Chem. Lett. 33 (2022) 1169–1179. doi: 10.1016/j.cclet.2021.07.066
Y. Wang, X. Shi, Z. Liu, et al., Appl. Catal. B 324 (2023) 122254. doi: 10.1016/j.apcatb.2022.122254
T.V. Johnson, S.A.E. Int, J. Engines 5 (2012) 216–234. doi: 10.4271/2012-01-0368
Z. Li, C. Wang, J. Qiu, et al., Chin. Chem. Lett. 35 (2024) 108432. doi: 10.1016/j.cclet.2023.108432
H. Chen, J.E. Collier, D. Liu, et al., Catal. Lett. 146 (2016) 1706–1711. doi: 10.1007/s10562-016-1794-6
C. Sharp, C. Henry, S. Yoon, M. Carter, C.C. Webb, SAE Int. J. Engines 10 (2017) 1722–1735. doi: 10.4271/2017-01-0956
K. Khivantsev, N.R. Jaegers, L. Kovarik, et al., Emiss. Control. Sci. Technol. 6 (2019) 126–138.
J.R. Theis, C.K. Lambert, Catal. Today 258 (2015) 367–377. doi: 10.1016/j.cattod.2015.01.031
J. Lee, Y. Ryou, S. Hwang, et al., Catal. Sci. Technol. 9 (2019) 163–173. doi: 10.1039/C8CY02088D
Y. Zheng, L. Kovarik, M.H. Engelhard, et al., J. Phys. Chem. C 121 (2017) 15793–15803. doi: 10.1021/acs.jpcc.7b04312
J. Lee, Y. Kim, S. Hwang, et al., Catal. Today 360 (2021) 350–355. doi: 10.1016/j.cattod.2020.01.039
H. Zhao, X. Chen, A. Bhat, Y. Li, J.W. Schwank, Appl. Catal. B 286 (2021) 119874. doi: 10.1016/j.apcatb.2020.119874
S. Yasumura, H. Ide, T. Ueda, et al., JACS Au 1 (2021) 201–211. doi: 10.1021/jacsau.0c00112
K. Khivantsev, N.R. Jaegers, L. Kovarik, et al., Angew. Chem. Int. Ed. 57 (2018) 16672–16677. doi: 10.1002/anie.201809343
H. Zhao, X. Chen, A. Bhat, Y. Li, J.W. Schwank, Appl. Catal. B 282 (2021) 119611. doi: 10.1016/j.apcatb.2020.119611
S. Zhang, J. Chen, Y. Meng, et al., Appl. Surf. Sci. 571 (2022) 151328. doi: 10.1016/j.apsusc.2021.151328
F. Gao, E.D. Walter, N.M. Washton, J. Szanyi, C.H.F. Peden, Appl. Catal. B 162 (2015) 501–514. doi: 10.1016/j.apcatb.2014.07.029
Z. Chen, C. Bian, C. Fan, T. Li, Chin. Chem. Lett. 33 (2022) 893–897. doi: 10.1016/j.cclet.2021.06.071
Y. Ryou, J. Lee, S.J. Cho, et al., Appl. Catal. B 212 (2017) 140–149. doi: 10.1016/j.apcatb.2017.04.077
R. YoungSeok, J. Lee, S.J. Cho, et al., Appl. Catal. B 212 (2017) 140–149. doi: 10.1016/j.apcatb.2017.04.077
S.E. Bozbag, E.M.C. Alayon, J. Pecháček, et al., Catal. Sci. Technol. 6 (2016) 5011–5022. doi: 10.1039/C6CY00041J
H.V. Le, S. Parishan, A. Sagaltchik, et al., ACS Catal. 7 (2017) 1403–1412. doi: 10.1021/acscatal.6b02372
Y. Cui, J. Zhu Chen, B. Peng, et al., JACS Au 1 (2021) 396–408. doi: 10.1021/jacsau.0c00109
J. Lee, Y. Ryou, S.J. Cho, et al., Appl. Catal. B 226 (2018) 71–82. doi: 10.1016/j.apcatb.2017.12.031
D. Chen, H. Lei, W. Xiong, et al., ACS Catal. 11 (2021) 13891–13901. doi: 10.1021/acscatal.1c03214
F. Han, M. Yuan, S. Mine, et al., ACS Catal. 9 (2019) 10398–10408. doi: 10.1021/acscatal.9b02975
Y. Zhang, H. Zhu, T. Zhang, et al., Environ. Sci. Technol. 56 (2022) 1917–1926. doi: 10.1021/acs.est.1c06068
W.H. Weber, R.J. Baird, G.W. Graham, J. Raman Spectrosc. 19 (1988) 239–244. doi: 10.1002/jrs.1250190404
Z. Chen, C. Fan, L. Pang, et al., Appl. Catal. B 237 (2018) 116–127. doi: 10.1016/j.apcatb.2018.05.075
A. Wang, K. Lindgren, M. Di, et al., Appl. Catal. B 278 (2020) 119315. doi: 10.1016/j.apcatb.2020.119315
F. Zhou, Y. Gao, G. Wu, F. Ma, C. Liu, Micro. Mesoporous Mater. 240 (2017) 96–107. doi: 10.1016/j.micromeso.2016.11.014
J. Lu, J. Zhong, Q. Ren, et al., Chin. Chem. Lett. 32 (2021) 3435–3439. doi: 10.1016/j.cclet.2021.05.029
D. Wang, L. Zhang, K. Kamasamudram, W.S. Epling, ACS Catal. 3 (2013) 871–881. doi: 10.1021/cs300843k
D. Chen, Y. Yan, A. Guo, et al., Appl. Catal. B 322 (2023) 122118. doi: 10.1016/j.apcatb.2022.122118
M. Huang, A. Adnot, S. Kaliaguine, J. Am. Chem. Soc. 25 (1992) 10005–10010. doi: 10.1021/ja00051a037
J. Hu, Y. Li, Y. Zhen, M. Chen, H. Wan, Chin. J. Catal. 42 (2021) 367–375. doi: 10.1016/S1872-2067(20)63672-5
Z. Chen, E. Vorobyeva, S. Mitchell, et al., Nat. Nanotechnol. 13 (2018) 702–707. doi: 10.1038/s41565-018-0167-2
Y. Kim, J. Sung, S. Kang, et al., J. Mater. Chem. A 9 (2021) 19796–19806. doi: 10.1039/D1TA00468A
C. Paolucci, I. Khurana, A.A. Parekh, et al., Science 357 (2017) 898–903. doi: 10.1126/science.aan5630
S. Kang, M. Wang, N. Zhu, et al., Chin. Chem. Lett. 30 (2019) 1450–1454. doi: 10.1016/j.cclet.2019.03.023
K. Khivantsev, X. Wei, L. Kovarik, et al., Angew. Chem. Int. Ed. 61 (2022) e202107554. doi: 10.1002/anie.202107554
L. Meng, J. Lin, Z. Pu, et al., Appl. Catal. B 119-120 (2012) 117–122. doi: 10.1016/j.apcatb.2012.02.036

Figure 1 (a) XRD patterns, (b) UV-Raman spectra, (c) NH3-TPD curves and (d) NH3-DRIFT spectra of SAPO-34, SSIE-SAPO-34, IE-SAPO-34 and WI-SAPO-34.

Figure 2 (a) High-resolution XP Pd 3d spectra, (b) Pd contents (by ICP-MS and XPS), (c) H2-TPR curves and (d) in situ CO-DRIFT spectra of SAPO-34, SSIE-SAPO-34, IE-SAPO-34 and WI-SAPO-34.

Figure 3 (a-c) TEM images and (d-f) EDS mapping of Pd for SSIE-SAPO-34 (panels a and d), IE-SAPO-34 (panels b and e) and WI-SAPO-34 (panels c and f).

 扫一扫看文章

扫一扫关注我们
 DownLoad:
 下载:
下载:

 下载:
下载: