
Scheme 1.
Synthesis route for Erlotinib in batch process.
Multistep continuous flow synthesis of Erlotinib
Hui Jin , Qin Cai , Peiwen Liu , Yan Chen , Derong Wang , Weiping Zhu , Yufang Xu , Xuhong Qian

Cancer is a major cause of death and an important obstacle to improving life expectancy worldwide [1]. Lung cancer, an example of cancer caused by malignant tumors, is extremely harmful and one of the main causes of cancer-related deaths [2]. Erlotinib is a targeted antitumor drug for the treatment of non-small-cell lung cancer (NSCLC), which has gained wide market demand for its excellent therapeutic effects and tolerability [3-6]. Numerous synthetic routes for Erlotinib have been reported [7-13]. Although different starting materials are used in these routes, the main steps include etherification, addition, nitration, hydrogenation, cyclization, chlorination and amination reaction. Table S1 (Supporting information) presents several widely used synthetic routes, the synthetic routes were presented in Figs. S2-S4 (Supporting information).
The conventional batch process usually involves long reaction time, uncontrolled formation of by-product and complicated purification procedures. Continuous flow synthesis has developed rapidly over the last decades and has been widely used in various fields [14-23]. Compared to the batch process, continuous flow synthesis has the advantages of a reduced reaction times [24,25], enhanced process safety [26], improved selectivity of reactions [27], and achieved precise reaction control [28-33]. Therefore, it is meaningful to develop a simple, economical and commercially viable continuous flow process for Erlotinib.
First, we evaluated the batch process for Erlotinib (Scheme 1), with 3, 4-dihydroxybenzonitrile and 2-bromoethyl methyl ether as starting materials. The conditions for the etherification, nitration, reduction, addition, and cyclization reactions were optimized, and the effects of reactant molar ratio, solvent, reaction time, and reaction temperature were investigated in detail (Tables S2-S6 in Supporting information). After conducting a preliminary evaluation, we converted the batch process to a continuous flow process.
Step 1: Williamson ether synthesis in flow
During batch process optimization, we deemed potassium carbonate the most suitable base for catalyzing etherification. However, as potassium carbonate was not soluble in DMF, it tended to clog in a PTFE coil reactor, resulting in unstable reaction. Therefore, we chose a micro packed-bed flow reactor (inner diameter = 4.5 mm, length = 11 cm) to perform Williamson ether synthesis (Fig. 1). A DMF solution of 1 and 2-bromoethyl methyl ether was pumped through a packed-bed reactor filled with potassium carbonate as the base and SiO2 (100–200 mesh) for dispersion, using a back pressure regulator (BPR) at 75 psi at the end of the reactor coil to afford 2. The reaction solution was obtained after three residence times of stable operation, and the yields were calculated using high performance liquid chromatography (HPLC).
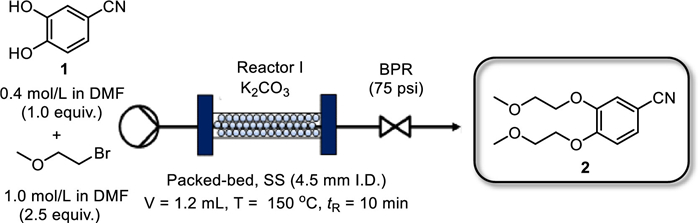
The effects of concentration, reaction temperature (T) and residence time (tR) were investigated. The yield increased with increasing temperature at the same residence time (Table 1, entries 1–5), although no equilibrium point in yield was observed up to 150 ℃. In addition, higher temperatures cause leakage of the reaction solution. This phenomenon is probably the tightness of reaction setup cannot resist the high temperature. Therefore, 150 ℃ was chosen as the optimal reaction temperature for this reaction. A slight increase in the concentration of 1 result in an increase in yield (Table 1, entries 6–8). As the concentration increases to 0.8 mol/L, the catalytic efficiency decreases and is no longer able to facilitate the completion of the reaction over the same reaction time. This causes a gradual decrease in yield to 50% (Table 1, entries 9 and 10). Furthermore, we found that the reaction achieved a quantitative conversion when the residence time was extended to 10 min. Finally, the optimum conditions were determined to be 150 ℃, and 10 min residence time with 0.4 mol/L of compound 1 to afford 2 under the nearly full conversion condition.
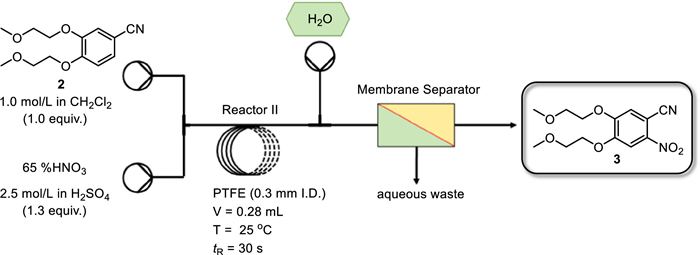
Step 2: Nitration in flow
Next, we optimized the conditions for the synthesis of 3 in a PTFE coil reactor. Typical systems used for the nitration reaction include nitric acid, nitric-sulfuric acid, superacid [34], and nitric acid mixed acetic anhydride [35]. By studying of batch reactions, we found that the nitration. capacity of the mixed system of nitric and sulfuric acid was most effective, with a high reaction rate and high yield. Therefore, we used the nitric–sulfuric acid system in the continuous flow process. The experimental setup of the continuous flow reactor is shown in Fig. 2. The CH2Cl2 solution of 2 (1.0 mol/L, 1.0 equiv.) and a solution of 65% nitric acid (2.5 mol/L, 1.3 equiv.) premixed with 98% sulfuric acid were streamed to the PTFE coil at 25 ℃. The reaction was quenched using cold water, and the reaction mixture was introduced into the membrane separator. The samples were then analyzed using HPLC.
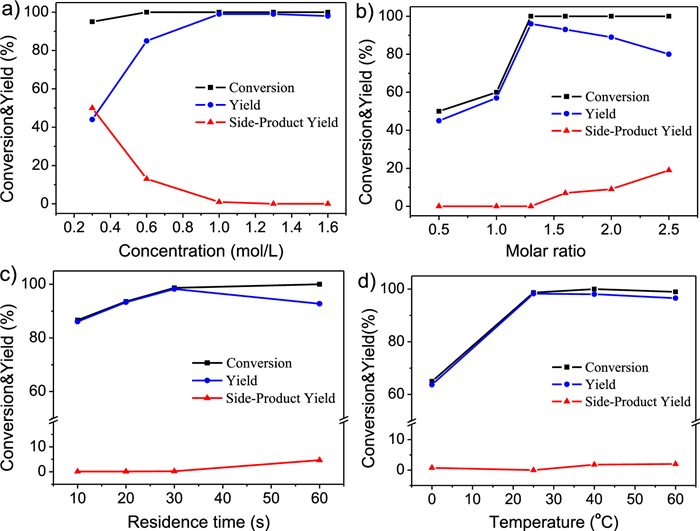
The amount of nitric acid, concentration, reaction temperature, and residence time were also investigated. Initially, we studied the relationship between the concentration of 2 and its conversion and selectivity. As shown in Fig. 3a, the yield gradually increased with the increasing concentration of 2, attainting stability at 1.0 mol/L. Moreover, the increased concentration of 2 decreased the yield of by-product, thereby improving the selectivity of the reaction. The by-product was analyzed by LCMS as a sulphonated product. Based on the above results, we attempted to change the molar ratio of nitric acid to 2 to improve the yield of 3. The flow rate of the sulfuric acid solution was adjusted to adapt to the molar ratio. As shown in Fig. 3b, with an increasing molar ratio of nitric acid, the yield reached its maximum value at a molar ratio of 1.3. The yield decreased as the molar ratio continued to increase, resulting in further production of the by-product. As expected, the microreactor exhibits excellent heat transfer efficiency, which allows the reaction to proceed at a precise temperature and over rapid timescales of less than 1 min. The flow rate was adjusted to control the residence time; shorter residence times resulted in a significant decrease in by-products formation (Fig. 3c). The influence of temperature on nitration is shown in Fig. 3d. According to the Arrhenius equation, the reaction rate increases with temperature. When the reaction temperature was below 0 ℃, the conversion was low (65%). After increasing the temperature above 25 ℃, high conversion was achieved within 30 s. Consequently, side reactions caused by uncontrolled temperature during the mixing process can be avoided by performing continuous flow process. Furthermore, we attempted to perform nitration using the LTF chip reactor. The unique geometry channel of the chip reactor promotes mixing, resulting in better reaction performance (Table S7 in Supporting information). Finally, we determined the optimal conditions to be as follows: for 2, concentration = 1.0 mol/L; tR= 5 s; T = 25 ℃; NHNO: N2 = 1.3 in the LTF chip reactor. Under these conditions, a yield of 99% was successfully obtained.
Step 3: Hydrogenation in flow
The reduction of 3 was performed using the Olsen hydrogenation reactor. A schematic of the continuous–flow system includes a preheating coil, packed–bed reactor, and a gas–liquid separator (Fig. 4). The CH2Cl2 solution of 3 was delivered to the micromixer using HPLC pump, where it was preheated to the reaction temperature and mixed with hydrogen. The reaction proceeded in a packed–bed reactor filled with 5% Pd/C as the catalyst. Following the reaction, the effluent flows into the liquid–gas separator and a back pressure regulator (BPR) to control the reaction pressure. After stabilizing the reaction system, samples were collected from the bottom of the gas–liquid separator for HPLC analysis. The reaction time was controlled by varying the flow rates of the mixed solvent. The flow rate of hydrogen was steadily controlled at a specific value using the mass flow controller (MFC).

The experimental parameters were optimized by varying the residence time and reaction temperature. As shown in Table 2, a stable conversion is maintained at temperatures of 30 ℃ and 60 ℃, with a gradual increase in the flow rate of 3 but a slight decrease in yield, indicating that an extended residence time promotes the formation of 4 (Table 2, entries 1–5). Furthermore, the conversion and yield tended to increase with increasing temperature (Table 2, entries 3, 7–9), and fully conversion of the reaction could be achieved at 40 ℃. Then, the effect of pressure on yield was continuously studied in the packed–bed reactor. The reaction achieved full conversion at a pressure of 2 MPa (Table 2, entry 11). The hydrogen flow during continuous hydrogenation may shorten the residence time and intensify the gas–liquid mass transfer by increasing the turbulence, which strongly influences the conversion and selectivity of the reaction [36]. However, in this case, an increase in the gas flow rate did not cause any obvious changes in conversion (Table 2, entries 3 and 6); therefore, we believe that the gas–liquid phase has reached full mixing and that there was considerable overdosing of hydrogen. Finally, optimal hydrogenation conditions were obtained as follows: T = 60 ℃; QA = 0.8 mL/min; QB = 40 sccm and P = 2 MPa.
Step 4: Addition reaction in flow
After investigating the hydrogenation conditions, the reaction conditions for the addition reaction of 4 were optimized (Fig. 5). 4 (in toluene) and DMF–DMA (in toluene) were loaded through inlets A and B, respectively, and mixed in a simple T–mixer before being introduced into a PTFE coil reactor.

To obtain optimized reaction conditions, the effects of concentration, coil diameter, reaction temperature, and residence time were investigated. When the concentration of 4 was increased from 0.09 mol/L to 0.47 mol/L, the yield increased to 96% (Fig. 6a); however, continued increase of the concentration of 4 decreases solubility, which was not conducive to the stable operation of the continuous flow system. Next, when maintaining a constant Reynold number during the reaction, the effect of different coil diameters on the reaction was investigated. Five different coil diameters were applied for the addition reaction with same residence time (5 min) and the same Reynolds number (58.34). As the microreactor diameter decreased, the yield increased, indicating that an inner diameter of 0.5 mm resulted in improved mass and heat transfer (Fig. 6b). Continuing to reduce the inner diameter increases the pressure drop, which is not conducive to the reagent transportation. Studying the effects of residence time on the reaction showed that the yield was increased drastically in the residence time range of 1 min to 10 min. Maximum yield (99%) was achieved at a residence time of 10 min (Fig. 6c). Further research demonstrated that continuing to extend the residence time did not improve the yield. Typically, increasing the temperature increases the reaction rate and shortens the reaction time. Increasing the temperature from 70 ℃ to 150 ℃, caused the yield to significantly increase, reaching 92% at 130 ℃ (Fig. 6d); however, further increasing the temperature did not significantly increase the yield. Therefore, the optimum reaction condition of this step was determined as follows: for 4, concentration = 0.47 mol/L; tR = 10 min; T = 130 ℃.

Step 5: Cyclization in flow
After having successfully established a reliable flow process for the synthesis of 5, the reaction conditions for the cyclization reaction of 5 were optimized (Fig. 7). 5 and 3-aminophenylacetylene (6) were dissolved in acetic acid and mixed in a T–mixer in a PTFE coil reactor, and before finally flowing out through the BPR. After the system was stabilized, the solution was collected, and the product was processed and analyzed. The cyclization process parameters, including concentration, reactant equivalents, reaction temperature and residence time were systematically investigated.

In general, a high concentration of reactant was found to accelerate the reaction and reduce waste. When the concentration of 5 was increased from 0.1 mol/L to 0.8 mol/L, the yield and conversion gradually increased to a maximum value. The yield and conversion will not change when the concentration continues to increase to 1.0 mol/L (Fig. 8a), indicating that higher concentrations promote the conversion of intermediates to products. After determining the concentration of 5, the effects of different equivalents of 3-aminophenylacetylene (6) on the reaction were investigated. Changes in molar ratio were achieved by adjusting the flow rate of each pump, showing that the reduction of 6 led to incomplete conversion of 5; in contrast, increasing the amount of 6 had almost no effect on the yield (Fig. 8b). Temperature was found to have the most significant effect on the reaction. When the temperature was increased from 70 ℃ to 150 ℃, the yield and conversion improved to 71% and 90%, respectively. Increasing the temperature obviously improved the conversion and yield (Fig. 8c). Too short residence time result in the incomplete conversion of 5. The yield increased with increasing residence time and remained essentially unchanged above 2 min, indicating that 2 min was suitable residence time to achieve a yield of 86% (Fig. 8d). Finally, the optimum conditions were found to be 150 ℃, N5: N6 = 1:1.5, and 2 min residence time with 0.8 mol/L of 5 to afford Erlotinib in nearly full conversion and 86% yield.

In summary, we successfully developed a new continuous flow process for the synthesis of Erlotinib. Using inexpensive reagents as starting materials, five reaction conversions were performed through five continuous flow units. Each individual step was successfully optimized to afford almost quantitative conversion via continuous flow synthesis. Compared to the conventional batch process, all steps of the continuous flow process considerably better in terms of reaction time and yield (Table 3). Finally, we demonstrated the continuous flow synthesis of Erlotinib with an overall yield of 83% and a total residence time of 25.1 min. Telescoping can be applied to entire process because of the fact that all the synthesis steps were optimized using the continuous flow process in a way that allowed quantitative conversion. In this paper, we treat telescoping as a conceptual conjecture without showing the actual telescoping process. We believe that continuous flow integration with drug synthesis is of great value for drug production.
The authors declare that they have no known competing financial interests or personal relationships that could have appeared to influence the work reported in this paper.
We thank the National Natural Science Foundation of China (Nos. 21878088, 21476077) and Key Projects of Shanghai Science and Technology Commission (No. 18DZ1112703) for financial support.
Supplementary material associated with this article can be found, in the online version, at doi:
F. Bray, M. Laversanne, E. Weiderpass, I. Soerjomataram, Cancer 127 (2021) 3029–3030. doi: 10.1002/cncr.33587
H. Sung, J. Ferlay, R.L. Siegel, et al., CA Cancer J. Clin. 71 (2021) 209–249. doi: 10.3322/caac.21660
J. Dowell, J.D. Minna, P. Kirkpatrick, Nat. Rev. Drug Discov. 4 (2005) 13–14. doi: 10.1038/nrd1612
C. Schettino, M.A. Bareschino, V. Ricci, F. Ciardiello, Expert Rev. Resp. Med. 2 (2008) 167–178. doi: 10.1586/17476348.2.2.167
M.P. Mathew, E. Tan, C.T. Saeui, et al., Bioorg. Med. Chem. Lett. 25 (2015) 1223–1227. doi: 10.1016/j.bmcl.2015.01.060
M.H. Cohen, J.R. Johnson, Y.F. Chen, R. Sridhara, R. Pazdur, Oncologist 10 (2005) 461–466. doi: 10.1634/theoncologist.10-7-461
C. Karunakara, U. Aparna, V. Chandregowda, C.G. Reddy, Anal. Sci. 28 (2012) 305–308. doi: 10.2116/analsci.28.305
D.R. Rao, R.N. Kankan, Patent, WO2010109443A1, 2014.
A. Gavenda, P. Vraspir, A. Canavesi, et al., Patent, WO2010005924A1, 2009.
B. Murugesan, A. Vempali, S. Sathyanarayana, R.K. Thaper, M. Prasad, Patent, US2010136116A1, 2012.
A.K. Chaturvedi, S. Singh, B. Panda, Patent, US2022235014A1, 2022.
L. Barghi, A. Aghanejad, H. Valizadeh, J. Barar, D. Asgari, Adv. Pharm. Bull. 2 (2012) 119–122.
B. Marvania, P.C. Lee, R. Chaniyara, et al., Bioorg. Med. Chem. 19 (2011) 1987–1998. doi: 10.1016/j.bmc.2011.01.055
L. Buglioni, F. Raymenants, A. Slattery, S.D.A. Zondag, T. Noël, Chem. Rev. 122 (2022) 2752–2906. doi: 10.1021/acs.chemrev.1c00332
R.L. Hartman, K.F. Jensen, Lab Chip 9 (2009) 2495–2507. doi: 10.1039/b906343a
J. Wegner, S. Ceylan, A. Kirschning, Chem. Commun. 47 (2011) 4583–4592. doi: 10.1039/c0cc05060a
V. Chandregowda, G. Venkateswara Rao, G. Chandrasekara Reddy, Org. Process Res. Dev. 11 (2007) 813–816. doi: 10.1021/op700054p
V. Chandregowda, G.V. Rao, G.C. Reddy, Heterocycles 38 (2007) 39–48.
Y. Mao, C. Zhou, C. Wang, Z. Xin, Chin. Chem. Lett. 34 (2023) 108061. doi: 10.1016/j.cclet.2022.108061
J. Ren, M. Wu, K. Dong, et al., Chin. Chem. Lett. 34 (2023) 107694. doi: 10.1016/j.cclet.2022.07.037
J. Ren, K. Niu, M. Wu, Y. Cheng, G. Shi, Chin. Chem. Lett. 34 (2023) 107985. doi: 10.1016/j.cclet.2022.107985
H. Lv, J. Wang, Z. Shu, et al., Chin. Chem. Lett. 34 (2023) 107710. doi: 10.1016/j.cclet.2022.07.053
W. Luo, F. Liu, Y. Guo, et al., Chin. Chem. Lett. 34 (2023) 107636. doi: 10.1016/j.cclet.2022.06.059
S. Bagi, S. Yuan, S. Rojas-Buzo, Y. Shao-Horn, Y. Román-Leshkov, Green Chem. 23 (2021) 9982–9991. doi: 10.1039/D1GC02824C
H. Lin, C. Dai, T.F. Jamison, K.F. Jensen, Angew. Chem. Int. Ed. 56 (2017) 8870–8873. doi: 10.1002/anie.201703812
D.R. Snead, T.F. Jamison, Angew. Chem. Int. Ed. 54 (2015) 983–987. doi: 10.1002/anie.201409093
J. Morvan, T. McBride, I. Curbet, et al., Angew. Chem. Int. Ed. 60 (2021) 19685–19690. doi: 10.1002/anie.202106410
M.G. Russell, T.F. Jamison, Angew. Chem. Int. Ed. 58 (2019) 7678–7681. doi: 10.1002/anie.201901814
M.B. Plutschack, B. Pieber, K. Gilmore, P.H. Seeberger, Chem. Rev. 117 (2017) 11796–11893. doi: 10.1021/acs.chemrev.7b00183
M. Movsisyan, E.I.P. Delbeke, J.K.E.T. Berton, et al., Chem. Soc. Rev. 45 (2016) 4892–4928. doi: 10.1039/C5CS00902B
B. Gutmann, D. Cantillo, C.O. Kappe, Angew. Chem. Int. Ed. 54 (2015) 6688–6728. doi: 10.1002/anie.201409318
R. Porta, M. Benaglia, A. Puglisi, Org. Process Res. Dev. 20 (2016) 2–25. doi: 10.1021/acs.oprd.5b00325
J. Liao, S. Zhang, Z. Wang, et al., Green Synth. Catal. 1 (2020) 121–133. doi: 10.1016/j.gresc.2020.08.001
J. Yan, W. Ni, K. You, et al., Res. Chem. Intermed. 47 (2021) 3569–3582. doi: 10.1007/s11164-021-04502-x
M. Haouas, S. Bernasconi, A. Kogelbauer, R. Prins, Phys. Chem. Chem. Phys. 3 (2001) 5067–5075. doi: 10.1039/b103821b
Y. Xia, B. Ye, M. Liu, M. Jiang, F. Chen, Org. Process Res. Dev. 26 (2022) 2656–2664. doi: 10.1021/acs.oprd.2c00100

Figure 3 (a) Effect of the concentration of 2 on nitration. Condition: T = 25 ℃, NHNO3: N2 = 1.3, tR = 1 min; (b) Effect of molar ratio on nitration. Condition: T = 25 ℃, C2 = 1.0 mol/L, tR = 1 min; (c) Effect of residence time on nitration. Condition: T = 25 ℃, C2 = 1.0 mol/L, NHNO3: N2 = 1.3; (d) Effect of temperature on nitration. Condition: C2 = 1.0 mol/L, NHNO3: N2 = 1.3, tR = 30 s.

Figure 6 (a) Effect of the concentration of 4 on the reaction. Condition: T = 130 ℃, NDMF-DMA: N4 = 1.5, tR = 5 min, d = 0.5 mm; (b) Effect of inner diameter on the reaction. Condition: T = 130 ℃, C4 = 0.4 mol/L, NDMF–DMA: N4 = 1.5, tR = 5 min; (c) Effect of residence time on the reaction. Condition: T = 130 ℃, C4 = 0.47 mol/L, NDMF–DMA: N4 = 1.5, tR = 5 min, d = 0.5 mm; (d) Effect of temperature on the reaction. Condition: C4 = 0.4 mol/L, NDMF–DMA: N4 = 1.5, tR = 10 min, d = 0.5 mm.

Figure 8 (a) Effect of the concentration of 5 on cyclization. Condition: T = 130 ℃, N6: N5 = 1.5, tR = 10 min; (b) Effect of molar ratio on cyclization. Condition: T = 130 ℃, C5 = 0.1 mol/L, tR = 10 min; (c) Effect of temperature on cyclization. Condition: C5 = 0.1 mol/L, N6: N5 = 1.5, tR = 10 min; (d) Effect of residence time on cyclization. Condition: T = 150 ℃, C5 = 0.8 mol/L, N6: N5 = 1.5.

 扫一扫看文章

扫一扫关注我们
 DownLoad:


 下载:
下载:


 下载:
下载: