Department of Chemistry, College of Chemistry, Nankai University, Tianjin 300071, China
b.
State Key Laboratory of Separation Membranes and Membrane Processes, School of Environmental Science and Engineering, Tiangong University, Tianjin 300387, China
c.
Key Laboratory of Advanced Energy Materials Chemistry (MOE), Frontiers Science Center for New Organic Matter and Renewable Energy Conversion and Storage Center (RECAST), College of Chemistry, Nankai University, Tianjin 300071, China
d.
Haihe Laboratory of Sustainable Chemical Transformations, Tianjin 300192, China
Received Date:
27 May 2023 Accepted Date:
19 June 2023 Revised Date:
14 June 2023 Available Online:
15 May 2024
Abstract:
Nanoplastics (NPs) in aqueous environment have become a category of emerging pollutants on account of their potential risks to both human health and environment. The detection of NPs is a great challenge due to the lack of sensitive and selective sensing materials with fast response time and wide sensing range of particle sizes. Herein, a Tb-based coordination polymer has been synthesized for luminescent detection of nanopolystyrene with different particle sizes in aqueous solutions, showing a low limit of detection, fast response time within 10 s and high selectivity in the presence of other plastics. The “turn-on” sensing mechanism is studied in detail. This work provides a facile method for the fast detection of NPs.
Normally, plastics are lightweight materials with excellent thermodynamic and mechanical properties, which are one of the most important scientific advances in human history and have been extensively used worldwide in daily life [1–3]. However, plastics can be degraded into microplastics (MPs, 1–5 mm in size) and nanoplastics (NPs) (<1 µm in size) under exceptional circumstances, such as oxidation, photodegradation, hydrolytic degradation and mechanical disintegration [4–6]. At present, MPs and NPs, including polyethylene (PE), polypropylene (PP), polystyrene (PS), polyvinyl chloride (PVC), polyethylene terephthalate (PET), have been widely distributed in air, aquatic environment, soil and biological system [7,8]. Due to their adsorbability, bioaccumulation and toxicity, MPs, NPs and their secondary products with varied sizes and morphology have been found in human foods, faces, blood and even lungs recently [9–12] and are potentially harmful for the organisms and even human health [13,14]. Compared to MPs, NPs could adsorb hydrophobic pollutants such as polycyclic aromatic hydrocarbons and perfluorinated compounds, which will increase the toxicity and cross cytomembrane more easily. NPs can also disturb protein synthesis, reduce cell activity, and even damage the mitochondria of liver and lung cells [15,16] and hence are necessary to be quantitatively detected. Currently, it is highly challenging to detect NPs quantitatively in freshwater or marine ecosystems due to their small sizes and high penetrability [17,18].
Generally, analysis methods such as gas chromatography-mass spectrometer (GC-MS), inductively coupled plasma (ICP), scanning electron microscope (SEM), infrared spectroscopy (IR), Raman spectroscopy and combinations of above characterizations have been applied for the detection of types, morphology, and concentrations of MPs and NPs [19–21]. However, these methods usually need complex pretreatment of the sample, long analysis time, large equipment, and NPs with sizes smaller than 200 nm can hardly be detected by most traditional analytical methods [22–24]. Nanosized PS particles are typical NPs that have raised attention owing to their wide distribution, aromatic structures and damage to cells [9,17,18], and hence have been selected as targeted species in this work. To detect nanosized PS, lanthanide coordination polymers are promising sensing materials based on their sharp emissions and large Stokes shifts. The selectivity can be fine-tuned by well-matching in both structures and energy levels with the target species [25–27]. Importantly, the response time is distinctly shorter in comparison with other methods [28–30]. To date, applying lanthanide coordination polymer as luminescent sensors for NPs has not been studied.
Herein, a one-dimensional coordination polymer, [Tb2(FDA)2(H2O)10]·FDA·6H2O (Tb-FDA; H2FDA = 2,5-furandicarboxylic acid), was synthesized as a sensing material for NPs. Tb-FDA has excellent water stability in a wide pH range from 4 to 11, and hence is suitable for sensing application in aqueous solution. Tb-FDA exhibited “turn-on” luminescence for nanosized PS with particle sizes of 40, 100 and 200 nm in aqueous solutions, due to the overlap between the emission spectrum of nano PS and the excitation spectrum of Tb-FDA, which can influence the energy transfer process. The limit of detection is 16.72 µg/L in artificial seawater and 5.83 µg/L in deionized water. The sensing mechanism for nano PS detection is attributed to the energy transfer of PS to energy levels of ligand of Tb-FDA. It is noted that Tb-FDA can be recovered by a facile evaporation crystallization process.
Tb-FDA is crystallized in triclinic space group P-1 (Table S1 in Supporting information). The asymmetric unit of Tb-FDA contains the following crystallographically independent components: two Tb3+ ions, two coordinated FDA2− and ten coordinated water molecules, a FDA2− counterion and six lattice water molecules. Each Tb3+ ion is nine-coordinate in a spherical capped square antiprism environment, completed by four oxygen atoms from four carboxylate groups of two FDA2− anions, and five oxygen atoms from five water molecules (Fig. 1a). Tb3+ ions are bridged by carboxylate groups of FDA2− to form a chain (Fig. 1b). The chains are connected by π ···π interactions of the coordinated FDA2− to form a layer (Fig. 1c). The layers are further connected by FDA2− counter anions by π···π interactions into a 3D supramolecular structure (Fig. 1d).
Figure 1
Figure 1.
(a) Coordination geometry of Tb3+ center in Tb-FDA. (b) 1D chain of Tb-FDA. (c) 2D layer of Tb-FDA composed of π···π stacked chains. (d) 3D supramolecular framework composed of 2D layers and FDA2− counter anions. Atom codes: Tb (green), C (gray) and O (red).
Powder X-ray diffraction (PXRD) pattern showed that diffraction peaks of Tb-FDA are in good agreement with the simulated from single-crystal data, confirming the phase purity of Tb-FDA. In addition, the PXRD and FT-IR spectra of Tb-FDA after soaking in aqueous solutions with pH values of 4–11 remained unchanged, indicating that Tb-FDA is highly stable to maintain its crystallinity (Figs. S1 and S2 in Supporting information).
Thermogravimetric analysis (TGA) of Tb-FDA was measured in range of 40–800 ℃ (Fig. S3 in Supporting information). A mass loss of 26.85% from 40 ℃ to 260 ℃ is due to the loss of coordinated water and lattice water (calcd. 26.95%). Further heating induced sharp weight losses, on account of the decomposition of the coordination structure.
Solid-state luminescent spectrum of Tb-FDA was recorded at room temperature (Fig. S4 in Supporting information). Under excitation at 254 nm, four characteristic emissions were observed at 488, 542, 582 and 618 nm, which originate from the 5D4 → 7FJ (J = 6, 5, 4 and 3) transitions of Tb3+ ions. The strongest emission is at 542 nm [31,32]. The excitation and emission spectra (Fig. S5 in Supporting information) and the stability of the luminescence (Figs. S6 and S7 in Supporting information) of Tb-FDA in deionized water were measured. The strongest emission is at 544 nm, which is very similar to the emission of solid-state spectrum. The excitation and emission spectra of 40, 100, and 200 nm PS (Fig. S8 in Supporting information) in deionized water were recorded at room temperature. The maximum excitation wavelengths of the PS with 40, 100, 200 nm sizes are all at 254 nm, and the maximum emission wavelengths of them are all at 308 nm.
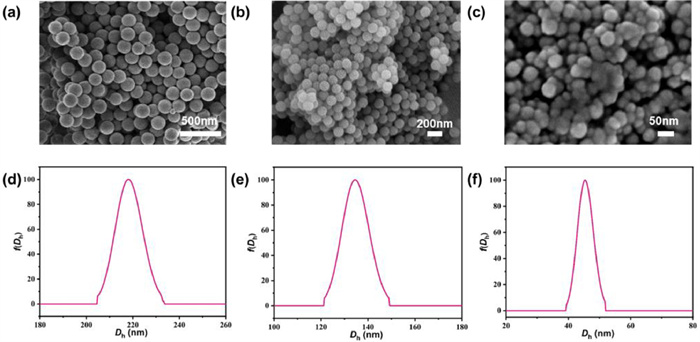
Scanning electron microscope (SEM) confirms that PS nanoparticles exist individually and distribute evenly. The morphology of PS is regular sphere and the sizes of nano PS with different nanoparticle are about 40, 100, and 200 nm, respectively (Figs. 2a-c). The UV–vis spectra of PS were shown in Fig. S9 (Supporting information). The UV absorption shows a double wide peak at 234 nm and 259 nm in aqueous solution.
Figure 2
Figure 2.
PS nanoparticles with particle sizes of (a) 200 nm, (b) 100 nm and (c) 40 nm. Hydrodynamic diameter distribution of PS nanoparticles with particle sizes of (d) 200 nm, (e) 100 nm and (f) 40 nm.
Dynamic light scattering (DLS) showed hydrodynamic size distributions of nano PS in aqueous solutions (Figs. 2d-f), whose hydrodynamic diameter are mainly about 218, 134, 43 nm, respectively, which are slightly larger than the sizes of PS nanoparticles observed by the SEM.
To verify the effect of Tb-FDA for the detection of PS nanoparticles in different aqueous solutions, deionized water and artificial seawater [33] were used respectively.
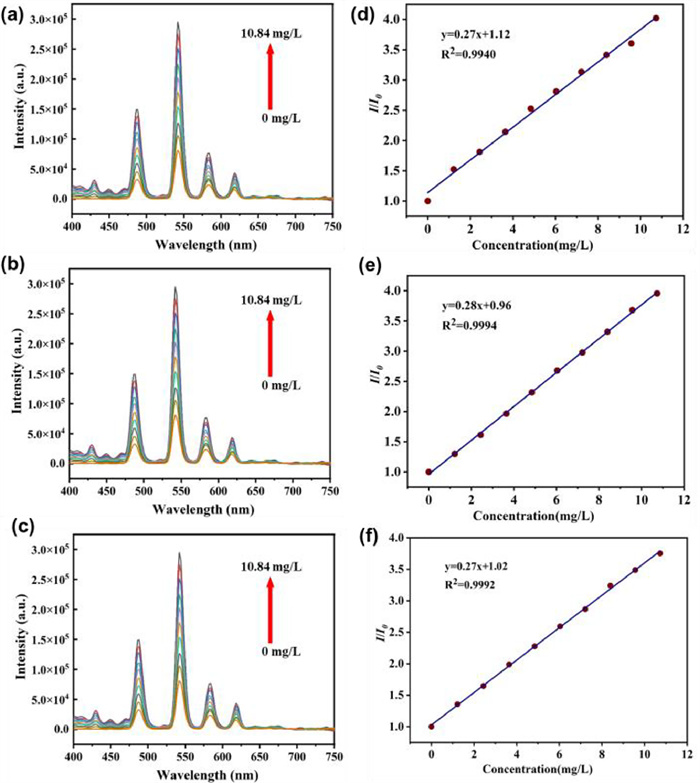
For the detection of PS nanoparticles, the luminescent intensities of Tb-FDA were recorded with adding PS nanoparticles aqueous solutions dropwise. The luminescent intensities gradually increased with increasing the concentration of PS in deionized water or artificial seawater (Fig. 3 and Figs. S10–S12 in Supporting information). Here we take the titration of 100 nm PS nanoparticles in deionized water as an example. As the concentration increases from 0 to 10 mg/L, the enhancement of the luminescence of Tb-FDA was observed. Linear plots based on the emission at 544 nm and concentration of nano PS can be fitted well by I/I0 = 0.96 + 0.28[C]. The linear plots towards PS with 40 and 200 nm are fitted well by I/I0 = 1.12 + 0.27[C] and 1.02 + 0.27[C], respectively. As the concentration further increases from 0 to 250 mg/L, the data can be fitted well by I/I0 = 3.1 + 0.27[C]. The linear plots towards PS with 40 and 200 nm are fitted well by I/I0 = 2.8 + 0.27[C] and 2.5 + 0.26[C], respectively. The limits of detection (LODs) of Tb-FDA towards PS were calculated by the equation LOD = 3Sd/slope, where Sd is the standard deviation of luminescent intensity at 544 nm of the blank signal for 20 times [34]. The slopes were calculated from the low-concentration luminescent intensities. The LODs are 5.83, 6.35 and 6.17 µg/L in deionized water for 40, 100, and 200 nm nano PS, respectively. Titration results in artificial seawater are similar as those in deionized water, with the LODs of 16.72, 17.25 and 16.94 µg/L for 40, 100 and 200 nm, respectively.
Figure 3
Figure 3.
Emission spectra of Tb-FDA dispersed in deionized water added nano PS with (a) 40 nm, (b) 100 nm, (c) 200 nm and fitting linear plots at 544 nm of Tb-FDA towards nano PS with (d) 40 nm, (e) 100 nm, (f) 200 nm in deionized water at the concentrations from 0 to 10 mg/L.
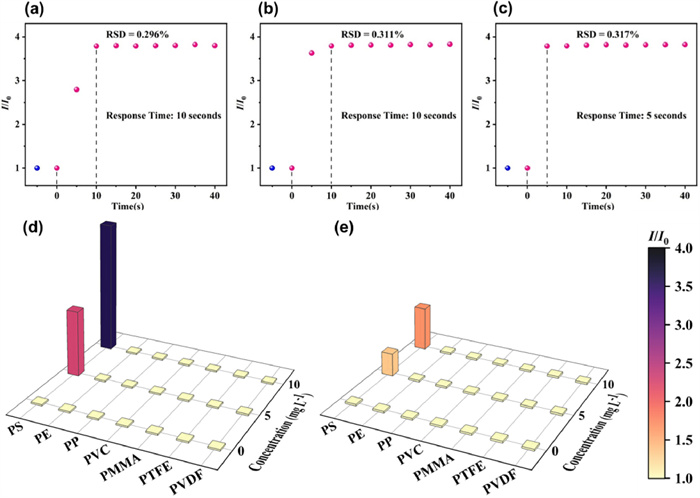
In practical applications, response time is one of indicators to evaluate the sensing performance [35]. The response times of Tb-FDA for PS detection were measured in deionized water (Figs. 4a-c) and in artificial seawater (Fig. S13 in Supporting information), which are all less than 10 s.
Figure 4
Figure 4.
The response times of Tb-FDA for detecting PS with particle sizes of (a) 40 nm, (b) 100 nm and (c) 200 nm in deionized water. Selectivity of Tb-FDA for PE, PP, PVC, PMMA, PTFE and PVDF (d) in deionized water and (e) in artificial seawater.
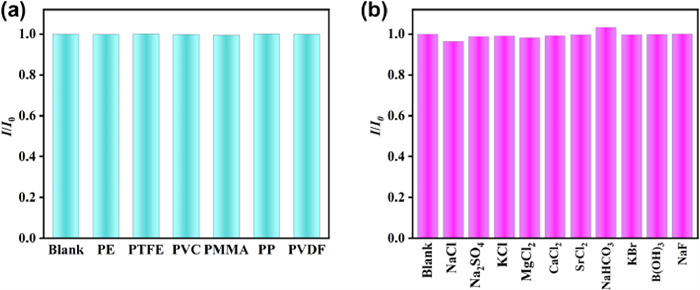
The interferences from other MPs or NPs (PE, PP, PVC, PMMA, PVDF, PTFE) are often present with PS particles (Fig. S14 in Supporting information). Therefore, selectivity tests of Tb-FDA toward above plastics in deionized water and artificial seawater were conducted. From Figs. 4d, e and 5a, the presence of other plastics in deionized water or artificial seawater does not change the luminescence, demonstrating that PS nanoparticles can be specifically detected by Tb-FDA.
Figure 5
Figure 5.
Luminescent intensities of Tb-FDA in the present of different (a) NPs including PE, PTFE, PVC, PMMA, PP and PVDF and (b) soluble solids including NaCl, Na2SO4, KCl, MgCl2, CaCl2, SrCl2, NaHCO3, KBr, B(OH)3 and NaF.
It is also important to test effects of the soluble chemicals, such as NaCl, Na2SO4, KCl, MgCl2, CaCl2, SrCl2, NaHCO3, KBr, B(OH)3 and NaF in aqueous solution, for the detection of PS. The luminescent intensity at 544 nm is not obviously affected by above soluble chemicals (Fig. 5b), suggesting Tb-FDA with superior selectivity and highly anti-interference capability for PS detection.
To prove the practicability of sensing materials, recyclability and stability under various conditions are important factors. The recycling performances in different solutions of Tb-FDA were investigated by evaporation of liquid supernatant from deionized water, artificial seawater, and saturated sodium chloride solutions. The PXRD patterns (Fig. S15 in Supporting information), IR spectra (Fig. S16 in Supporting information) and the EDS mapping (Fig. S17 in Supporting information) showed that the recycled Tb-FDA crystallized from different aqueous solutions are the same to the original Tb-FDA.
The luminescent intensities of Tb-FDA after recycling are studied to prove recyclability. After sensing experiments, suspensions of the Tb-FDA with PS nanoparticles were heated at 40 ℃ and filtered until PS nanoparticles aggregated into visible white floc spheres. The crystals of Tb-FDA were precipitated from the clear solution at 40 ℃ and then washed with deionized water several times with a yield of about 80% with high phase purity (Fig. S18 in Supporting information). The luminescent intensities were not significantly changed after five continuous cycles (Fig. S19 in Supporting information). To the best of our knowledge, it is the first time for the study of lanthanide coordination polymer to be recovered by crystallization in different aqueous solutions.
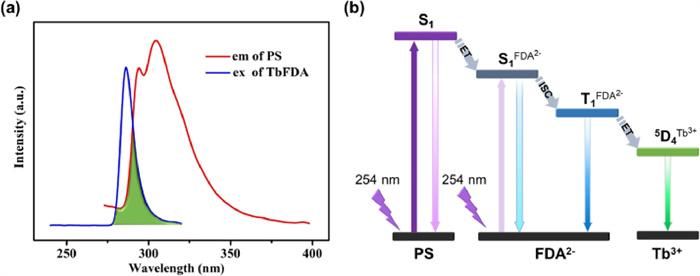
The sensing mechanism Tb-FDA towards nano PS was investigated in detail [36]. Based on the UV–vis absorption spectrum of H2FDA (Fig. S20 in Supporting information) and the phosphorescence spectrum at 77 K from Gd-FDA (Figs. S21 and 22 in Supporting information), the singlet-state energy level (S1) is 37,736 cm−1 and the triplet energy level (T1) of the antenna is 28,169 cm−1. The energy gap ΔE is larger than 5000 cm−1 and hence the intersystem crossing process in Tb-FDA is effective [37]. The emission spectrum of nano PS and the excitation spectrum of Tb-FDA overlap from 275 nm to 320 nm (Fig. 6a), indicating that the energy from the emission of nano PS can transfer to the singlet-state level of the ligand and then to Tb3+ to enhance emission of Tb3+ centers. Moreover, the lifetime decay of Tb-FDA was monitored at 544 nm. As shown in Figs. S23–S25 (Supporting information), there are no obvious changes after adding PS nanoparticles, revealing the missing of dynamic quenching process [38]. This result is also consistent with the fast response time. The energy transfer process of Tb-FDA for detecting PS is shown in Fig. 6b.
Figure 6
Figure 6.
(a) Emission spectrum of nano PS at 254 nm and excitation spectrum of Tb-FDA. (b) Energy transfer process of Tb-FDA towards nano PS.
In summary, a Tb-based coordination polymer Tb-FDA with high aqueous stability was successfully synthesized and applied for detecting PS nanoparticles with tiny particle sizes even to 40 nm. Tb-FDA exhibited turn-on luminescence with excellent sensitivity and quantitative detection ability toward nanosized PS with different sizes in aqueous solutions without the interference from other plastics or common soluble solids in water. The LODs are 16.72 µg/L in the artificial seawater and 5.83 µg/L in deionized water with fast response times within 10 s. Tb-FDA can be recovered with high yield after luminescent detection by facile evaporation crystallization. The sensing mechanism of the turn-on luminescence can be attributed to the energy transfer from PS to Tb-FDA. This study provides an effective way to detect PS nanoparticles for water safety.
Declaration of competing interest
The authors declare that they have no known competing financial interests or personal relationships that could have appeared to influence the work reported in this paper.
Acknowledgments
This work was supported by the National Natural Science Foundation of China (Nos. 22261132509, 21931004, and 21971123), the research funding provided by Cangzhou Institute of Tiangong University (No. TGCYY-Z-0101) and the Ministry of Education of China (No. B12015).
Supplementary materials
Supplementary material associated with this article can be found, in the online version, at doi:10.1016/j.cclet.2023.108718.
[1]
R.C. Thompson, Y. Olsen, R.P. Mitchell, et al., Science 304 (2004) 838. doi: 10.1126/science.1094559
[2]
A. Stubbins, K.L. Law, S.E. Muñoz, T.S. Bianchi, L. Zhu, Science 373 (2021) 51–55. doi: 10.1126/science.abb0354
[3]
L.E. Revell, P. Kuma, E.C. Le Ru, W.R.C. Somerville, S. Gaw, Nature 598 (2021) 462–467. doi: 10.1038/s41586-021-03864-x
[4]
M. Macleod, H. Peter, H. Arp, M.B. Tekman, A. Jahnke, Science 373 (2021) 61–65. doi: 10.1126/science.abg5433
[5]
I.B. Jâms, F.M. Windsor, T. Poudevigne-Durance, S.J. Ormerod, I. Durance, Nat. Commun. 11 (2020) 1594. doi: 10.1038/s41467-020-15406-6
[6]
N.B. Hartmann, T. Hüffer, R.C. Thompson, et al., Environ. Sci. Technol. 53 (2019) 1039–1047. doi: 10.1021/acs.est.8b05297
[7]
J. Gigault, A.T. Halle, M. Baudrimont, et al., Environ. Pollut. 235 (2018) 1030–1034. doi: 10.1016/j.envpol.2018.01.024
[8]
R. Lehner, C. Weder, A. Petri-Fink, B. Rothen-Rutishauser, Environ. Sci. Technol. 53 (2019) 1748–1765. doi: 10.1021/acs.est.8b05512
[9]
J. Zhang, L. Wang, L. Trasande, K. Kannan, Environ. Sci. Technol. Lett. 8 (2021) 989–994. doi: 10.1021/acs.estlett.1c00559
[10]
Z. Yan, Y. Liu, T. Zhang, et al., Environ. Sci. Technol. 56 (2022) 414–421. doi: 10.1021/acs.est.1c03924
[11]
H.A. Leslie, M.J.M. van Velzen, S.H. Brandsma, et al., Environ. Int. 163 (2022) 107199. doi: 10.1016/j.envint.2022.107199
[12]
L.C. Jenner, J.M. Rotchell, R.T. Bennett, et al., Sci. Total Environ. 831 (2022) 154907. doi: 10.1016/j.scitotenv.2022.154907
[13]
M. Forte, G. Iachetta, M. Tussellino, et al., Toxicol. Vitro 31 (2016) 126–136. doi: 10.1016/j.tiv.2015.11.006
Figure 1
(a) Coordination geometry of Tb3+ center in Tb-FDA. (b) 1D chain of Tb-FDA. (c) 2D layer of Tb-FDA composed of π···π stacked chains. (d) 3D supramolecular framework composed of 2D layers and FDA2− counter anions. Atom codes: Tb (green), C (gray) and O (red).
Figure 2
PS nanoparticles with particle sizes of (a) 200 nm, (b) 100 nm and (c) 40 nm. Hydrodynamic diameter distribution of PS nanoparticles with particle sizes of (d) 200 nm, (e) 100 nm and (f) 40 nm.
Figure 3
Emission spectra of Tb-FDA dispersed in deionized water added nano PS with (a) 40 nm, (b) 100 nm, (c) 200 nm and fitting linear plots at 544 nm of Tb-FDA towards nano PS with (d) 40 nm, (e) 100 nm, (f) 200 nm in deionized water at the concentrations from 0 to 10 mg/L.
Figure 4
The response times of Tb-FDA for detecting PS with particle sizes of (a) 40 nm, (b) 100 nm and (c) 200 nm in deionized water. Selectivity of Tb-FDA for PE, PP, PVC, PMMA, PTFE and PVDF (d) in deionized water and (e) in artificial seawater.
Figure 5
Luminescent intensities of Tb-FDA in the present of different (a) NPs including PE, PTFE, PVC, PMMA, PP and PVDF and (b) soluble solids including NaCl, Na2SO4, KCl, MgCl2, CaCl2, SrCl2, NaHCO3, KBr, B(OH)3 and NaF.


 DownLoad:

 下载:
下载:


