Key Laboratory of Advanced Energy Materials Chemistry (Ministry of Education), Engineering Research Center of High-efficiency Energy Storage (Ministry of Education), College of Chemistry, Nankai University, Tianjin 300071, China
b.
Haihe Laboratory of Sustainable Chemical Transformations, Tianjin 300192, China
* Corresponding authors at: Key Laboratory of Advanced Energy Materials Chemistry (Ministry of Education)
Engineering Research Center of High-efficiency Energy Storage (Ministry of Education)
Received Date:
23 April 2023 Accepted Date:
19 June 2023 Revised Date:
30 May 2023 Available Online:
15 November 2023
Abstract:
The rational construction of high-performance and stable electrocatalyst for oxygen evolution reaction (OER) is a prerequisite for efficient water electrolysis. Herein, we develop a broccoli-like Ni3S2@NiFePx (Ni3S2@NFP) catalyst on nickel foam (NF) via a sequential two-step layer-by-layer assembly electrodeposition method. X-ray diffraction, in situ Raman and Fourier-transform infrared spectra have mutually validated the element segregation and phase refusion during OER condition. The reconstruction of double layer Ni3S2@NFP facilitates the formation of the active (oxy)hydroxides, which is modulated by the dual anionic layer with mixed sulfate and phosphate ions. As a result, the obtained Ni3S2@NFP electrode exhibits low overpotential (329 mV) and long-term durability (~500 h) for OER at current density of 500 mA/cm2. Moreover, the self-supported Ni3S2@NFP can act as an efficient and durable anode in alkaline anion exchange membrane water electrolysis device (AEMWE). This work provides a facile and scaled-up strategy to construct self-supported electrocatalyst and emphasizes the crucial role of anions in pre-catalyst reconstruction and enhancing OER performance.
Green hydrogen production by water electrolysis coupled with renewable electricity has been considered as one of the prospective proposals to tackle global energy crisis and environmental pollution [1-3]. Among the mainstream of water electrolysis technologies, alkaline exchange membrane water electrolysis (AEMWE) has received intensive attention considering the compact membrane electrode assembly, high energy conversion efficiency and availability of inexpensive transition metal (Fe, Co, Ni, etc.) based electrodes [4-6]. However, the sluggish kinetic of anodic oxygen evolution reaction (OER) and poor electrode sustainability seriously impact electrolytic efficiency [7,8], leading to additional power consumption and limited lifetime. Thus, exploiting highly active and robust OER electrodes is pivotal for scalable hydrogen production via water electrolysis.
Earth abundant nickel-iron-based catalysts, including oxides [9-11], (oxy)hydroxides [12,13], phosphides [14-16], chalcogenides (sulfides [17,18] and selenides [19,20]), borides [21,22], etc., have been considered as promising non-precious options. Among these, self-supported electrode with uniform amorphous phosphide on porous substrate is considered to be a potential OER electrocatalyst [23]. However, the possible structural stress and/or voids [24], leaching of active sites [25] and abundant bubbles breakage [26] at large current density lead to the degradation of OER performance for long-term operation, which is a stumbling block on the road to industrialization. In a bid to overcome this challenge, a modified layer is demanded on nickel-iron-based phosphide. Nickel sulfide, e.g., Ni3S2, has been found to undergo self-activation and in situ transform into oxysulfide, which can enhance the electrocatalytic activity and stability via electronic structure optimization [27]. Consequently, Ni3S2 maybe a judicious choice to modify nickel-iron-based phosphide.
In this research, we fabricate the Ni3S2@NiFePx (Ni3S2@NFP) self-supported electrode by sequential electrodeposition method. Benefiting from the rough broccoli-like morphology, the Ni3S2@NFP has stronger local electric field strength on the top edge, which improves local concentration of adsorbed hydroxide ions. Furthermore, elemental mapping and line scanning reveal the element segregation and phase refusion of double layer Ni3S2@NFP, leading to the generation of Ni(Fe)OOH layer on the surface with dual anion inserted. During this process, the in situ formed anion-rich modified layer will not only accelerates proton transfer progress, but enhances the catalytic stability by inhibiting the dissolution of the metal active sites. Therefore, the obtained Ni3S2@NFP electrode achieves 500 mA/cm2 at low overpotential of 329 mV and remains highly stable for 500 h in traditional three electrode system. The overall water splitting performance is further evaluated in AEMWE device using Ni3S2@NFP as anode. These results provide a novel perspective to understand the in situ structural reconstruction and anionic regulation effect of electrocatalysts in OER progress.
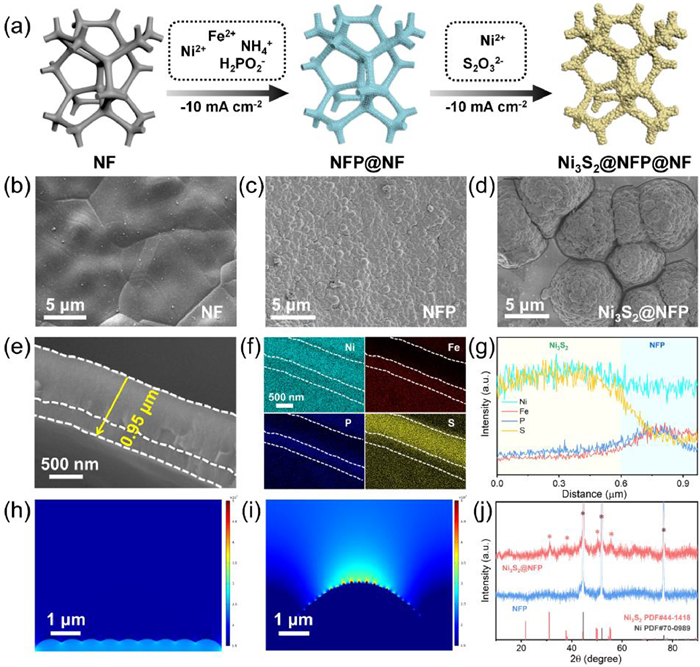
As schematically presented in Fig. 1a, Ni3S2@NFP electrocatalyst was fabricated by a sequential two-step layer-by-layer assembly electrodeposition method on conductive nickel foam (NF) substrate. The morphology and structural characters of NF, NFP, Ni3S2@NFP electrodes were examined by scanning electron microscopy (SEM). Compared to the glazed surface of NF (Fig. 1b), electrodeposited NFP (Fig. 1c and Figs. S1a-c in Supporting information) and Ni3S2 (Figs. S2a-c in Supporting information) exhibit dense nanoparticle morphology. By increasing the deposition time of Ni3S2 on NFP surface, broccoli-like nanoparticles gradually grow (Fig. S3 in Supporting information and Fig. 1d), displaying a rougher surface. According to energy-dispersive spectrometry (EDS) mappings of NFP (Fig. S1d in Supporting information) and Ni3S2@NFP (Fig. S4 and Table S1 in Supporting information), Fe and P content decreased and S element appeared on the surface of Ni3S2@NFP after the secondary deposition, which indicates the existence of top Ni3S2 layer. To further confirm the successful preparation of double layer, cross-section image of Ni3S2@NFP (Figs. 1e and f) and elemental line scanning (Fig. 1g) were performed, which verifies the successful assembly of Ni3S2 on the top of NFP layer and the thickness of the whole coating is about 0.95 µm. The transmission electron microscopy (TEM) images of NFP and Ni3S2 were also collected in Figs. S5 and S6 (Supporting information), respectively. Given the unique morphology, simulations were then performed to explore the morphology-dependent electric field enhancement effect. Results show that the local electric field on the top of broccoli-like nanoparticle with increased curvature (Fig. 1i) is stronger than the monolayer catalyst assembled with compact nanoparticles (Fig. 1h), which may promote the adsorption of hydroxide ions and thereby facilitate surface reconstruction [18,28]. Moreover, the phase was examined by X-ray diffraction (XRD) patterns in Fig. 1j. The characteristic peaks of Ni3S2 are observed in Ni3S2@NFP, while no diffraction signals for NFP can be recognized considering the relatively poor crystallinity [29,30].
Figure 1
Figure 1.
(a) Schematic illustration of the synthesis route for Ni3S2@NFP electrocatalyst. NFP stands for amorphous nickel-iron-based phosphide and NP stands for nickel-based phosphide. SEM images of (b) NF, (c) NFP and (d) Ni3S2@NFP. (e) Cross-section SEM image, (f) EDS mapping and (g) elemental line scanning of Ni3S2@NFP. Simulation results of electric field intensity for the electrodes consisting of (h) compact (representing NFP and Ni3S2) and (i) broccoli-like (representing Ni3S2@NFP) nanoparticles. (j) XRD patterns of NFP and Ni3S2@NFP.
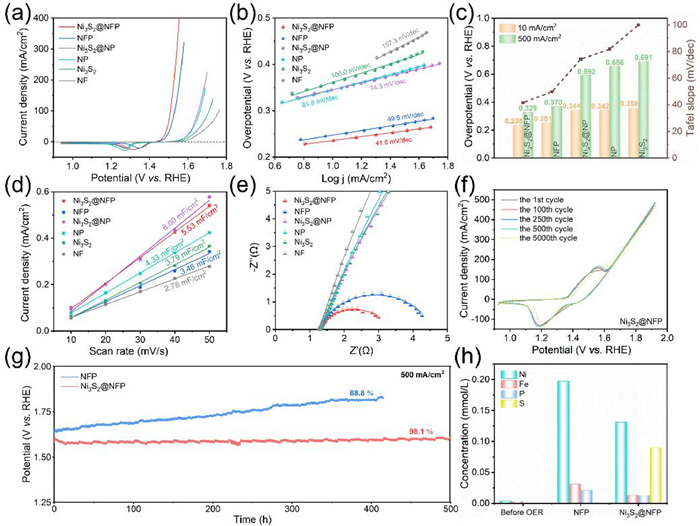
The deposition time for top Ni3S2 and bottom NFP was optimized and the results were shown in Fig. S7 (Supporting information). The optimal Ni3S2@NFP catalyst exhibits superior OER performance with low overpotentials of 235 and 329 mV at 10 and 500 mA/cmgeo2 in contrast to NFP (251 and 370 mV), Ni3S2@NP (344 and 592 mV), NP (342 and 656 mV), Ni3S2 (359 and 691 mV) and bare NF substrate (369 and 791 mV) (Fig. 2a and Fig. S9 in Supporting information). The corresponding Tafel slop values of Ni3S2@NFP (41.6 mV/dec) and NFP (49.8 mV/dec) are significantly lower than Ni3S2@NP (74.3 mV/dec), NP (81.8 mV/dec) and Ni3S2 (100.0 mV/dec) (Fig. 2b), which demonstrates that the incorporation of iron accelerates the kinetics of electrochemical reaction and changes rate-determining step from the first electron transfer process to the second electron transfer process. Meanwhile, the Cdl values of double layer Ni3S2@NFP (5.53 mF/cm2) and Ni3S2@NP (6.00 mF/cm2) are higher than NFP (3.46 mF/cm2), NP (4.33 mF/cm2), Ni3S2 (3.79 mF/cm2) and NF (2.78 mF/cm2), implying more active sites owing to the sequential two-step electrodeposition method (Fig. 2d and Fig. S10 in Supporting information). Electrochemical impedance spectroscopy (EIS) was also carried out to further obtain the electron transfer resistance and reaction kinetics during OER process (Fig. 2e and Fig. S11 in Supporting information). The Ni3S2@NFP displays the lowest Rct of 2.01 Ω, confirming the smallest resistivity on electrode/electrolyte interface and rapid electron charge kinetics. The calculated electrochemical activation energy of Ni3S2@NFP is 29.49 kJ/mol (Fig. S12 in Supporting information), indicating the high intrinsic catalytic activity.
Figure 2
Figure 2.
(a) The LSV curves of different electrodes in 1.0 mol/L KOH with 95% iR-compensation and (b) the corresponding Tafel slopes. (c) The overpotentials at 10 and 500 mA/cm2, along with the Tafel slopes of the catalysts in (a). (d) Double-layer capacitances and (e) Nyquist plots of the catalysts measured at 1.47 V. (f) The accelerated duration test of Ni3S2@NFP with 50 mV/s scan rate. (g) Chronopotentiometry curves of Ni3S2@NFP and NFP at 500 mA/cm2. (h) Inductively coupled plasma-optical emission spectrometry (ICP-OES) results of the electrolyte after OER chronopotentiometry test. The detailed data are listed in Table S3 (Supporting information).
Except OER activity, long-term stability is also an indispensable criterion to evaluate the catalyst performance. Accelerated duration test (Fig. 2f) and chronopotentiometry measurement of Ni3S2@NFP (Fig. 2g) were then performed to assess the electrode stability. In Fig. 2f, the catalytic performance of Ni3S2@NFP slightly improves in first 250 cycles, which can be attributed to the catalyst self-activation under oxidation condition. After that, no obvious decay is observed within 5000 cycles. However, the noticeable decline of NFP is displayed in Fig. S13 (Supporting information). In addition, Ni3S2@NFP electrode displays a slight increase of 30 mV after 500 h operation with a low degradation rate of 60 µV/h at 500 mA/cm2 in Fig. 2g, while NFP electrode increased ~180 mV after only ~400 h with a degradation rate of 450 µV/h. Inductively coupled plasma-optical emission spectrometer (ICP-OES) was applied to analyze the difference of stability between Ni3S2@NFP and NFP by testing the dissolution of metal contents in electrolyte (Fig. 2h). The Ni and Fe concentrations in the electrolyte for Ni3S2@NFP after chronopotentiometry test are both lower than those for single layer NFP, which proves the protective effect of surface deposited Ni3S2. The OER performance and stability comparison of Ni3S2@NFP with those reported in the literature are presented in Fig. S14 and Table S5 (Supporting information).
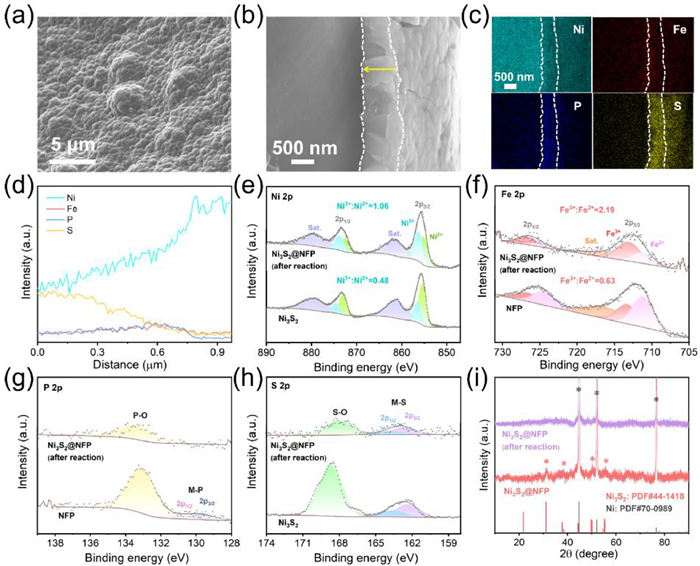
We then conducted systematical characterizations to further explore the origin of high OER performance for Ni3S2@NFP. After OER, the morphology evolution (Fig. 3a and Fig. S15 in Supporting information), visibly intensified superficial Fe, P signals (Fig. S16 and Table S4 in Supporting information) and more even distribution of elements along the fracture surface (Figs. 3b-d) confirm element segregation and phase refusion between the double layer of Ni3S2@NFP. To this end, X-ray photoelectron spectroscopy (XPS) measurements were performed to analyze the chemical composition and elemental state of catalyst surface before and after chronopotentiometry test. The Ni 2p spectra (Fig. 3e) of Ni3S2@NFP after OER presents characteristic peaks at 873.3 eV (Ni 2p1/2) and 855.8 eV (Ni 2p3/2), along with two satellite peaks at 879.2 eV and 861.4 eV [23,31]. After peak deconvolution, the area ratio of Ni3+/Ni2+ is around 1.06, higher than that of Ni3S2 (0.48) before OER. Similarly, Fe 2p spectra (Fig. 3f) can be divided into two sub-peaks at 726.3 eV for Fe 2p1/2 and 712.7 eV for Fe 2p3/2 [32], displaying a higher area ratio of Fe3+/Fe2+ (2.19) than NFP (0.63). These indicate that the metal cations in Ni3S2@NFP are oxidized to higher valence states during in situ reconstruction and act as the real active sites for OER. Furthermore, compared with Ni 2p3/2, Fe 2p3/2 peak shows a preferential tendency towards higher binding energy after reaction, illustrating that the presence of iron site is conducive to the adsorption of reactant OH− and promoting the formation of *OO− intermediate, while nickel site may responsible for the subsequent O2 release [33,34], which is consistent with Tafel slope results. The XPS spectra of Ni3S2@NFP after chronopotentiometry test were also presented in Fig. S18 (Supporting information) for reference. As depicted in Fig. 3g, the original peak of M-P (where M stands for metal) disappears after reaction, implying most of P ions bonding with metal ions are oxidized to phosphate and transfer to the catalyst surface [31]. However, only partial S ions in M-S are oxidized to sulfate (Fig. 3h) and the remaining S may still exist as metal sulfides to inhibit the leaching of metal ions, due to their small solubility-product constants (Ksp) [17,18]. In parallel, according to the XRD pattern (Fig. 3i), the characteristic peaks of Ni3S2 disappear and Ni3S2@NFP becomes amorphous due to reconstruction after chronopotentiometry test [29,35].
Figure 3
Figure 3.
(a) The top-view and (b) cross-section SEM images of Ni3S2@NFP electrode after OER test. (c) EDS mapping and (d) elemental line scanning of the Ni3S2@NFP fracture surface. High resolution XPS spectra of (e) Ni 2p, (f) Fe 2p, (g) P 2p, (h) S 2p for Ni3S2@NFP, NFP and Ni3S2. (i) XRD patterns of Ni3S2@NFP on Ni foam before and after electrolysis.
To monitor the surface dynamic evolution of electrocatalysts during OER, in situ Raman and Fourier-transform infrared (FTIR) analyses are proceeded. As presented in Fig. 4a, the typical bands of Ni3S2 at 302, 322, 350 cm−1 could be detected at open circuit potential (OCP) [36,37]. When the potential increased, these peaks became weaker and then completely disappeared at 1.5 V vs. RHE. Meanwhile, the peak belonging to NiII-O at around 519 cm−1 [38] can be observed at 1.1 V vs. RHE and then be substituted by a pair of bands at 474 cm−1 and 556 cm−1 from 1.4 V vs. RHE, which are attributed to NiIII-O vibrations in γ-NiOOH [39,40]. The broad peak between 850 and 1150 cm−1 is ascribed to *OO− [41]. In addition, two weak peaks at 490 cm−1, 1095 cm−1 and one peak at 981 cm−1 are assigned to the P-O [42] and S-O [43] bonds of the adsorbed phosphate and sulfate, respectively. These confirm that Ni3S2@NFP finally transforms into the Ni(Fe)OOH with phosphate and sulfate layer, in which Ni(Fe)OOH is deemed as the main active site. By contrast, the NiIII-O vibration peaks at 1.4 V vs. RHE are weaker for monolayer NFP (Fig. 4b) and no noticeable NiIII-O characteristic peak can be observed below 1.5 V vs. RHE for Ni3S2 (Fig. 4c), indicating that higher voltage is demanded to trigger the reconstruction. To summarize, two factors facilitate the rapid reconstruction of Ni3S2@NFP: on one hand, the broccoli-like morphology enhances the local electric field, which benefits the adsorption of OH− and thereby promotes surface hydroxylation; on the other hand, the oxidation and leaching of anions for Ni3S2@NFP are significant to promote electrode reconstruction (Fig. S8 in Supporting information), as compared to NiFe alloy and Ni(OH)2@NiFe(OH)x in Fig. S19 (Supporting information). These two inducements synergistically facilitate the formation of high-valence metal active sites. Furthermore, since the signals of anions from Raman spectra are inconspicuous, in situ FTIR measurements were then conducted. As depicted in Fig. 4d, the recorded peaks intensity of H-OH (~1650 cm−1) vibration [44] and surface-adsorbed hydroxide (OHad) (~1220 cm−1) [45] increases with raising applied potential. The clear adsorption signal of PO43− (~1011 cm−1) [46] and SO42− (~1150 cm−1) [47] emerges at 1.40 V and 1.52 V vs. RHE, respectively. The in situ FTIR analyses of NFP and Ni3S2 are also presented in Fig. S20 (Supporting information). Combined with the characterizations and electrochemical tests, the dynamic reconstruction behavior and in situ generated anionic layer on the surface is indispensable to enhance OER activity and stability (Fig. 4e). In addition, the Ni3S2@NFP electrode also presents super-hydrophilicity, as confirmed by the water/bubble contact-angle measurements in Figs. S21–S23 (Supporting information), which makes it a potential anode in AEMWE for efficient alkaline water electrolysis.
Figure 4
Figure 4.
The in situ Raman spectra of (a) Ni3S2@NFP, (b) NFP and (c) Ni3S2. (d) In situ FTIR of Ni3S2@NFP in 1.0 mol/L KOH. (e) Schematic illustration of the layered structure of Ni3S2@NFP after dynamic reconstruction.
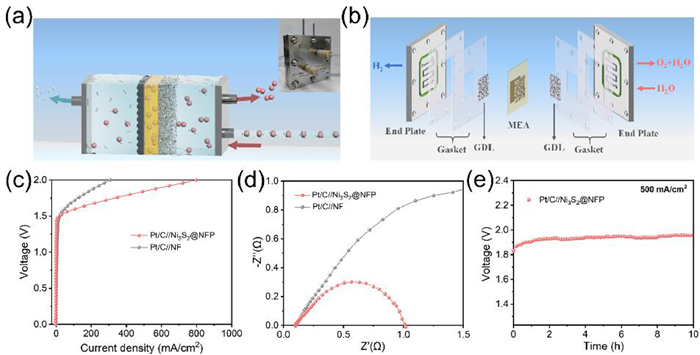
The assembly and operation diagram of AEMWE device are presented in Figs. 5a and b, respectively. According to the polarization curves (Fig. 5c), the Ni3S2@NFP-based AEMWE exhibits high current density of 500 mA/cm2 at an applied cell voltage of 1.84 V. Compared to bare NF, the AEMWE with Ni3S2@NFP anode has higher current density and lower charge transfer resistance under similar operation voltage (Figs. 5c and d). The stability of the Ni3S2@NFP-based AEMWE was confirmed in 10 h test at 500 mA/cm2, where the cell voltage remained largely unchanged (Fig. 5e), implying the potential for practical hydrogen production.
Figure 5
Figure 5.
(a) The schematic diagram and optical picture of AEMWE device. (b) The assembly parts. (c) Polarization curves of Ni3S2@NFP-based AEMWE at 50 ℃ in 1.0 mol/L KOH. (d) Nyquist plots at 1.50 V. (e) Stability test at 500 mA/cm2.
In summary, we have fabricated the broccoli-like Ni3S2@NFP electrocatalyst via a facile and scalable electrodeposition route under room temperature. The as-prepared Ni3S2@NFP electrode possesses high OER activity with a low overpotential of 329 mV and excellent long-term stability of 500 h at 500 mA/cm2. The outstanding OER performance of Ni3S2@NFP could be attributed to the following features: (1) Increased surface roughness and enhanced top electric field strength owing to the broccoli-like morphology; (2) facilitated oxidation and generation of Ni(Fe)OOH active sites; (3) enhanced stability stemming from the in situ generated surface dual-anionic layer; (4) rapid mass transport between electrode/electrolyte interface considering the super-hydrophilic surface. The catalytic performance of Ni3S2@NFP is further assessed in AEMWE system as the anode. This work opens up the possibility to judiciously engineer the electrocatalyst by promoting in situ self-reconstruction during OER in AEMWE devices for cost-effective green hydrogen production.
Declaration of competing interest
The authors declare that they have no known competing financial interests or personal relationships that could have appeared to influence the work reported in this paper.
Acknowledgments
This study was supported by the National Natural Science Foundation of China (NSFC, Nos. 21925503, 22102076), the Ministry of Science and Technology of the People's Republic of China (MOST, No. 2022YFA1504001), the Ministry of Education of the People's Republic of China (MOE, No. B12015) and the Fundamental Research Funds for the Central Universities.
Supplementary materials
Supplementary material associated with this article can be found, in the online version, at doi:10.1016/j.cclet.2023.108713.
Figure 1
(a) Schematic illustration of the synthesis route for Ni3S2@NFP electrocatalyst. NFP stands for amorphous nickel-iron-based phosphide and NP stands for nickel-based phosphide. SEM images of (b) NF, (c) NFP and (d) Ni3S2@NFP. (e) Cross-section SEM image, (f) EDS mapping and (g) elemental line scanning of Ni3S2@NFP. Simulation results of electric field intensity for the electrodes consisting of (h) compact (representing NFP and Ni3S2) and (i) broccoli-like (representing Ni3S2@NFP) nanoparticles. (j) XRD patterns of NFP and Ni3S2@NFP.
Figure 2
(a) The LSV curves of different electrodes in 1.0 mol/L KOH with 95% iR-compensation and (b) the corresponding Tafel slopes. (c) The overpotentials at 10 and 500 mA/cm2, along with the Tafel slopes of the catalysts in (a). (d) Double-layer capacitances and (e) Nyquist plots of the catalysts measured at 1.47 V. (f) The accelerated duration test of Ni3S2@NFP with 50 mV/s scan rate. (g) Chronopotentiometry curves of Ni3S2@NFP and NFP at 500 mA/cm2. (h) Inductively coupled plasma-optical emission spectrometry (ICP-OES) results of the electrolyte after OER chronopotentiometry test. The detailed data are listed in Table S3 (Supporting information).
Figure 3
(a) The top-view and (b) cross-section SEM images of Ni3S2@NFP electrode after OER test. (c) EDS mapping and (d) elemental line scanning of the Ni3S2@NFP fracture surface. High resolution XPS spectra of (e) Ni 2p, (f) Fe 2p, (g) P 2p, (h) S 2p for Ni3S2@NFP, NFP and Ni3S2. (i) XRD patterns of Ni3S2@NFP on Ni foam before and after electrolysis.
Figure 4
The in situ Raman spectra of (a) Ni3S2@NFP, (b) NFP and (c) Ni3S2. (d) In situ FTIR of Ni3S2@NFP in 1.0 mol/L KOH. (e) Schematic illustration of the layered structure of Ni3S2@NFP after dynamic reconstruction.
Figure 5
(a) The schematic diagram and optical picture of AEMWE device. (b) The assembly parts. (c) Polarization curves of Ni3S2@NFP-based AEMWE at 50 ℃ in 1.0 mol/L KOH. (d) Nyquist plots at 1.50 V. (e) Stability test at 500 mA/cm2.

 DownLoad:


 下载:
下载:


