
Figure 1.
Powder XRD profiles and Rietveld refinement patterns of (a) NNM, (b) NNMCZ. (c) Crystal structures of doping Cu and Zn of NNMCZ sample.
Construction of Cu-Zn Co-doped layered materials for sodium-ion batteries with high cycle stability
Xiping Dong , Xuan Wang , Zhixiu Lu , Qinhao Shi , Zhengyi Yang , Xuan Yu , Wuliang Feng , Xingli Zou , Yang Liu , Yufeng Zhao

Lithium-ion batteries (LIBs) are expected to applying electrical energy storage systems (EESs) for the exploitation of renewable energy resources [1,2]. However, due to the scarcity, uneven distribution, and high price of lithium resources, the application of LIBs in large-scale EESs has been limited. As a promising alternative, sodium-ion batteries (SIBs) have recently gained considerable interests owing to the abundant sodium resource and the similar electrochemistry mechanism with LIBs [3,4]. Layered transition-metal oxides NaxMO2 (M stands for transition metal element, such as Ni, Mn, Cu, Fe, Al) are considered the most promising SIBs cathodes due to their low cost and high theoretical capacities [5,6]. Among these layered oxides, P2-type Na0.67Ni0.3Mn0.7O2 material demonstrates potential for practical applications owing to the high specific capacity and energy density derived from electron transfer reaction of Ni2+/Ni4+ redox pairs [7,8]. Nevertheless, P2-type cathode material suffers from severely irreversible P2-O2 phase transition due to the gliding of transition metal layers, resulting in inferior cycling performance [9,10]. Ion doping is the most typical modification method. Liu et al. [11] synthesized Cu-doped Na0.67Ni0.33-xCuxMn0.67O2 cathode, the P2-O2 phase transition was suppressed by replacing part of Ni2+ with Cu2+ in transition metal layer, the capacity retention is improved by Cu-doping, and the cycling performance maintains 78% after 200 cycles. Some pioneer study has introduced Zn into P2-type manganese-based as cathode materials. Wu et al. [12] studied that Zn substitute can significantly relieve the discharge voltage decay of the Na0.67Ni0.33Mn0.67O2 when charged to higher voltages. Zhang et al. [13] proposed a layered Zn-doped compound Na0.7Zn0.15Mn0.75O2, which can deliver an initial discharge capacity of 158 mAh/g between 2 V and 4.4 V. Nevertheless, the cyclic stability and rate performance are relatively unsatisfying. Therefore, the simultaneous improvement of structural stability and rate capacity has become a priority in the study of P2 phase layered materials. Traditional inhibiting approaches in irreversible P2-O2 phase transition have encountered bottlenecks, and the trade-off between the capacity and cyclic stability, remain challenging obstacles that hindered the practical applications of P2-type cathode material.
Inspired by above studies, we synthesized a Cu and Zn co-doped Na0.67[Ni0.3Mn0.58Cu0.09Zn0.03]O2 via a solvothermal synthesis method. The as-obtained cathode material demonstrates a high reversible capacity (93 mAh/g@ 0.2 C), rate capability (64 mAh/g@ 20 C), and a remarkable cycle stability (capacity retention of 80% even after 1000 cycles at 2 C). The superior electrochemical performance can be attributed to the phase stability provided by Cu/Zn co-doped. Specifically, ex-situ X-ray diffraction (ex-situ XRD) test prove that the synthesized material maintains the P2 phase structure well throughout the charge/discharge process. Electrochemical impedance spectrum (EIS) and galvanostatic intermittent titration technique (GITT) analysis indicate that Cu/Zn co-doped Na0.67[Ni0.3Mn0.58Cu0.09Zn0.03]O2 can effectively improve the Na+ diffusion kinetics. These findings collectively point to the better electrochemical performance of the Cu/Zn co-doped Na0.67[Ni0.3Mn0.58Cu0.09Zn0.03]O2 cathode material.
The atomic ratios of Na, Ni, Mn, Cu and Zn in Na0.67[Ni0.3Mn0.58Cu0.09Zn0.03]O2 (NNMCZ) were determined to be 0.67:0.297:0.583:0.086:0.034 by inductively coupled plasma atomic emission spectroscopy (ICP-AES). These values are closed to the originally designed stoichiometric ratio. As a reference, undoped P2-type Na0.67Ni0.3Mn0.7O2 (NNM) was synthesized and the atomic ratio of Na, Ni and Mn were 0.67:0.307:0.693 determined through ICP-AES. To determine the crystal structure of the synthetic materials, X-ray diffraction (XRD) patterns were tested for NNM, NNMCZ, NNCM (doped with Cu) and NNZM (doped with Zn) as reference samples, simultaneously. The XRD patterns are presented in Figs. 1a and b. The Rietveld refinement crystallographic information is shown in Tables S2-S5 (Supporting information). The diffraction peaks for NNMCZ were indexed to a typical P2-type structure with the P63/mmc space group (PDF card #54–0894), indicating that the crystal structure of the initial NNM material did not change with Cu/Zn co-doping [14]. The structural diagram of cathode material NNMCZ is shown in Fig. 1c. The transition metal occupies the center of the MO6 octahedron, while sodium occupies the triangular prism position [15]. From the parameters after structural refinement, it can be found that the unit volume of NNMCZ (81.00 Å3) is larger than that of NNM (80.42 Å3), NNCM (80.37 Å3), and NNZM (80.70 Å3), which is benefit to enhancing Na+ intercalation/deintercalation [16]. Notably, the c-axis length in NNMCZ materials increases from 11.150 Å to 11.169 Å with Cu/Zn co-doping, indicating an enhancement in electrostatic cohesion between adjacent transition metal layers, hindering TMO2 sliding along the a-b plane and ensure structural stability [17].
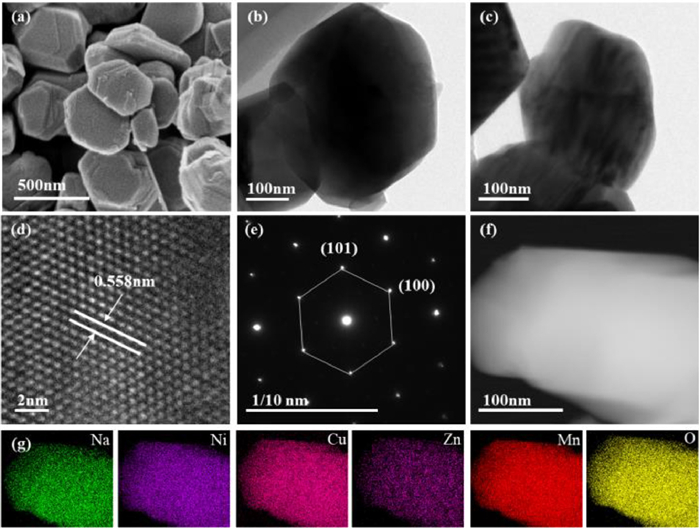
The morphological features and particle sizes of NNM and NNMCZ materials were investigated by field emission scanning electron microscope (FESEM) and high-resolution transmission electron microscope (HRTEM) (Fig. 2). The NNMCZ material exhibit regular hexagonal layered structures with a uniform size of 200 nm. Unlike NNMCZ, NNM cathode material exhibit hexagonal morphologies with uneven surface. (Fig. S2a in Supporting information). The HRTEM images reveal the NNMCZ material is comprised of regular hexagon structures featuring the lattice fringe distance of 0.558 nm corresponding to the (002) crystal planes (Fig. 2a). In addition, the selected area electron diffraction (SAED) patterns were applied to further observe the P2-type crystalline structure viewed from the (001) direction (Fig. 2e), which is consistent with the HRTEM imaging results (Fig. 2d). The energy-dispersive X-ray spectroscopy mapping image confirmed the uniform distribution of Na, Ni, Mn, Cu, Zn and O elements over the matrix in NNMCZ (Figs. 2f and g).
X-ray photoelectron spectroscopy (XPS) analysis was conducted on NNM and NNMCZ to explore the impact of co-doping with Cu and Zn on the valence states of elements. Fig. S3 (Supporting information) exhibit the XPS survey of NNM and NNMCZ, it shows the full XPS spectrum in the range of 0–1400 eV, in which Ni, Mn, Cu, and Zn signals were clearly detected. Figs. S4a and b (Supporting information) depict the XPS spectrums comparison of Cu and Zn for NNMCZ and NNM, respectively. The signal peaks of 933.2 eV (Cu 2p3/2) and 953.3 eV (Cu 2p1/2) in Cu region of NNMCZ is clearly visible in Fig. S4a, indicating the existence of Cu2+ in NNMCZ [18]. Zn 2p3/2 (1021.0 eV) and Zn 2p1/2 (1044.0 eV) peaks coexist in the Zn 2p XPS spectrum of NNMCZ (Fig S4b), indicating the bivalent state of Zn [19]. Combined with the previous XRD analysis, it can be considered that Cu and Zn elements were successfully doped into the lattice and both Cu and Zn in NNMCZ appear bivalent. As displayed in Fig. S4c (Supporting information), determined by the peaks at 854.5 eV and 872.1 eV which correspond to Ni 2p3/2 and 2p1/2, the Ni in NNM is basically distributed as a bivalent state [20]. After doping, Ni in NNMCZ exists as a mixed valence states of Ni2+/Ni3+ [21]. It can be proved by the fitting peak of Ni3+ at 855.6 and 873.3 eV [22]. The XPS data of the Mn element is presented in Fig. S4d (Supporting information). The analysis shows that Mn exists in mixed valence states of Mn3+/Mn4+, which are predominantly represented by the peak energies of 642.1 eV and 653.9 eV [23]. Notably, the ratio of Mn3+/Mn4+ changed after doping, with the Mn4+ content increasing. This increase in Mn4+ content can suppress the Jahn-Teller effect of Mn. The Jahn-Teller ion (high spin Mn3+) is believed to contribute to increased electronic localization due to strong Na+/e− binding, consequently reducing the diffusion coefficient [24,25].
The electrochemical performances of NNM and NNMCZ electrodes in half-cell system were evaluated at room temperature (1 C = 170 mAh/g). Figs. 3a and b present the typical charge/discharge curves of NNMCZ and NNM, respectively, at 0.2 C during the first two cycles. The NNMCZ demonstrate a higher capacity of 93 mAh/g at 0.2 C compared to NNM, which only exhibit a capacity of 86 mAh/g. Fig. S6 (Supporting information) reveal that NNCM and NNZM can release capacities of 84 mAh/g and 88 mAh/g, respectively. The cyclic voltammetry (CV) plots (Figs. 3c and d) illustrate the variation in charge/discharge curves between the two electrode materials for NNMCZ and NNM. These plots show distinct peaks for the different reactions occurring during the process. The peaks at approximately 3.25 and 3.6 V indicate the Ni2+/Ni3+ reactions, while those at 3.4 and 3.9 V are attributed to the Cu2+/Cu3+ reactions. These results are indicative of the diverse electrochemical behavior exhibited by the two electrode materials [26,27]. The redox peaks below 3.0 V for both NNM and NNMCZ electrode can be indexed to the redox reaction of Mn3+/Mn4+ [28]. Combined with the typical charge/discharge curves, the reversible redox peaks upon 3.7 V in the CV plots can be attributed to the redox of Cu2+/Cu3+. Therefore, the NNMCZ cathode material displays a higher specific capacity contribution of 77 mAh/g in the range of 3.0–4.1 V, which primarily arised from the Ni2+/Ni3+ and Cu2+/Cu3+ redox reactions. Furthermore, the Mn3+/Mn4+ redox reaction provides almost 16 mAh/g capacity below 3.0 V. However, the NNM cathode material in the range of 3.0–4.1 V is mostly come from the Ni2+/Ni3+ redox action and it can provide 62 mAh/g capacity. The capacity below the 3.0 V is also contributed from Mn3+/Mn4+ redox action and it exhibits 24 mAh/g capacity. From the charge/discharge curve and the CV plots, it can be found that the capacity of Mn3+/Mn4+ redox reaction in NNM is the highest, therefore the content of Mn3+ in NNM material is also the highest during the cycle. It is generally believed that Mn3+ and the Jahn-Teller effect are closely related [29]. The Jahn-Teller effect of Mn3+ will distort the lattice and increase internal stress, potentially causing particle breakage and leading to capacity decay. This degradation will worsen the stability of the NNM cycle [30].
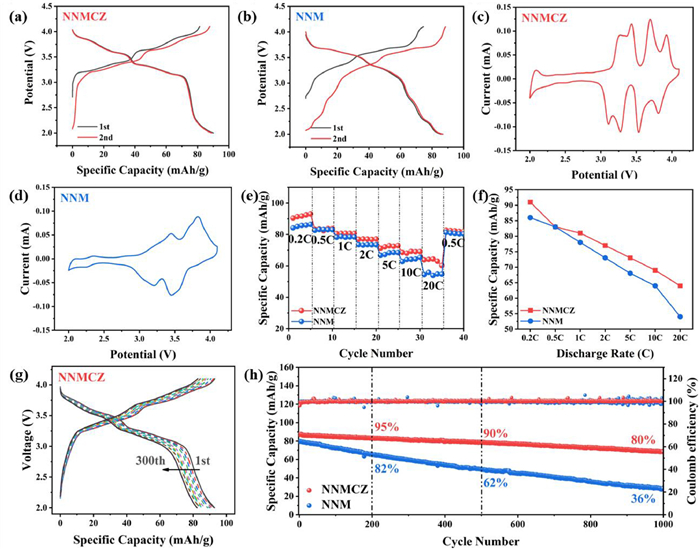
Moreover, the rate performance for NNMCZ and NNM electrodes are presented in Figs. 3e and f and Fig. S7 (Supporting information). The result reveals that the NNMCZ electrode exhibits higher capacities compared to the NNM electrode. Notably, the NNMCZ electrode displays highly reversible specific capacities of 64 mAh/g at 20 C in Fig. 3f. This finding suggests that the Na+ reaction kinetics of the NNMCZ electrode are faster than those of the NNM electrode, which only achieves a specific capacity of 54 mAh/g at 20 C. The NNMCZ electrode also demonstrates the highest discharge capacity and capacity retention at a high discharge rate, indicating the significant influence of the Cu/Zn co-doping on the electrochemical performance. Comparing the 300th cycle galvanostatic charge/discharge curves of NNM and NNMCZ, it is evident that NNMCZ demonstrates superior long cycle stability and lower voltage decay (Fig. 3g and Fig. S8 in Supporting information). Fig. 3h shows the cycle performances of NNMCZ and NNM materials under a discharge current of 2 C. The initial capacity of the NNMCZ material is 87 mAh/g, while the remaining capacity after 200, 500 and 1000 cycles are 83, 79 and 70 mAh/g, respectively. Correspondingly, the capacity retention rates for NNMCZ are 95%, 90% and 80%. These results indicate the excellent stability of the NNMCZ material. This is significantly superior to the control sample NNM, which is only 27 mAh/g after 1000 cycles at 2 C (36% capacity retention).
The execellent cycling retention of NNMCZ can be attributed to its large inter slab distance and strong binding force between transition metal elements. This confirms the enhanced efficiency of Na+ insertion/extraction in the crystal lattice [31,32]. Meanwhile, the inactive Zn doping may improve the cycling performance. It has been proposed that Zn doping has both surface and bulk stabilization effects on Na0.67Ni0.3Mn0.7O2 cathode materials, which can mitigate the capacity fading and voltage decay [33,34]. The corresponding long-cycle performance of NNCM and NNZM are depicted in Fig. S9 (Supporting information) and the remaining capacity retaition after 1000 cycles of NNCM and NNZM are 67% and 60%, respectively. It can be inferring that Cu/Zn co-doping NNMCZ electrode demonstrates the best long cycle stability.
Fig. S10 (Supporting information) displays the charge/discharge curves of NNM, NNMCZ, NNCM, and NNZM for the first three cycles, at 0.2 C within the potential range of 2.0–4.2 V. The poor electrochemical performance of the NNM, NNCM and NNZM can be attributed to the significant structural shrinkage and shortened interlayer spacing caused by the phase structure transformation. During this transformation, there is an obvious voltage plateau that corresponds to the P2-O2 phase transition and the sliding of transition metal layers (TM) [35]. The resulting structural changes have negative effects on the electrochemical performance of the material. The NNM and NNCM materials display a long voltage plateau, providing a capacity of over 20 mAh/g, which exceeds a higher specific capacity of 100 mAh/g. Despite higher capacity, the electrochemical performance of NNM and NNCM is unsustainable. On the other hand, the NNZM material demonstrates a short plateau and contributes to a lower capacity of 5 mAh/g, possibly due to the inhibition of P2-O2 phase transition by Zn doping [36]. It is notable that the NNMCZ material shows no phase transition throughout the charge/discharge process, indicating that the Cu/Zn co-doped NNMCZ exhibit stable phase structure. Therefore, it is evident that among the four samples, only NNMCZ exhibits a stable electrochemical performance.
In order to better understand the improved electrochemical performance of NNMCZ, it is important to investigate the charge storage kinetics during charge/discharge processes. This involves examining the transport kinetics of Na+ within the cathode material. To achieve this, the cyclic voltammetry (CV) was used to test the Na+ diffusion coefficients for both NNM and NNMCZ at various scan rates (Figs. 4a and b). Through these tests, we gained insight into the Na+ transport kinetics within the cathode materials and were able to further understand the factors contributing to the exceptional electrochemical performance of NNMCZ. The CV curves of the NNMCZ show three pairs of reversible cathodic/anodic peaks in Fig. 4a, which are located at 3.48/3.27 V, 3.71/3.51 V and 3.98/3.81 V. Peaks below 3.0 V correspond to the Mn3+/Mn4+ redox reaction, while those above 3.0 V may result from the redox reactions of Ni2+/Ni3+ and Cu2+/Cu3+ as well as the simultaneous ordering of Na+/vacancy [37,38]. It can be found with the increase of scan rate, the main shape of the CV curves is well maintained, indicating a fast Na+ insertion/extraction kinetics in NNMCZ. The detailed fitting curves of oxidation and reduction peak current (i) versus square root of scan rates (v1/2) are shown in Fig. 4c (NNMCZ) and Fig. S11a (Supporting information). The CV profiles at different scan rates are used to reveal the pseudo-capacitance contribution to the charge storage process, according to the formula of i = avb (log(i)= b × log(v) + log(a)) [39]. The log(i) versus log(v) plots of NNMCZ is depicted in Fig. 4d, in which the b values for O1, O2, O3, R1, R2 and R3 peaks are 0.654, 0.649, 0.819, 0.633, 0.606 and 0.642 respectively, demonstrating the capacitive behavior and Faradaic intercalation process are coexist in the whole sodium-ions storage process, which indicates the fast kinetic in NNMCZ electrode [40]. On contrast, the log(i) versus log(v) plots of NNM is depicted in Fig. S11b (Supporting information). The contribution rate of capacitance and diffusion capacity is shown in Fig. S12 (Supporting information). The enhanced rate performance is mainly ascribed to the improved Na+ diffusion kinetics because of the expanded interlayer spacing enabled by the appropriate Cu/Zn co-doping.
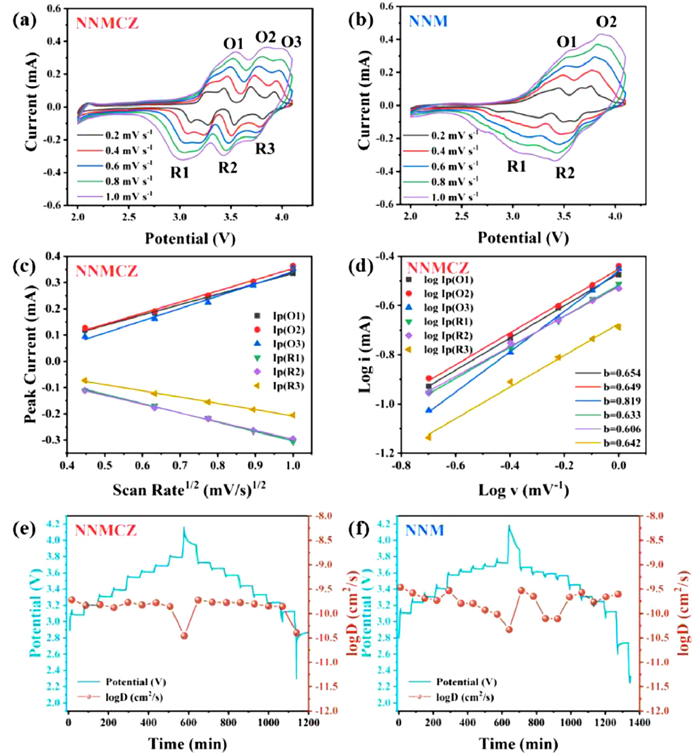
The maximum specific capacity of the cathode material could be deduced using the galvanostatic intermittent titration technique (GITT) measured at equilibrium state, which is a reliable electrochemical technique to evaluate the transport kinetics [41]. In the measurement, the battery was charged and discharged at 0.15 C (25 mA/g) for 30 min and then relaxed for 120 min to bring the voltage to equilibrium. Figs. 4e and f show the GITT tests of the two cathode materials. The corresponding Na+ diffusion coefficient (DNa+) is calculated according to the following equation:
|
|
(1) |
where τ is the time of applying constant current. MB and mB are the molecular weight and mass of the active material, respectively. VM is the molar volume, A is the surface area of the electrode, ΔEs and ΔE are the total change of the cell voltage E during the steady-state (equilibrium) voltage and current pulse, respectively [42]. As shown in Fig. 4e, the distribution range of DNa (NNMCZ) value is 10−9 cm2/s, which is higher than that of NNM (10−10 cm2/s), which agrees well with the superiority of NNMCZ in rate capability (Figs. 4e and f) and supports the positive effect of Cu/Zn co-doping on the kinetics of sodium storage.
Electrochemical impedance spectrum (EIS) measurements were conducted to investigate the interfacial charge transfer kinetics in NNMCZ/NNM electrodes and solid-electrolyte interphase (SEI) layer evolution during cycling [43]. Selected Nyquist plots for NNMCZ and NNM electrodes were presented in Fig. S13 (Supporting information), in which two semi-circles and a straight line are identified in all these spectra, indicating the similar electrochemical processes in NNMCZ and NNM electrodes [44,45]. As shown in Fig. S13, it could be found that the EIS of NNMCZ electrode greatly lower than NNM, verifying that the Cu/Zn co-doping could enhance the interfacial charge transfer kinetics and contribute to the satisfactory rate performance for NNMCZ.
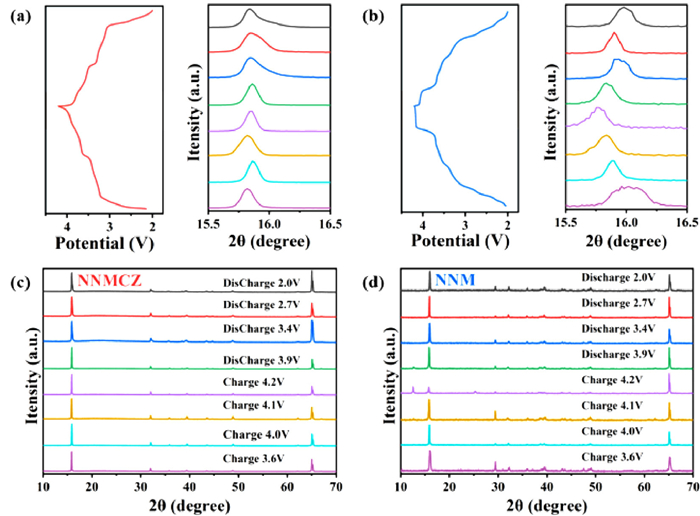
To explore the structural evolution of NNMCZ and NNNM during Na+ extraction/insertion, ex-situ XRD measurement was conducted during the initial charge/discharge process at 0.1 C in the potential range of 2.0–4.2 V [46]. It is generally accepted that P2-O2 phase transformation tends to occur in layered P2-type transition metal oxides aroused by the gliding of the oxygen layer upon large amount Na+ extraction [47,48]. To verify the stability effect of Cu/Zn co-doping on this structural evolution, the ex-situ XRD analyses of NNMCZ are carried out at different charge/discharge states. The ex-situ XRD patterns in the range of 10°−70° during a complete electrochemical cycle are presented in Fig. 5. It is observed that all the main diffraction peaks in charge/discharge states. The ex-situ XRD patterns in the range of 10°−70° during a complete electrochemical cycle are presented in Fig. 5. It is observed that all the main diffraction peaks in NNMCZ cathode material are basically maintained corresponding to the P2 phase at various charge and discharge states, without phase transition occurs around 4.2 V and there are no evident shifts in the (002) peak. The typical (002) peak of NNM slightly shifts to a lower 2 θ upon charging, suggesting that the interlayer space gradually increases with sodium removal [49]. Upon Na+ extraction, the (002) diffraction peak experiences a continuous shift towards lower angles, indicating that the interlayer distance is expanding due to the increased repulsion force of neighboring oxygen layers. This expansion subsequently triggers the expansion of electrostatic repulsions between adjacent oxygen atoms, lead to irreversible phase transition and reduce electrochemical performance [50]. As shown in Figs. S14a and b (Supporting information), NNMCZ have a stable phase structure at 10–15° while NNM have a peak at charge to 4.2 V and discharge at 3.9 V. Meanwhile, as shown in Figs. S14c and d (Supporting information), the NNMCZ have a stable peak without shift in 66–68°, while NNM diffraction peak disappear. It is reported that the peak at 10°−15° and 66°−68° are relevant to the P2-O2 phase transition, which indicate the NNMCZ have a stable phase at the during the charge/discharge reaction [51]. The diffraction peak remain original state during the discharge process, indicating that the addition of Cu and Zn enhances the stability of the NNMCZ cathode material, resulting in improved cycling life [52].
The practical application of NNMCZ was evaluated using a full-cell assembled according to the configuration (Fig. 6a), the pre-sodiated hard carbon (HC) was served as anode and NNMCZ material was served as cathode, being tested in a voltage range of 1.9–4.1 V. Before assembling the full battery, the HC anode was first pre-sodiated by electrochemical process to facilitate the formation of the SEI. The Galvanostatic charge/discharge profiles of the HC are exhibited in Fig. S15a (Supporting information) for the first three cycles. The matching mass ratio between the cathode and anode is carefully determined based on the specific capacities of NNMCZ and HC in the half-cell (Fig. S15b in Supporting information). To set the voltage window of the full battery, CV tests of both half batteries are conducted and the results are shown in Fig. S15c (Supporting information). Specifically, the voltage window for the full battery is set to 1.9–4.1 V, in line with the outcome of the CV tests. The NNMCZ||HC full-cell exhibits a capacity of 79 mAh/g based on the active mass of cathode material (Fig. 6b). The full-cell as constructed has a high energy-density of 150 Wh/kg, determined by the combined active mass on both electrodes. Fig. 6c and Fig. S15d (Supporting information) display the rate performance and corresponding galvanostatic charge/discharge curves for NNMCZ||HC full-cell. At the rates of 0.2, 0.5, 1, 2 and 5 C, the reversible capacities are 77, 65, 59, 53 and 46 mAh/g. Moreover, after 200 cycles at 1 C, the full-cell can still maintain a decent capacity retention of 75% (Fig. 6d), revealing excellent cycling stability (based on the mass of NNCZM, 1 C = 170 mAh/g). The full-cell improved sodium storage properties demonstrate that Cu/Zn co-doping is an effective way to enhance the electrochemical performance of SIBs.

In conclusion, we aimed to enhance the cycling stability and rate performance of Na0.67[Ni0.3Mn0.58Cu0.09Zn0.03]O2 layered cathode materials for sodium ion batteries by co-doping Cu and Zn. The results show that the Cu/Zn co-doped Na0.67[Ni0.3Mn0.58Cu0.09Zn0.03]O2 cathode material can not only improve the diffusion kinetics of Na+ but also stabilize the layered structure upon continuous electrochemical cycling. This cathode material demonstrates an excellent performance, delivering an initial discharge capacity of 93 mAh/g at an average voltage of 3.3 V. Moreover, a superior rate capability was observed, with a discharge capacity of 64 mAh/g at 20 C, indicative of its high potential for use in high-power applications. In addition, the ex-situ XRD analysis demonstrates that Cu/Zn elements work together to relieve the structural collapse and enhances the stability. The addition of Cu/Zn improves the long-term cycling performance, making Na0.67[Ni0.3Mn0.58Cu0.09Zn0.03]O2 a promising cathode material for SIBs.
The authors declare that they have no known competing financial interests or personal relationships that could have appeared to influence the work reported in this paper.
This work is supported by the National Natural Science Foundation of China (Nos. 22179077, 51774251, 21908142), Shanghai Science and Technology Commission's "2020 Science and Technology In-novation Action Plan" (No. 20511104003), Natural Science Foundation in Shanghai (No. 21ZR1424200).
Supplementary material associated with this article can be found, in the online version, at doi:
N. Ortiz-Vitoriano, N.E. Drewett, E. Gonzalo, et al., Energy Environ. Sci. 10 (2017) 1051–1074. doi: 10.1039/C7EE00566K
P. Hu, T. Zhu, C. Cai, et al., Angew. Chem. Int. Ed. 62 (2023) e202219304. doi: 10.1002/anie.202219304
Q. Shi, R. Qi, X. Feng, et al., Nat. Commun. 13 (2022) 3205. doi: 10.1038/s41467-022-30942-z
J. Feng, S. Luo, K. Cai, et al., Chin. Chem. Lett. 33 (2022) 2316–2326. doi: 10.1016/j.cclet.2021.09.077
J.Y. Hwang, S.T. Myung, Y.K. Sun, Chem. Soc. Rev. 46 (2017) 3529–3614. doi: 10.1039/C6CS00776G
N.T. Aristote, K. Zou, A. Di, et al., Chin. Chem. Lett. 33 (2022) 730–742. doi: 10.1016/j.cclet.2021.08.049
W. Li, Z. Yao, S. Zhang, et al., ACS Appl. Mater. Interfaces 12 (2020) 41477–41484. doi: 10.1021/acsami.0c11375
L. Shen, Y. Li, S. Roy, et al., Chin. Chem. Lett. 32 (2021) 3570–3574. doi: 10.1016/j.cclet.2021.03.005
C. Cheng, M. Ding, T. Yan, et al., Small Methods 6 (2022) e2101524. doi: 10.1002/smtd.202101524
C. Cai, X. Li, P. Hu, et al., Adv. Funct. Mater. (2023) 2215155. doi: 10.1002/adfm.202215155
L. Yang, S.H. Luo, Y. Wang, et al., Chem. Eng. J. 404 (2021) 126578. doi: 10.1016/j.cej.2020.126578
X. Wu, J. Guo, D. Wang, et al., J. Power Sources 281 (2015) 18–26. doi: 10.1016/j.jpowsour.2014.12.083
J. Zhang, G. Liu, H. Yu, et al., Ionics 25 (2018) 2195–2200. doi: 10.1007/s12221-018-8399-1
M.H. Han, E. Gonzalo, G. Singh, et al., Energy Environ. Sci. 8 (2015) 81–102. doi: 10.1039/C4EE03192J
X. Li, X. Ma, D. Su, et al., Nat. Mater. 13 (2014) 586–592. doi: 10.1038/nmat3964
Y. Liu, X. Fan, B. Luo, et al., J. Colloid Interface Sci. 604 (2021) 776–784. doi: 10.1093/schbul/sbaa174
P. Vanaphuti, Z. Yao, Y. Liu, et al., Small 18 (2022) e2201086. doi: 10.1002/smll.202201086
H. Liu, X. Gao, J. Chen, et al., J. Energy Chem. 75 (2022) 478–485. doi: 10.1016/j.jechem.2022.09.010
K. Xu, M. Yan, Y.X. Chang, et al., Electrochim. Acta 419 (2022) 140394. doi: 10.1016/j.electacta.2022.140394
J. Zhang, W. Wang, W. Wang, et al., ACS Appl. Mater. Interfaces 11 (2019) 22051–22066. doi: 10.1021/acsami.9b03937
Z.Y. Li, X.B. Ma, H. Guo, et al., ACS Appl. Energy Mater. 4 (2021) 5687–5696. doi: 10.1021/acsaem.1c00527
L. Li, Q. Ran, S. Hao, et al., J. Colloid Interface Sci. 615 (2022) 554–562. doi: 10.1016/j.jcis.2022.01.177
W. Zuo, X. Liu, J. Qiu, et al., Nat. Commun. 12 (2021) 4903. doi: 10.1038/s41467-021-25074-9
X. Wang, X. Yin, X. Feng, et al., Chem. Eng. J. 428 (2022) 130990. doi: 10.1016/j.cej.2021.130990
T. Yuan, S. Li, Y. Sun, et al., ACS Nano 16 (2022) 18058–18070. doi: 10.1021/acsnano.2c04702
W. Kang, D.Y. Yu, P.K. Lee, et al., ACS Appl. Mater. Interfaces 8 (2016) 31661–31668. doi: 10.1021/acsami.6b10841
D.H. Lee, J. Xu, Y.S. Meng, Phys. Chem. Chem. Phys. 15 (2013) 3304–3312. doi: 10.1039/c2cp44467d
H. Wang, X. Zhang, H. Zhang, et al., ACS Appl. Mater. Interfaces 15 (2023) 11691–11702. doi: 10.1021/acsami.2c20720
L. Zhang, C. Wang, Y. Liu, et al., Chem. Eng. J. 426 (2021) 130813. doi: 10.1016/j.cej.2021.130813
Q.N. Liu, Z. Hu, M.Z. Chen, et al., J. Mater. Chem. A 7 (2019) 9215–9221. doi: 10.1039/c8ta11927a
H. Zhao, J. Li, Y. Mo, et al., J. Alloys Compd. 895 (2022) 162483. doi: 10.1016/j.jallcom.2021.162483
P.F. Wang, T. Jin, J. Zhang, et al., Nano Energy 77 (2020) 105167. doi: 10.1016/j.nanoen.2020.105167
Y. Xiao, H.R. Wang, H.Y. Hu, et al., Adv. Mater. 34 (2022) e2202695. doi: 10.1002/adma.202202695
R.Y. Yue, F. Xia, R.J. Qi, et al., Chin. Chem. Lett. 32 (2021) 849–853. doi: 10.1016/j.cclet.2020.05.025
J. Jiang, H.C. He, C. Cheng, et al., ACS Appl. Energy Mater. 5 (2022) 1252–1261. doi: 10.1021/acsaem.1c03656
J.H. Hong, M.Y. Wang, Y.Y. Du, et al., J. Mater. Sci. Mater. Electron. 30 (2019) 4006–4013. doi: 10.1007/s10854-019-00687-5
F. Li, Y. Tian, Y. Sun, et al., J. Colloid Interface Sci. 611 (2022) 752–759. doi: 10.1016/j.jcis.2021.11.171
H.R. Yao, W.J. Lv, X.G. Yuan, et al., Nano Energy 97 (2022) 107207. doi: 10.1016/j.nanoen.2022.107207
H.L. Long, X.P. Yin, X. Wang, et al., J. Energy Chem. 67 (2022) 787–796. doi: 10.1016/j.jechem.2021.11.011
D. Kwon, S.J. Park, J. Lee, et al., Adv. Sci. 10 (2023) e2206367. doi: 10.1002/advs.202206367
X.B. Zheng, P. Li, H.J. Zhu, et al., Energy Storage Mater. 15 (2018) 257–265. doi: 10.1016/j.ensm.2018.05.001
X. Wang, X. Dong, X. Feng, et al., Small Methods 7 (2023) e2201201. doi: 10.1002/smtd.202201201
X. Yin, Z. Lu, J. Wang, et al., Adv. Mater. 34 (2022) e2109282. doi: 10.1002/adma.202109282
J. Li, S. Tang, Z. Li, et al., J. Colloid Interface Sci. 629 (2022) 461–472. doi: 10.3390/machines10060461
X. Yin, T. Liu, X. Yin, et al., Chin. Chem. Lett. 34 (2023) 107840. doi: 10.1016/j.cclet.2022.107840
C. Cheng, C. Chen, S. Chu, et al., Adv. Mater. 34 (2022) e2201152. doi: 10.1002/adma.202201152
X. Liu, W. Zuo, B. Zheng, et al., Angew. Chem. Int. Ed. 58 (2019) 18086–18095. doi: 10.1002/anie.201911698
L. Yang, X. Li, J. Liu, et al., J. Am. Chem. Soc. 141 (2019) 6680–6689. doi: 10.1021/jacs.9b01855
K. Jiang, X. Zhang, H. Li, et al., ACS Appl. Mater. Interfaces 11 (2019) 14848–14853. doi: 10.1021/acsami.9b03326
Z. Liu, J. Shen, S. Feng, et al., Angew. Chem. Int. Ed. 60 (2021) 20960–20969. doi: 10.1002/anie.202108109
S.J. Park, J. Lee, I.H. Ko, et al., Energy Storage Mater. 42 (2021) 97–108. doi: 10.1016/j.ensm.2021.07.013
P. Zhou, Z. Che, F. Ma, et al., Chem. Eng. J. 420 (2021) 127667. doi: 10.1016/j.cej.2020.127667

Figure 1 Powder XRD profiles and Rietveld refinement patterns of (a) NNM, (b) NNMCZ. (c) Crystal structures of doping Cu and Zn of NNMCZ sample.

Figure 2 Morphological and crystal structure characterizations. (a-d) FESEM and HRTEM analysis of NNMCZ. (e) SAED pattern of NNMCZ. (f, g) EDS mapping results of NNMCZ.

Figure 3 Electrochemical properties of half battery. Galvanostatic charge/discharge curves of (a) NNMCZ and (b) NNM at 0.2 C for the first two cycles at potential range between 2.0 V and 4.1 V. Cyclic voltammetry plots of (c) NNMCZ and (d) NNM. (e) Rate performance of NNMCZ and NNM. (f) Different current densities comparison between NNMCZ and NNM. (g) Galvanostatic charge/discharge curves in the range of 2.0–4.1 V at 2 C showing 300 cycles for NMMCZ. (h) Long cycle stability comparison of NNMCZ and NNM at the current density of 2 C with half-batteries.

Figure 4 Electrode process kinetics. (a) NNMCZ (b) NNM CV curves at different scan rates from 0.2 mV/s to 1 mV/s. (c) corresponding fitting curves between peak currents (i) and the square root of scan rates (v1/2) for NNMCZ. (d) log(i) versus log(v) plots of NNMCZ. GITT curves and corresponding sodium-ion diffusion coefficients DNa+ of (e) NNMCZ and (f) NNM.

Figure 5 Ex-situ XRD patterns. (a) NNMCZ, (b) NNM at various charge/discharge states during the first cycle and corresponding (002) peak shift. Ex-situ XRD of (c) NNMCZ and (d) NNM.

Figure 6 Electrochemical Characterizations of the NNMCZ||HC full cells. (a) Schematic of the NNMCZ cathode//hard carbon Na-ion full battery. (b) Galvanostatic charge/discharge profiles of the full battery for the first three cycles at 0.2 C. (c) Rate performance of NNMCZ full-cell. (d) Cycling performance at 1 C of the full battery within the voltage window of 1.9–4.1 V.

 扫一扫看文章

扫一扫关注我们
 DownLoad:
 下载:
下载: