Figure 1.
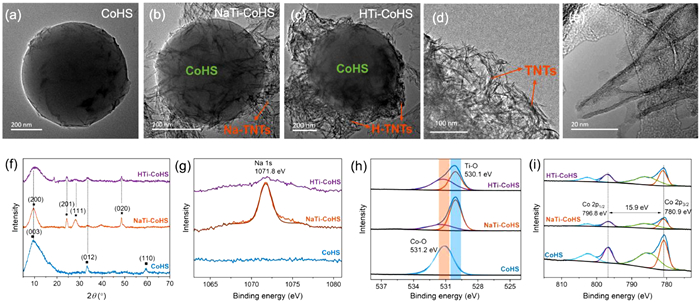
TEM images of (a) CoHS, (b) NaTi-CoHS and (c-e) HTi-CoHS. (f) XRD pattern of CoHS, NaTi-CoHS and HTi-CoHS. High-resolution XPS spectra of (g) Na 1s, (h) O 1s and (i) Co 2p in CoHS, NaTi-CoHS and HTi-CoHS.
Reactive species regulation by interlayered Na+/H+ of titanate nanotubes decorated Co(OH)2 hollow microsphere for peroxymonosulfate activation and gatifloxacin degradation
Bin Zhou , Long Chen , Fan Li , Weiliang Sun , Zhicheng Pan , Yumei Peng , Lian Qiu , Wen Liu

Emerging organic pollutants (EOPs) in water are of great concern due to their high toxicity and environmental risk, such as pharmaceuticals and personal care products (PPCPs), endocrine disruptors, flame retardants, perfluorinated alkyl substances (PFAS) [1-3]. The impact and toxicity of EOPs on the water environment are increasingly prominent, especially the spread of resistance genes caused by antibiotics [4,5]. Antibiotics are essential substances in industrial and agricultural production and daily life, which can enter into the water environment through sewage treatment plant effluent, garbage leachate, livestock and poultry breeding wastewater, and farmland surface runoff [6,7]. Antibiotic resistance and toxicity to non-targeted organisms have become an imminent global health threat nowadays [8]. Moreover, the pseudo-persistence brought by continuous input to the environment, leads to the formation of transformation products from parent substances with higher biological activity, persistence, mobility and transformation products, thus seriously threatening the ecosystem and human health [9,10]. Antibiotics are difficult to remove stably and effectively by the activated sludge-based process in traditional wastewater treatment plants, so the development of new technologies has become a hot topic in this research area. Advanced oxidation processes (AOPs) are considered to be the most promising due to the advantages of fast reaction kinetics, strong oxidation capacity and high mineralization of organic pollutants [11,12].
In recent years, AOPs based on SO4•− have attracted much attention due to the following advantages: 1) the higher redox potential (2.5–3.1 V) than hydroxyl radical (•OH, 1.8–2.7 V), 2) higher selectivity to the organic compound containing benzene ring or unsaturated bond, 3) longer half-life (30–40 µs) to efficiently react with pollutants, and 4) higher reactivity at wide pH range (2–9) [13,14]. Generally, SO4•− can be generated by peroxymonosulfate (HSO5−, PMS) or persulfate (S2O82−, PS) through homogeneous activation like radiation, electricity, ultrasound, as well as through heterogeneous activation by catalysts such as cobalt-based materials [13,15]. The heterogeneous activation process using materials can usually achieve energy-saving and maximize the use of electron transfer. Meanwhile, another reactive species besides SO4•− can also be generated in the PMS/PS activation system because of radical-chain reactions, such as •OH and •O2−. Thus, these reactive species with different characteristics show different contributions to pollutants degradation, and may also induce different reaction pathways [16,17]. Moreover, in the PMS activation cycle, the role of SO5•− is usually overlooked, due to its limited contribution to the removal of pollutants. However, SO5•− is considered as the primary source of 1O2 [18]. 1O2 has good pH independence, and strong resistance to inorganic ions and organics, which exhibits selectivity for the attack of special pollutants [19,20]. Thus, regulation for the production of 1O2 from SO5•− is an important strategy to achieve selective removal of organic pollutants in water treatment process.
In this study, hollow microsphere Co(OH)2 was synthesized and used as the support titanate nanotubes (TNTs) with abundant surface groups (–ONa/–OH) for PMS activation. Besides the production of SO4•− driven by Co(Ⅱ)-induced PMS activation, the generation of 1O2 from SO5•− was also promoted by the regulation of interlayered ions in TNTs. The degradation efficiency of a typical antibiotic, gatifloxacin (GAT), was tested in this AOP. Moreover, the degradation mechanism and transformation pathway were systematically studied by both experimental analysis and theoretical calculation.
Chemicals are shown in Text S1 (Supporting information). The synthesis and characterization methods of materials, including Co(OH)2 hollow microsphere (CoHS), Na-type TNTs (Na-TNTs) decorated CoHS (NaTi-CoHS) and H-type TNTs (H-TNTs) decorated CoHS (HTi-CoHS), are shown in Texts S2 and S3 (Supporting information). The characteristics of GAT are listed in Table S1 (Supporting information). The characterization methods of materials including transmission electron microscopy (TEM), X-ray diffractometer (XRD), X-ray photoelectron spectroscopy (XPS) and Fourier transform infrared (FTIR) are shown in Text S3. The heterogeneous degradation reaction was carried out in a 200 mL reactor. Typically, 1 mL of 1 mmol/L GAT and 1 mL of 10 mmol/L PMS were mixed with 98 mL deionized (DI) water. HClO4 and NaOH were used to adjust the pH to 5, and phosphate buffer (0.1 mol/L) was used to maintain the pH of the solution. The catalytic reaction was started after adding the material. At predetermined time intervals (0–5 min), 1 mL sample was taken out and filtered through a 0.22 µm nylon filter membrane immediately. Na2SO3 was used to quench the residual reactive species. Control tests of direct oxidation of GAT by PMS and adsorption by material were also carried out. Scavenger quenching tests were conducted to investigate the contributions of different reactive species to GAT degradation. Specifically, tert-butyl alcohol (TBA), ethanol (EA), and furfuryl alcohol (FFA) were applied to quench •OH, both •OH and SO4•−, and 1O2, respectively. Electron paramagnetic resonance (EPR) was also used to detect the formed reactive species in this AOP (Text S4 in Supporting information). •OH and SO4•− were detected in aqueous solution after the addition of 5, 5-dimethyl-1-pyrroline N-oxide (DMPO), while 1O2 was detected after the addition of 2, 2, 6, 6-tetramethylpiperidine (TEMP). The concentration of GAT was analyzed on a high-performance liquid chromatography system (HPLC, Agilent 1260 Ⅱ) equipped with a Zorbax SB-C18 column (4.6 × 150 mm, 3.5 µm). The column temperature was held at 30 ℃, and the mobile phase was composed of methanol and 0.1% formic acid at 60:40 (v/v) with a flow rate of 1 mL/min. A UV detector (G1314A VWD) was operated at a wavelength of 278 nm. The intermediates and by-products of the degradation system were identified on an ultrahigh-performance liquid chromatography-mass system (UHPLC, Dionex UltiMate 3000 Series; MS, Thermo Scientific, USA) (Text S5 in Supporting information). The Fukui function and electrostatic potential (ESP) based on density functional theory (DFT) are calculated to predict the regioselectivity of reactive species attacking the GAT molecule, which is operated on Gaussian 16 C.01 software (Text S6 in Supporting information) [21].
As reported previously [22], Na-TNTs and H-TNTs had the same crystal structure of tri-titanate with a conjunct [TiO6] octahedron as a skeleton, but different exchangeable Na+/H+ in the interlayers. In terms of morphology and structure, Na-TNTs and H-TNTs both showed a uniform and open-ended tubular structure with multilayers (Fig. S1 in Supporting information). Specifically, TNTs exhibited a tubular structure with an outer diameter of ~9 nm and an inner diameter of ~4.5 nm, consistent with our previous report [22]. The synthesized CoHS exhibited a spherical structure with a diameter of 600 nm, consisting of a smooth surface (Fig. 1a). NaTi-CoHS and HTi-CoHS maintained the skeleton structure of Co(OH)2 microsphere (Figs. 1b and c), located at the center with a similar diameter (~600 nm). Na-TNTs and H-TNTs grew on the surface during the hydrolysis reaction and hydroxylation process, respectively. Tubular TNTs interposed and stuck around Co(OH)2 microspheres. The solution pH in the synthesis process was regulated to maintain the interlayer-ions structure of TNTs. The surface grafting of titanate nanotubes greatly enlarged the active sites for PMS activation. In addition, TNTs on the surface can further absorb PMS molecules and target pollutants. The open tubular structure of TNTs also maintained under the second hydrothermal process for the transformation of CoHS from precursor alkoxy cobalt microsphere through hydrolysis (Fig. 1d). TNTs well coated on the CoHS, and the shell of Na/HTi-CoHS consisted of nanoflakes (Fig. 1e).
The XRD pattern also displays the successful grafting of TNTs on the surface of CoHS (Fig. 1f). For the CoHS microsphere, the peaks at 10°, 33.7° and 59.5° were ascribed to crystal planes of (003), (012) and (110) of α-Co(OH)2, respectively [23]. For NaTi-CoHS and HTi-CoHS, the peaks at 10°, 24.5°, 28.5° and 48.1° were assigned to crystal planes of (200), (201), (111) and (020) of TNTs, respectively [24]. Compared with NaTi-CoHS, the intensity of peaks belonging to TNTs of HTi-CoHS decreased, due to the dissociation of interlayer structure at low pH. Interestingly, the peak at ~10° both for TNTs and CoHS showed the similar interlayer structure, promoting the structural compatibility [25,26]. The increased interlayer spacing further showed the bonding between TNTs and Co(OH)2, where the Ti–O–Co bond at the interface was conducive to electron transfer. The new peak at 18.8° emerged for the HTi-CoHS was ascribed to the hexagonal Co(OH)2 (JCPDS No. 45–0031), as the hydrolysis product at acidic conditions. FTIR spectra further illustrates the success of surface grafting (Fig. S2 in Supporting information), where the peak at 1630 cm−1 was ascribed to the O–H deformation vibration of the Co–O–H bond and Ti–O–H [27]. The surface elements of materials were further analyzed by XPS spectra. The peak at 1071.8 eV assigned to Na 1s was only observed in NaTi-CoHS, directly indicating the surface component of Na-TNTs (Fig. 1g). The high-resolution XPS spectra of O 1s displayed the peak at 531.2 eV was attributed to the lattice oxygen of Co–O in CoHS (Fig. 1h) [28]. The lower energy of the peak centered at 530.1 eV was assigned to the lattice oxygen of Ti–O in NaTi-CoHS and HTi-CoHS [29]. In addition, the shift of 0.3 eV of Co–O in NaTi-CoHS compared with that in CoHS was ascribed to the interaction between CoHS with Na-TNTs. For Co 2p in CoHS, the two main peaks centered at 780.9 eV and 796.8 eV corresponded to the Co 2p3/2 and Co 2p1/2 of Co(Ⅱ), respectively (Fig. 1i) [30]. The peaks located at 785.6 eV and 802.3 eV were satellite peaks, regarded as the typical characterization of Co(Ⅱ). The spin-orbital coupling of Co 2p was 15.9 eV, indicating Co(Ⅱ) was in the typical octahedral field. Therefore, the grafting of TNTs on the surface of CoHS kept the key activation species of Co(Ⅱ), and further facilitated electron transfer for the interface reaction. Fig. S3 (Supporting information) shows the Ti 2p XPS spectra of Na-TNTs and HTNTs. The two broad peaks located at 458.5 and 464.1 eV, are assigned to the Ti 2p3/2 and Ti 2p1/2 peaks of Ti(Ⅳ) [31]. The spin-orbital coupling of 5.6 eV further confirmed the stable Ti4+ in the [TiO6] octahedron [32].
Fig. 2 showed the GAT degradation in different PMS activation systems. The adsorption of GAT by all materials can be ignored (< 5%), and the direct oxidation of PMS for GAT was also limited (only 2.8%) (Fig. 2a). The addition of catalysts greatly promoted the degradation of GAT, due to the generation of reactive species with strong oxidation ability. Specifically, about 52.1% of GAT was removed within 5 min after the addition of CoHS. The removal efficiency was increased to 86.2% and 96.6% after the addition of NaTi-CoHS and HTi-CoHS, respectively. Therefore, it is indicated that the decoration of TNTs greatly promoted the catalytic ability of CoHS. The abundant hydroxyl groups on the surface and the exchangeable interlayer ionic structure of TNTs were beneficial to the adsorption of PMS and GAT molecules, providing a preferential electron transfer pathway for the generation of reactive species and pollutant degradation. Moreover, the degradation kinetics of GAT by using NaTi-CoHS was different from using HTi-CoHS, as quick degradation occurred in the early stage, while a lower final GAT removal efficiency. The rapid decomposition of PMS was observed in the initial 2 min to achieve the generation of SO4•− and SO5•− (Fig. S4 in Supporting information), in which SO4•− was dominant to the effective degradation of GAT in the early stage. Different from HTi-CoHS with abundant hydroxyl groups on the surface to adsorb SO5•−, the active sites of NaTi-CoHS were limited. Therefore, the conversion from SO5•− to 1O2 was inhibited, leading to only 85% of GAT degradation within 5 min and no further oxidation. The pseudo-first order kinetic model was introduced to describe the GAT degradation process, shown in Table S2 (Supporting information) [26].
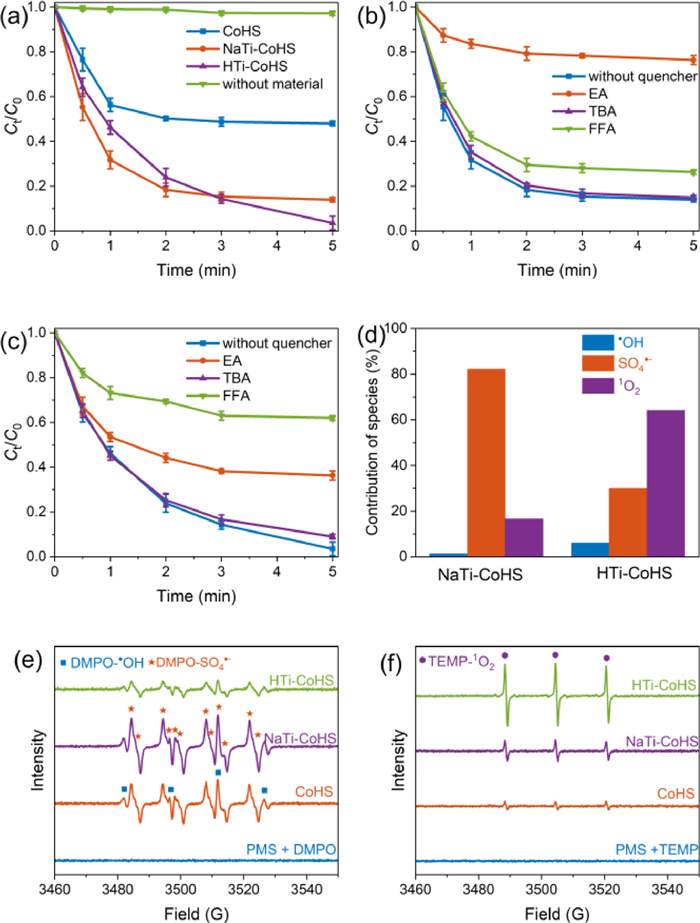
The first-order reaction rate constant in the NaTi-CoHS/PMS (1.15 min−1) system was 2.9 times as the CoHS/PMS (0.39 min−1) system, which is also higher than that in the HTi-CoHS/PMS system. Similar to the CoHS system, the quick kinetic reaction occurred at the start-up stage of reaction in the NaTi-CoHS system, due to the quick generation of active radicals after reacting with the PMS molecule. Although almost complete degradation of GAT was observed in the HTi-CoHS system, the less PMS decomposition implied the contribution of non-radical (Fig. S4). Moreover, the decorated TNTs also promoted the stability of composite material. In the CoHS-activated PMS system, the release of Co2+ reached 0.32 mg/L, while the release was negligible in the NaTi-CoHS system (0.004 mg/L) and HTi-CoHS system (0.006 mg/L) (Fig. S5 in Supporting information). Therefore, the grafting of TNTs on the surface of CoHS played important roles in both electron transfer for PMS activation and immobilization of Co-related species, due to the interlayer Na+/H+ structure and interfacial Ti–O–Co bond.
The contribution of reactive species, including •OH, SO4•− and 1O2, was further analyzed by quenching experiments. TBA, EA and FFA were added to quench •OH (k = 3.8 − 7.6 × 10⁸ L mol−1 s−1), both •OH (k = 2.8 × 10⁹ L mol−1 s−1) and SO4•− (k = 7.7 × 10⁷ L mol−1 s−1), and 1O2 (k = 1.2 × 10⁸ L mol−1 s−1), respectively (Figs. 2b and c) [33,34]. The degradation of GAT was almost not affected after the addition of TBA, indicating the negligible contribution of •OH both in the NaTi-CoHS and HTi-CoHS systems. in the CoHS-activated PMS system, the GAT degradation was completely inhibited after the addition of EA (Fig. S6 in Supporting information), indicating degradation of GAT in this system was almost all contributed by SO4•−. However, in the NaTi-CoHS system (Figs. 2b and d), the degradation efficiency of GAT decreased from 86.2% to 23.7% after the addition of EA, with the k1 decreased from 1.15 min−1 to 0.14 min−1. Then, SO4•− was confirmed as the main active species in the NaTi-CoHS reaction system. It is worth noting that > 15% of GAT could be still degraded after all the radicals were quenched, so other species (1O2) also formed in the system. After the addition of FFA to quench 1O2, the degradation rate decreased from 86.2% to 73.7%. A similar quenching result was also observed in the PMS activation for acetaminophen degradation [26]. Therefore, the generation of radicals including •OH and SO4•− was dominated by Co(Ⅱ) in CoHS, while the generation of 1O2 was attributed to the role of TNTs. In the HTi-CoHS/PMS system (Figs. 2c and d), the contribution of SO4•− reduced, as the degradation rate of GAT decreased from 96.6% to 63.7% after the addition of EA. 1O2 was considered the main species in this system, due to the more serious inhibition after the addition of FFA. Thus, the reactive species was regulated by the interlayer ion of Na+/H+ in TNTs. The contribution of different reactive species to GAT degradation was calculated based on the difference in value between the final degradation rates and then normalized (Text S7 in Supporting information). With the conversion of interlayer ions from Na+ to H+, the non-radical activation and contribution of 1O2 were promoted, with the occupation ratio from 16.5% to 64.1% (Fig. 2d). Specifically, the shorter O–H bond (~1 Å) in H2Ti3O7 can form hydroxyl groups and interlayer H2O molecule, where the produced hydrogen bond with PMS molecule was beneficial to the electron transfer process at the interface. But for Na2Ti3O7, the easily-dissociated Na–O bond (2.7 Å) inhibited the transformation of SO5•−, with negative charged [Ti3O7]2− on the surface [35]. On the other hand, H2Ti3O7 with lower symmetry was conducive to the adsorption of SO5•− and can also achieve interlayer electron transport through a hydrogen bond, rather than the electrostatic interaction of Na+ [36].
The EPR analysis further confirmed the production of different reactive species after PMS activation (Fig. 2e). No signal was observed with the addition of DMPO in the PMS solution. After the addition of catalysts, the signals of DMPO-SO4•− and DMPO-•OH were detected. Specifically, the quadruple peaks with a total spectra width of 45 G and hyperfine splitting constant of AN = AH = 15.0 G were attributed to DMPO-•OH [37]. The signal of DMPO-•OH was covered by other signals, due to the overlapping with DMPO-SO4•−. The integral signals of DMPO-•OH and DMPO-SO4•− were obtained by the fitting on the Easyspin software package (Fig. S7 in Supporting information). Although •OH had a minor contribution to GAT degradation, •OH was also formed via the transformation of SO4•− reacting with H2O or OH−. The signal with a stronger intensity with a total spectra width of 40 G and hyperfine splitting constant of AN = 13.8 G, AH = 10.2 G, AH = 1.4 G and AH = 0.8 G was attributed to DMPO-SO4•− [37]. The detection of DMPO-SO4•− and DMPO-•OH suggested the effective activation of PMS by all the materials. The amount of SO4•− in the NaTi-CoHS system was larger than that in the CoHS and HTi-CoHS systems, consistent with the reaction rate constants. Moreover, after the addition of TEMP, the weak signal of TEMP-1O2 with the hyperfine splitting constant of 16.0 G was observed (Fig. 2f) [37]. In contrast, the intensity of the TEMP-1O2 signal in the HTi-CoHS system was higher than that in the CoHS and NaTi-CoHS systems, further suggesting 1O2 was the primary reactive species in the HTi-CoHS/PMS system.
Although Co(OH)2 played an important role in the production of SO4•−, the enhanced degradation efficiency of GAT after TNTs decoration indicated that the surface TNTs was a component of considerable interest. Especially for the production of 1O2, H-TNTs can effectively adsorb the HSO5− molecule through the hydrogen bond, and then realize the transformation of SO5•− to 1O2. The reactions for PMS activation and GAT degradation in Ti-CoHS systems include (Eqs. 1-6):
|
|
(1) |
|
|
(2) |
|
|
(3) |
|
|
(4) |
|
|
(5) |
|
|
(6) |
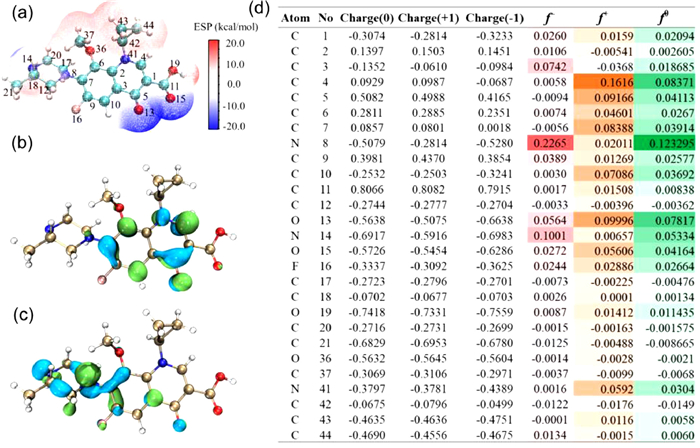
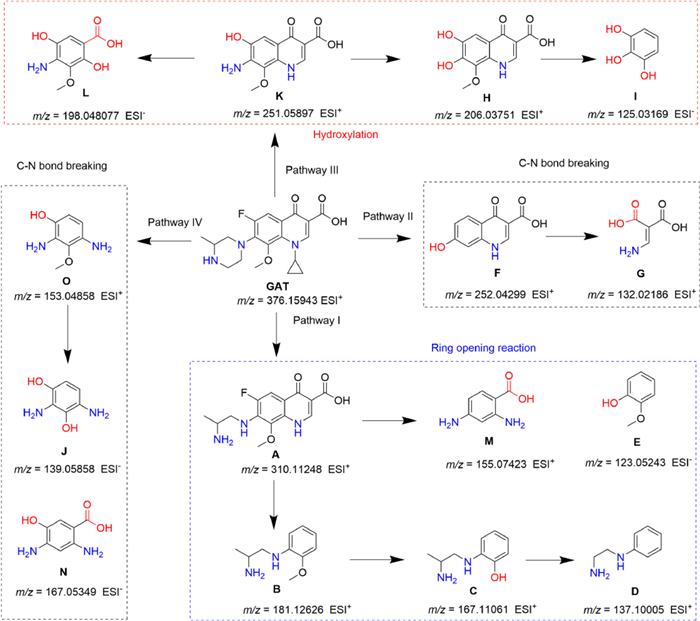
Generally, •OH tends to oxidize unsaturated bonds of pollutants, leading to partial oxidation; while SO4•− prefers to oxidize substances with a high average oxidation state of carbon atoms, resulting in the mineralization of pollutants [38]. In addition, 1O2 tends to induce double electron oxidation with characteristic sites, such as amino and thioether bonds [39]. Density functional theory (DFT) calculations on the Fukui index were further introduced to investigate the reactive sites in the GAT molecule (Fig. 3). The primary reactive species (SO4•− and 1O2) contributed to GAT degradation tend to occur in the electrophilic attack reaction, such as hydrogen atom abstraction and radical adduct formation. The Fukui index (f−) was used to represent the active sites for the electrophilic attack. The 8N (f− = 0.2265), 14N (f− = 0.1001) and 3C (f− = 0.0742) with the highest Fukui values were the most active sites, especially for the piperazine ring group. To explore the degradation pathway of GAT, the intermediates produced in this AOP were detected by high-resolution mass spectrometer (Table S3 in Supporting information). The proposed GAT degradation pathway is depicted in Fig. 4, which includes three main pathways: 1) Ring-opening reaction (Pathway Ⅰ), C–N bond breaking (Pathway Ⅱ and Ⅳ), and hydroxylation (Pathway Ⅲ). Specifically, the simultaneous attack at 8N and 14N sites with the highest f− values led to the degradation pathway I (GAT → A → B → C → D → M/E), attributed to the fracture after cyclization by 1O2 or the hydrogen atom abstraction by SO4•−. The generation of products F (Pathway Ⅱ) and K (Pathway Ⅲ) was assigned to the direct attack of SO4•− at the 8N site, and coincided with the Fukui index (f−) (Fig. 3d). The cleavage or hydrolysis of cyclopropyl and ether bonds was also observed, owing to the electrophilic attack of SO4•−. Pathway Ⅲ (GAT → K → H/L → I) proceeded after the attack at 8N–12C and 8N–17C sites, while pathway Ⅱ (GAT → F → G) and pathway Ⅳ (GAT → O/N → J) was attributed to the attack at 8N–7C site by SO4•−, followed by the hydrolysis reaction and hydroxylation reaction. It was worth noting that most of the products were defluorinated compounds, thus greatly reducing the toxicity of pollutants. Although the GAT molecule was degraded to small molecular compounds, deep oxidation and mineralization was expected under longer reaction time and larger PMS dosage.
In this study, reactive species generated in a heterogenous PMS activation system were successfully regulated by the interlayer ions Na+/H+ of TNTs supported on Co(OH)2 hollow microsphere (Ti-CoHS). The synthesized Ti-CoHS materials showed a structure of open tubular TNTs decorated on the Co(OH)2 hollow microsphere. CoHS was considered the key component for the generation of SO4•−, while TNTs (especially H-TNTs) promoted the transformation of SO5•− to 1O2 by hydrogen interaction on the surface. Both NaTi-CoHS and HTi-CoHS achieved efficient PMS activation for GAT degradation, and HTi-CoHS even exhibited a relatively high degradation efficiency of 96.6% within 5 min. With the interlayer ion of TNTs transforming from Na+ to H+, more 1O2 was produced and contributed to GAT degradation, benefiting from the interlayer electron transfer through hydrogen bonding of H+/–OH, rather than the electrostatic interaction of Na+. Quenching experiments and EPR tests confirmed the primary contribution of SO4•− and 1O2 for GAT degradation. DFT calculations and mass spectrographic analysis revealed that the degradation pathway was driven by the cleavage of C–N bond at the 8N site. This work can give new insights into the regulation of catalysts on reactive species in water treatment process and promotes the understanding of pollutant degradation reaction mechanism in AOP.
The authors declare that they have no known competing financial interests or personal relationships that could have appeared to influence the work reported in this paper.
This work was financially supported by the National Key Research and Development Program of China (No. 2021YFA1202500), National Natural Science Foundation of China (NSFC) (Nos. 52270053, 52200083 and 52200084), Beijing Nova Program (No. 20220484215), China Postdoctoral Science Foundation (No. 2021M700213), the Key Special Projects for Science and Technology of Inner Mongolia (No. 2021EEDSCXSFQZD001), and Emerging Engineering Interdisciplinary-Young Scholars Project, Peking University, the Fundamental Research Funds for the Central Universities.
Supplementary material associated with this article can be found, in the online version, at doi:
Y. Peng, W. Fang, M. Krauss, et al., Environ. Pollut. 241 (2018) 484–493. doi: 10.1016/j.envpol.2018.05.061
Q. Zhang, C. Yu, L. Fu, S. Gu, C. Wang, Environ. Sci. Technol. 54 (2020) 4465–4474. doi: 10.1021/acs.est.9b07874
H. Wang, H. Xi, L. Xu, et al., Sci. Total Environ. 788 (2021) 147819. doi: 10.1016/j.scitotenv.2021.147819
H. Dong, Y. Chen, J. Wang, et al., J. Hazard. Mater. 403 (2021) 123961. doi: 10.1016/j.jhazmat.2020.123961
S.M. Zainab, M. Junaid, N. Xu, R.N. Malik, Water Res. 187 (2020) 116455. doi: 10.1016/j.watres.2020.116455
J. Lyu, L. Yang, L. Zhang, B. Ye, L. Wang, Environ. Pollut. 266 (2020) 115147. doi: 10.1016/j.envpol.2020.115147
S. Li, W. Shi, W. Liu, et al., Sci. Total Environ. 615 (2018) 906–917. doi: 10.1016/j.scitotenv.2017.09.328
Y. Yang, W. Song, H. Lin, et al., Environ. Int. 116 (2018) 60–73. doi: 10.1016/j.envint.2018.04.011
K. Anagnostopoulpou, C. Nannou, V.G. Aschonitis, D.A. Lambropoulou, Sci. Total Environ. 849 (2022) 157887. doi: 10.1016/j.scitotenv.2022.157887
K.P. Mangalgiri, T. Ibitoye, L. Blaney, Sci. Total Environ. 835 (2022) 155508. doi: 10.1016/j.scitotenv.2022.155508
L.Y. Wang, J. Di, J. Nie, G.P. Ma, A.C.S. Appl. Nano Mater. 2 (2019) 6998–7007. doi: 10.1021/acsanm.9b01505
Q. Yang, Y. Ma, F. Chen, et al., Chem. Eng. J. 378 (2019) 122149. doi: 10.1016/j.cej.2019.122149
X. Tao, P.Y. Pan, T.B. Huang, et al., Chem. Eng. J 395 (2020) 125186. doi: 10.1016/j.cej.2020.125186
C.Q. Zhu, F.Q. Liu, C. Ling, et al., Appl. Catal. B-Environ. 242 (2019) 238–248. doi: 10.1016/j.apcatb.2018.09.088
S.J. Yang, X.J. Qiu, P.K. Jin, et al., Chem. Eng. J. 353 (2018) 329–339. doi: 10.1016/j.cej.2018.07.105
Y. Zhang, J. Zhou, J. Chen, X. Feng, W. Cai, J. Hazard. Mater. 392 (2020) 122315. doi: 10.1016/j.jhazmat.2020.122315
M.J. Pu, J.F. Niu, M.L. Brusseau, et al., Chem. Eng. J. 394 (2020) 125044. doi: 10.1016/j.cej.2020.125044
L.S. Zhang, X.H. Jiang, Z.A. Zhong, et al., Angew. Chem. Int. Ed. 60 (2021) 21751–21755. doi: 10.1002/anie.202109488
W.J. Ma, N. Wang, Y.A. Fan, et al., Chem. Eng. J. 336 (2018) 721–731. doi: 10.1016/j.cej.2017.11.164
Y. Gong, B. Yang, H. Zhang, X. Zhao, J. Mater. Chem. A 6 (2018) 23703–23711. doi: 10.1039/c8ta07915c
M. Frisch, G. Trucks, H. Schlegel, et al., Gaussian 16 Revision C. 01, 2016.
H. Ji, J. Ni, D. Zhao, W. Liu, ACS ES & T Eng. 2 (2022) 1015–1038. doi: 10.1021/acsestengg.1c00451
T. Deng, W. Zhang, O. Arcelus, et al., Nat. Commun. 8 (2017) 15194. doi: 10.1038/ncomms15194
X. Li, W. Liu, J. Ni, Microporous Mesoporous Mater. 213 (2015) 40–47. doi: 10.1016/j.micromeso.2015.04.018
X. Tao, P. Pan, T. Huang, et al., Chem. Eng. J. 395 (2020) 125186. doi: 10.1016/j.cej.2020.125186
H. Ji, P. Du, D. Zhao, et al., Appl. Catal. B: Environ. 263 (2020) 118357. doi: 10.1016/j.apcatb.2019.118357
T. Zhao, H. Jiang, J. Ma, J. Power Sources 196 (2011) 860–864. doi: 10.1016/j.jpowsour.2010.06.042
T. Xue, X. Wang, J.M. Lee, J. Power Sources 201 (2012) 382–386. doi: 10.1016/j.jpowsour.2011.10.138
W. Liu, T. Wang, A.G.L. Borthwick, et al., Sci. Total Environ. 456-457 (2013) 171–180. doi: 10.1016/j.scitotenv.2013.03.082
Q. Zhang, W. Xiao, W.H. Guo, et al., Adv. Funct. Mater. 31 (2021) 2102117. doi: 10.1002/adfm.202102117
L. Wang, B. Cheng, L. Zhang, J. Yu, Small 17 (2021) 2103447. doi: 10.1002/smll.202103447
Y. Zhang, Y. Zhang, Y. Huang, et al., J. Alloys Compd. 867 (2021) 159020. doi: 10.1016/j.jallcom.2021.159020
J. Kim, T. Zhang, W. Liu, et al., Environ. Sci. Technol. 53 (2019) 13312–13322. doi: 10.1021/acs.est.9b02991
J. Lee, U. von Gunten, J.H. Kim, Environ. Sci. Technol. 54 (2020) 3064–3081. doi: 10.1021/acs.est.9b07082
S.A.H. Abass, N. Seriani, Physica Status Solidi 255 (2018) 1700612. doi: 10.1002/pssb.201700612
M. Mori, Y. Kumagai, K. Matsunaga, I. Tanaka, Phys. Rev. B 79 (2009) 144117. doi: 10.1103/PhysRevB.79.144117
L. Chen, J. Duan, P. Du, et al., Water Res. 221 (2022) 118747. doi: 10.1016/j.watres.2022.118747
P. Gan, Y. Sun, Y. Li, et al., Chemosphere 311 (2023) 137009. doi: 10.1016/j.chemosphere.2022.137009
A.A. Ghogare, A. Greer, Chem. Rev. 116 (2016) 9994–10034. doi: 10.1021/acs.chemrev.5b00726

Figure 1 TEM images of (a) CoHS, (b) NaTi-CoHS and (c-e) HTi-CoHS. (f) XRD pattern of CoHS, NaTi-CoHS and HTi-CoHS. High-resolution XPS spectra of (g) Na 1s, (h) O 1s and (i) Co 2p in CoHS, NaTi-CoHS and HTi-CoHS.

Figure 2 GAT degradation in various PMS activation systems: (a) Degradation kinetics by using different materials; Scavenger quenching experiments in the (b) NaTi-CoHS and (c) HTi-CoHS activated PMS systems; (d) The contribution of different reactive species; (e) EPR analysis of •OH and SO4•− after the addition of DMPO in aqueous solution; (f) EPR analysis of 1O2 after the addition of TEMP in aqueous solution. Experimental conditions: Initial GAT concentration = 10 µmol/L, PMS concentration = 0.1 mmol/L, material concentration = 0.1 g/L, and pH 5.0, quencher concentration = 50 mmol/L.

Figure 3 Natural bond orbital analysis for the GAT molecule at B3LYP/6–311G* level. (a) Electrostatic potential of GAT molecule; (b) The lowest unoccupied molecular orbital (LUMO) and (c) the highest occupied molecular orbital (HOMO) of GAT; (d) Natural population analysis (NPA) charge populations and condensed Fukui index distribution for electrophilic attack (f−) of GAT molecule.

 扫一扫看文章

扫一扫关注我们
 DownLoad:
 下载:
下载:
