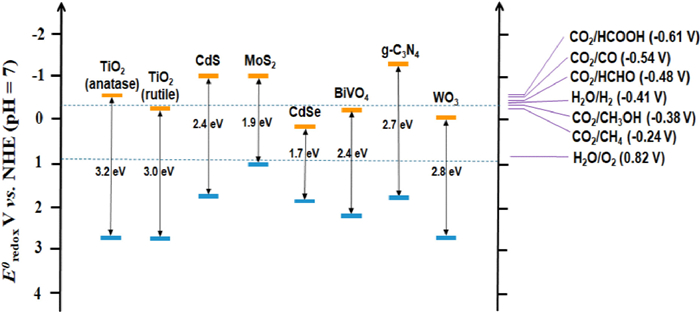
Figure 1.
Band gap energy levels for general utilized photocatalysts.
Ordered macroporous structured TiO2-based photocatalysts for CO2 reduction: A review
Yifei Li , Yuechang Wei , Wenjie He , Zhiling Tang , Jing Xiong , Zhen Zhao

In the past decades, fossil fuels (oil, coal and natural gas) are still the main sources of energy consumption, provide more than 80% of the global energy demand [1,2]. The excessive combustion of fossil fuel results in the steadily increasing of annual CO2 emissions [3,4], which is the main cause of greenhouse effect. Thus, the development of sustainable and environmentally friendly energy resources with reducing CO2 emissions is an urgent task related to the long-term development of human society [5,6]. Photocatalytic reduction of CO2 is an effective strategy to solution the above crises [7]. Solar energy can be made use of converting CO2 into value-added chemicals, which can reduce CO2 emissions and develop alternative fuel energy [8,9].
In the photoreduction of CO2, the semiconductor catalysts with appropriate band gaps need to be considered that the conduction band potential is more negative than the reduction potential of the reaction for CO2 reduction. As shown in the analysis results of Fig. 1 [10–12] the conduction band position of TiO2-based semiconductor is more negative than that of CO2 reduction to CH4, and the valence band position is more positive than that of H2O oxidation to O2. When the reduction potential and oxidation potential of the reaction are between conduction band (CB) and valence band (VB), the photogenerated electrons and holes can be used to the maximum extent [13].
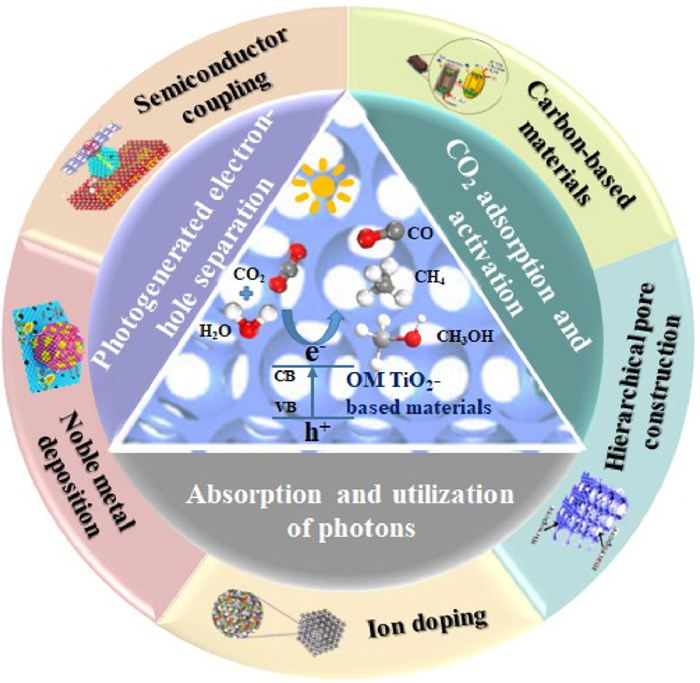
Light source and the catalysts are two important factors affecting photocatalytic reduction of CO2. The interface is not only the place of reaction, but also the place of light absorption in the case of photocatalysis reaction. Therefore, the construction of high pore morphology is usually the direct way to optimize the photocatalytic efficiency. Order macroporous (OM) structure of optical crystal catalysts, also known as inverse opal structure, is composed of highly ordered and tightly connected pores with high porosity and surface area. OM structure in the crystal morphology has slow photon effect [14], which can use the refraction principle to extend the light wave path and make full use of ultraviolet light. OM structured TiO2 can provide the additional space for CO2 absorption and diffusion separation of reduction products. Furthermore, in order to further enhance the photocatalytic activity of CO2 reduction and improve the adsorption efficiency of CO2, it is necessary to modify the surface of OM structured TiO2-based catalysts (Fig. 2) [15–17].
The CO2 reactant is a typical symmetrical triatomic molecule of O=C=O straight-line structure with high thermodynamic stability [18]. Compared with the bond energies of C—C (336 kJ/mol), C—H (411 kJ/mol) and C—O (327 kJ/mol), the O=C=O straight-line bond has higher binding energy (803 kJ/mol), thus, the breaking of C=O double bond in the process of transforming CO2 into other hydrocarbons needs to large energy. Basis on the structure of CO2 molecular, it is a weak electron donor and a strong electron acceptor. An effective way of CO2 activation is to provide electrons in a proper way, or capture electrons from other molecules in the process of reaction. Obviously, the continuous solar energy can provide suitable energy for CO2 conversion, but under the UV–vis radiation with the wavelength of 200–900 nm, CO2 molecular is optically inert. In this case, the photocatalysts with suitable energy band are needed to generate photocarriers under the excitation of sunlight, and then the photoelectrons combine with CO2 to complete the reduction reaction of CO2.
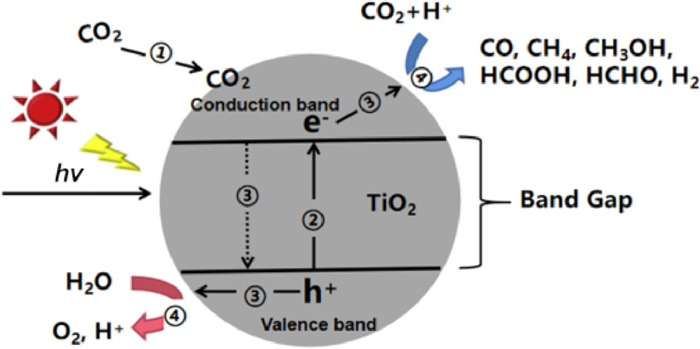
TiO2, as a semiconductor material, its internal energy band structure is characterized by the discontinuity of valence band and conduction band. There is an empty energy region between them, which is called forbidden band. Photocatalytic CO2 reduction can simulate the natural light synthesis system, and convert the incident solar energy into valuable solar fuel without other high energy input. Whether a photocatalyst can be excited by light to produce electron-hole pairs is related to its band width, the narrower the band width, the wider the light absorption range, and the easier it is to be excited by light. It is generally believed that the photocatalytic reduction of CO2 on TiO2 with H2O includes the following four main steps, which can be illustrated as in Fig. 3 [19–21]. The detail steps of CO2 reduction are exhibited in Supporting information. At 298 K and 1 atm pressure, the standard oxidation–reduction potentials for different CO2 reduction are listed in Eqs. 1-9 [22–24].
|
|
(1) |
|
|
(2) |
|
|
(3) |
|
|
(4) |
|
|
(5) |
|
|
(6) |
|
|
(7) |
|
|
(8) |
|
|
(9) |
The diffusion rate of molecules and ions is one of the key factors affecting the catalytic performances for CO2 reduction [25,26]. According to calculation and experiment, it is known that the optical gap ratio of the photocatalyst is related to the diffusion rate [27], and the porosity is closely related to the specific surface area. To some extent, the crystal morphology is a key factor affecting the photocatalytic performance of semiconductors [28,29]. The OM structured materials have the characteristics of general porous materials, and have the advantages of periodic arrangement of pores, uniform distribution and 3D ordered overall structure. The periodic structure of 3D optical materials can suppress the propagation of light through the effect of band gap scattering, increase the path length of light through “slow photon effect” [30,31], and generate forbidden band reflection due to the diffraction of Prague. The preparation process of OM TiO2-based catalysts is shown in Fig. S1 (Supporting information).
The internal structure of the 3D cross-linked macroporous network can effectively reduce the resistance of mass transfer, and the macroporous channel are arranged and distributed periodically, which is conducive to the diffusion and mass transfer of macromolecular reactants between the catalyst surface and the catalyst body [32–34]. OM materials can also be used as catalysts with larger specific surface area, so that the catalysts have more reaction active points, which effectively enhances the degradation activity of the catalyst [35,36]. It is proved that the porous TiO2 has a wide application prospect in the field of photocatalysis (examples in Figs. S2 and S3 in Supporting information).
The doping of ions can be divided into metal ion/cation doping and non-metal ion/anion doping (Fig. 4) [37]. Since the 1980s, TiO2 has been widely reported to enhance its visible light absorption and charge separation performance and improve its photocatalytic performance by doping ions in TiO2 [38,39]. It has been proved that the metal ion/metal oxide doping could reduce the band gap energy level of TiO2 to a certain extent [40], which made the light response range of TiO2 red shift to the visible light part [41,42]. The ions doped TiO2-based photocatalysts for CO2 reduction are showed in Table S1 (Supporting information).
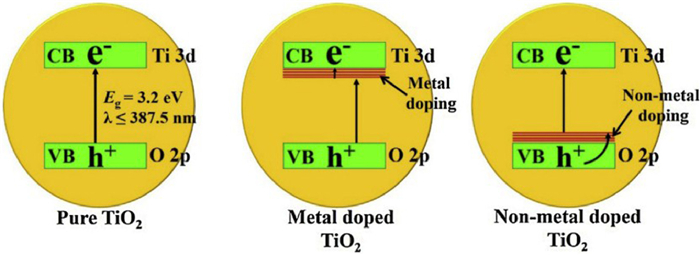
Through metal doping, energy bands can be generated under the conduction band of TiO2, and the introduction of new energy levels can improve the utilization efficiency of the whole spectrum. The visible light response can be adjusted by doping low band gap metal to reduce the absorption edge of TiO2. In short, the doped metal acts as an electron receiver to capture the excited electrons produced by the valence band (Fig. 5A) [43].
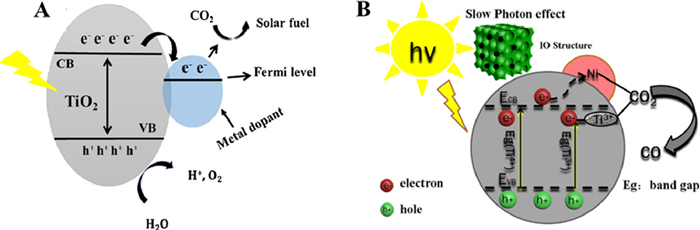
According to the study results, Ni element had low price and high thermal catalytic activity. It is an ideal dopant (Fig. 5B) that can replace the titanium atom in the lattice to construct impurity energy levels in the TiO2 band gap, and introduce new energy level to produce visible light response to TiO2, which can improve its comprehensive utilization of light. For instance, as shown in Fig. 6A, Ye and coauthors [44] synthesized 3D nickel doped OM black TiO2 by hydrogenation. OM black TiO2/Ni was used as a versatile and excellent CO2 reduction photocatalyst by coupling the slow photon effect of the OM structure, the high separation efficiency of Ni-doped TiO2, and the disorderly nature of the black TiO2 hydrogenation surface. The SEM images of OM TiO2 showed that the black pores were the cavities formed during the calcination process, while the white skeleton represented the pore walls of TiO2 with an ordered and interconnected macropore structure. The morphology of the material did not change after doping with Ni (Fig. S5 in Supporting information). TEM images indicated that the addition of Ti3+ results in the formation of about 1 nm disordered layer over the surface. The results showed that the disordered layer and nickel element were introduced into OM TiO2/Ni, so that the absorption of visible light by OM TiO2/Ni with low bandgap was significantly stronger than that of other materials (Fig. 6B). The band gap energies of commercial-P25, OM TiO2 and OM TiO2/Ni calculated by tangential method were 3.12, 2.34 and 1.71 eV, respectively (Fig. 6C), the lower the energy band gap, the larger the range of wavelengths available. The results in Fig. 6D showed that the significant decrease in the OM TiO2/Ni signal indicates a low recombination rate of electron and hole. In addition, the introduction of Ni transfers electrons from the black TiO2 to the Ni surface, which can suppress the rapid compounding of electrons and holes. The formation rate of CO product over OM TiO2/Ni catalyst was 12.1 µmol g−1 h−1, which was 10.1 and 2.0 times higher than commercial-P25 and OM TiO2, respectively. Fig. 6E showed that OM TiO2/Ni could be used as a stable and efficient CO2 photocatalytic reductant.

Generally, the doping of non-metallic elements, such as N [45,46], S [47] or C [48,49] elements, is done by replacing part of O in TiO2 with anions to form TiO2−xAx (A represents non-metallic elements) crystals (Fig. 4). As the 2p orbital of O hybridize with the p orbital of non-metallic energy level close to its energy, the valence band is widened and the band gap width is correspondingly reduced. In conclusion, non-metals doping reduces the band gap of TiO2 via introducing new energy states into the valence band [50], which broadens the light response range of TiO2 [51].
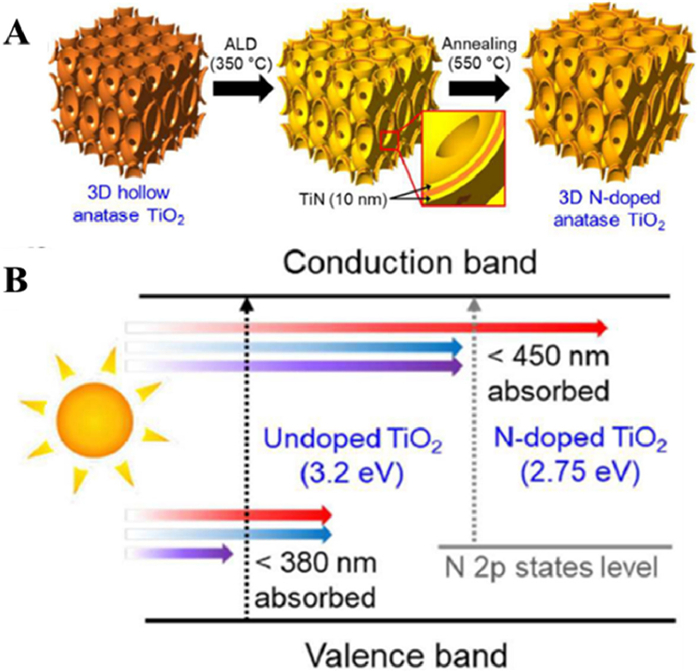
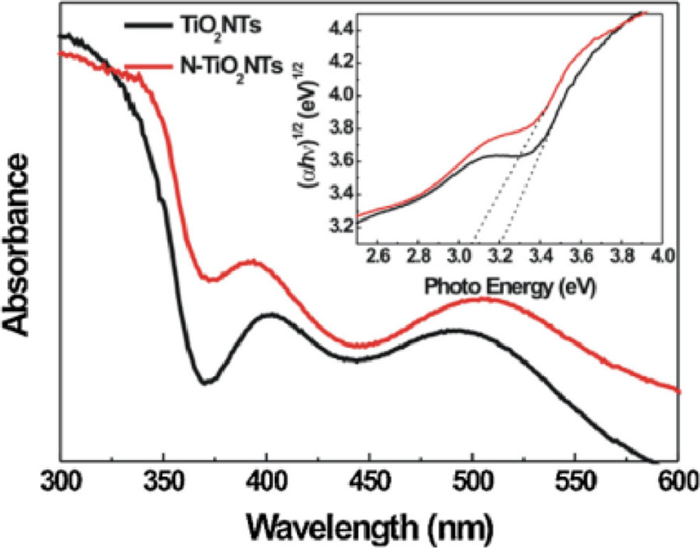
Asahi and coauthors [52] calculated the energy density of state of anatase-type TiO2 doped with C, N, S and P instead of O and found that doping with N was the most effective for a reason that N element is closer to the O element and the radius of N atom is as similar as O atom. In fact, as early as 1986, Sato [53] had reported that the addition of N into the TiO2 lattice would cause visible light response. In recent years, N doping has become a research hotspot. Cho and coauthors [54] prepared 3D nanostructured N-doped TiO2 monomers with thin layers of about 10 nm by atomic layer deposition (Fig. 7A). Compared with pure OM TiO2 of the same thickness, the band gap of the N-doped TiO2 was reduced by 3.2 to 2.75 eV, and the photocatalytic performance was improved by about 33% (Fig. 7B). The absorbance of N-doped TiO2 was higher than that of undoped TiO2 in the whole UV and visible wavelengths (300–800 nm). Moreover, Li and coauthors [55] firstly reported a novel and efficient 3D nanorod catalyst synthesized by surface-reaction-limited pulsed chemical vapor deposition technology in TiO2 nanorods doped with N elements. They found that N doping reduced the band gap of TiO2 nanorods and effectively activated the optical activity of visible light. In the UV range, the conversion efficiency of incident photons to current was greatly improved. On this basis, Sun and coauthors [56] synthesized N-doped TiO2 nanotube arrays by using a simple and safe hydrothermal method. The mixing of the electronic states of the 2p orbitals of N and the 2p orbitals of O that led to a narrowing of the band gap and a slight red-shift of the intrinsic absorption band, and the doping of N caused the TiO2 nanotubes to exhibit catalytic activity in the visible region (Fig. 8).
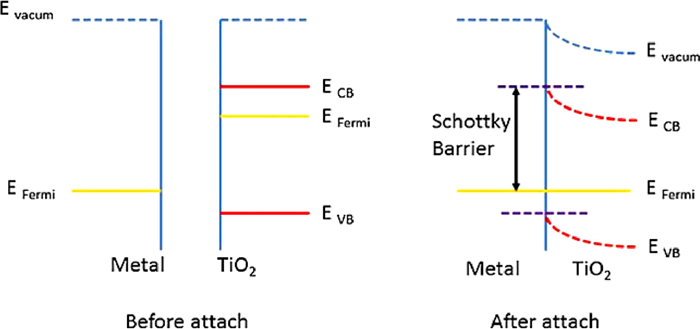
In principle, the Fermi energy level of metal nanoparticles is lower than the conduction band of TiO2, which creates the Schottky barrier between the metal-TiO2 interface (Fig. 9). Under the condition of illumination, photogenerated electrons are rapidly transferred to the metal surface through the Schottky barrier until their Fermi energy levels equal [57–59]. The noble metals supported on the surface of TiO2 can influence the selectivity of photocatalytic reduction of CO2 [60,61]. Ishitani and coauthors [62] showed that the main product of photocatalytic reduction of CO2 was methane when Pt and Pd were supported on TiO2 surface, while acetic acid was the main product when Ru, Rh, Au was supported.
Surface plasmon resonance (SPR) is the collective oscillation of electrons in metal nanoparticles such as Au, Ag and Pt and their interaction with resonance photons. When the wavelength of the incident photon matches the natural frequency of the free electron oscillation on the plasmonic metal surface, a resonance can be formed. The generation of electron hole pairs in plasma metal under light irradiation is shown in Figs. S6A and B (Supporting information). The SPR excited electrons (so-called hot electrons) have high energy and can be directly transferred to the semiconductor to induce the photocatalytic reaction (Figs. S6C and D in Supporting information).
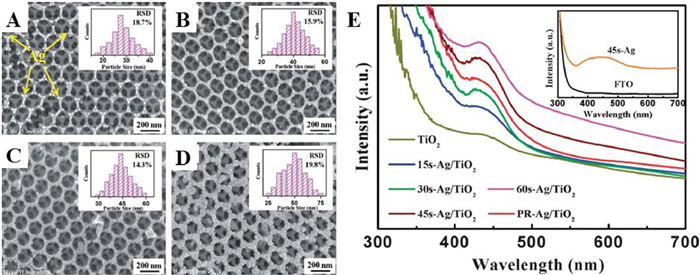
For example, the macroporous structure of OM TiO2 synthesized by Zhao and coauthors [63] and the plasmon resonance effect of deposited Ag nanoparticles synergistically modified TiO2 physically and chemically, which significantly enhancing visible light photocatalytic performance (Fig. S7 in Supporting information). Analogously, Chen and coauthors [64] used a pulse current deposition method to prepare OM TiO2 coated with highly dispersed Ag nanoparticles as plasma photocatalyst driven by visible light. Figs. 10A-D show that the size of the Ag nanoparticles gradually enlarges as the deposition time increases to 45 s while maintaining a high dispersion. In addition, no agglomerations of Ag nanoparticles were observed to block the pores of Ag/TiO2 samples. As shown in Fig. 10E, in contrast to the pure OM TiO2, all of Ag/TiO2 composites exhibit strong absorption in the range of 380–500 nm. The absorption intensity of the corresponding samples increased with the addition of deposition time. The excellent SPR properties of Ag nanoparticles and the homogeneous dispersion of Ag nanoparticles for photoexcited electrons make the compound material with good electron-hole separation efficiency and photocatalytic reduction of polluting gasses.
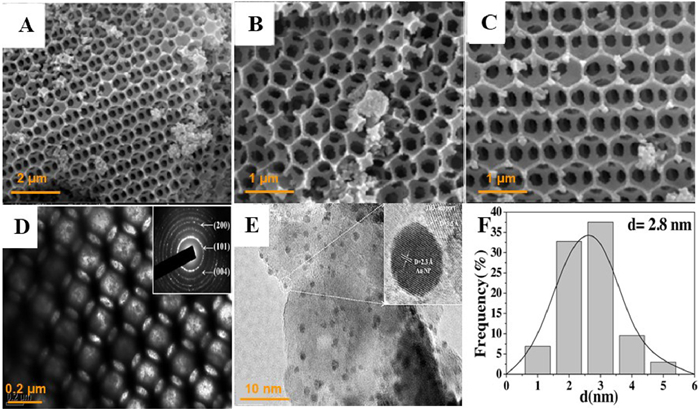
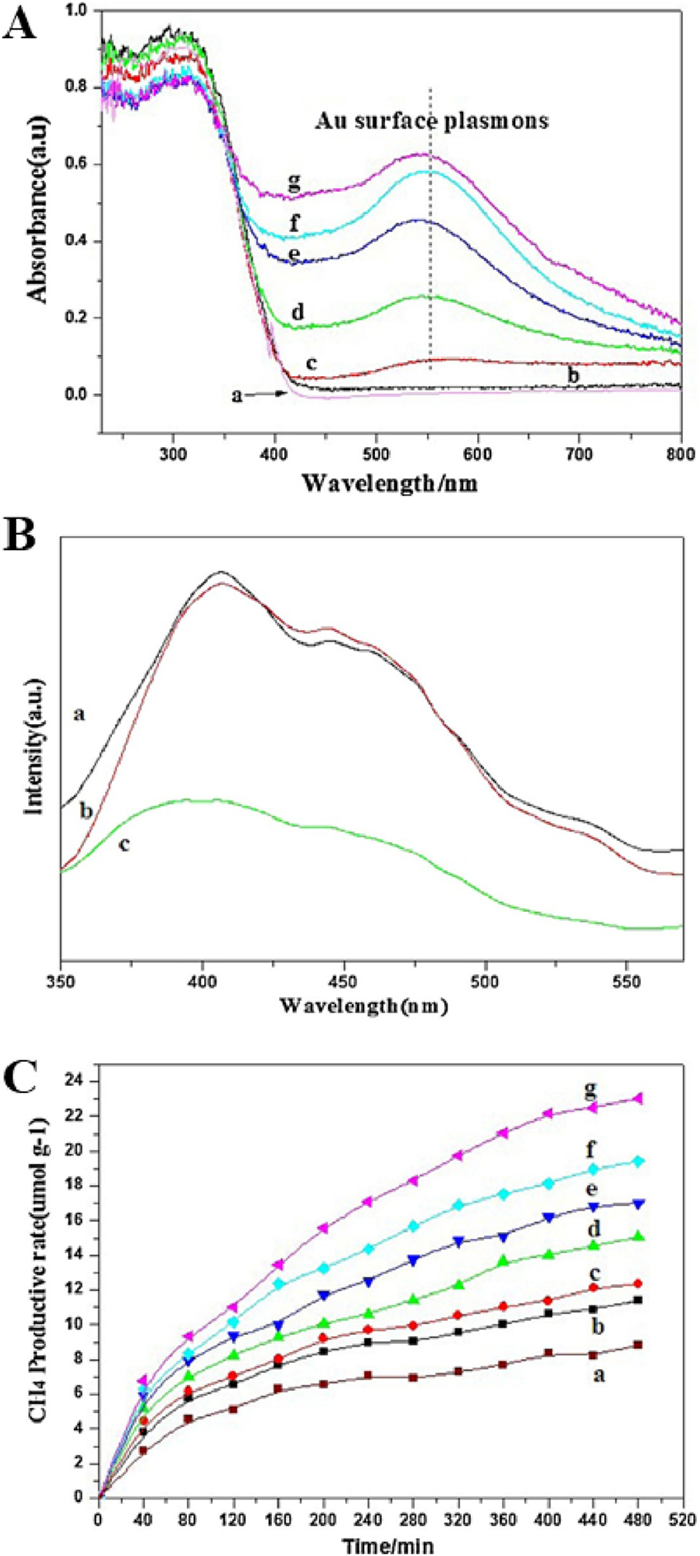
Jiao and coauthors [65] systematically investigated effect of Au nanoparticle supporting on photocatalytic CO2 reduction activity of three-dimensionally ordered macroporous (3DOM) TiO2. Au nanoparticles with different concentrations as well as uniform sizes of were loaded onto 3DOM TiO2 using a unique and facile method of gas bubbling-assisted membrane reduction (GBMR). The morphological structure of the 3DOM Aux/TiO2 material obtained by GBMR is consistent with that of the 3DOM TiO2-carrier obtained after calcination of the template PMMA, and all Au nanoparticles were highly dispersed and uniform in size (Figs. 11A-F). Compared with commercial-P25, the absorption of 3DOM TiO2 was slightly red shifted (Fig. 12A). By loading Au nanoparticles, a broad absorption peak was found at about 550 nm, which was attributed to the collective oscillation of the free conduction band electrons on Au nanoparticles interacting with the incident electromagnetic radiation. With the increase of Au loading, the absorption efficiency of visible light increased significantly. In addition, all samples showed obvious PL signal, and the luminescence intensity of Au nanoparticles decreased after deposition (Figs. 12B). Therefore, the CH4 content of the optimized 3DOM Au8/TiO2 catalyst for photocatalytic CO2 reduction was 2.6 and 2 times higher than 3DOM-TiO2 and commercial-P25, respectively (Figs. 12C).
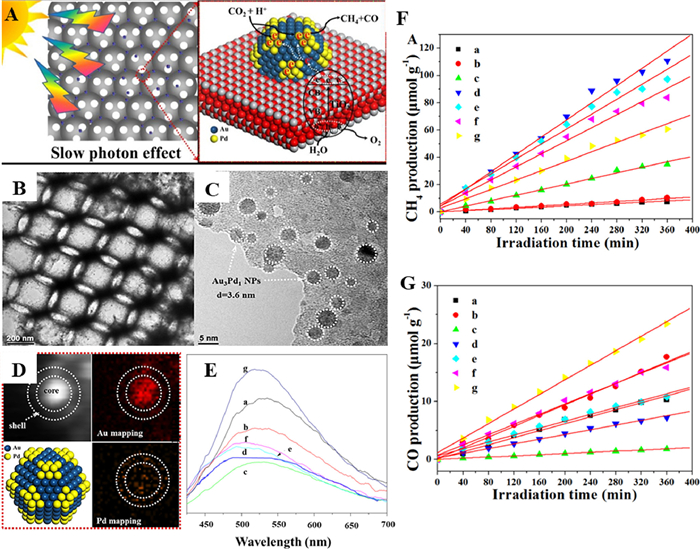
The state energy of Fermi level of noble metal is lower than the edge of TiO2 conduction band, the photogenerated electrons excited to the conduction band can be quickly transferred and captured on the surface of noble metal, realizing the separation of photogenerated electron-hole pairs. Jiao and coauthors [66] successfully fabricated a series of novel core-shell structured AuPd nanoparticles bi-functional catalysts loaded on 3DOM TiO2 (AuPd/3DOM TiO2) using a facile one-pot method of GBMR (Fig. 13A). The TEM image (Figs. 13B and C) could be clearly seen the ordered overlapping macropores and the AuPd nanoparticles were uniformly dispersed on the 3DOM TiO2. Fig. 13D indicated that Au was enriched in the core and Pd was gathered in the shell. The synergistic effect of core-shell type Au-Pd nanoparticles became the design highlight of the material. Among these samples, the PL intensity of catalyst Au3Pd1/3DOM-TiO2 was the lowest, so an appropriate Au/Pd ratio could effectively improve the separation efficiency of photogenerated electron-hole pairs (Fig. 13E). Compared to 3DOM TiO2, the product of CO2 reduction by Au nanoparticles were more inclined to CH4 with a selectivity of 95.08% for CH4, which inhibited the formation of CO. The introduction of Pd nanoparticles significantly increased the total production rate of CH4 and CO. In particular, among Au-Pd bimetal loaded composite, the selectivity of Au3Pd1/3DOM-TiO2 to CH4 was the highest (93.91%), and the CH4 production rate was up to 18.5 µmol g−1 h−1 (Figs. 13F and G).
The structure design of the interface is related to the photoelectrochemical properties of the catalyst, in the study of improving the performance of TiO2, the construction of heterojunction is one of the most used methods [67,68]. The recombination of two semiconductors can accumulate photogenerated electrons and holes on different semiconductors to achieve effective separation of photogenerated carriers [69], which prevents the bulk phase and surface recombination of certain electrons and holes [70,71]. There are four types of OM TiO2-based heterostructures for photocatalytic reduction of CO2 as followed (Fig. 14), including conventional type-Ⅱ, p-n, direct Z-scheme and indirect Z-scheme heterojunction [72,73].
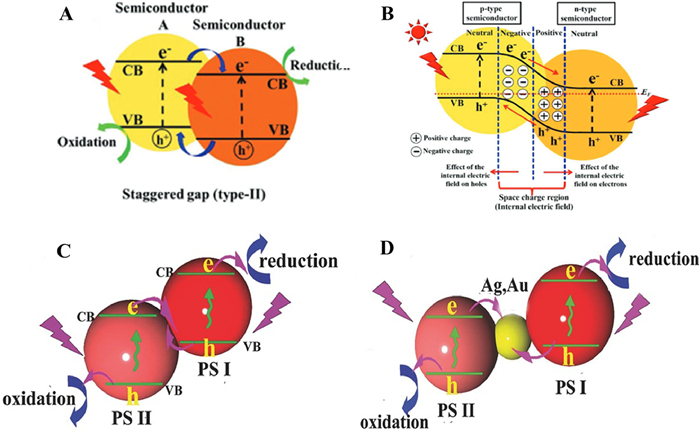
The conventional type-Ⅱ heterojunction has been used to improve the performance of photocatalytic CO2 reduction on account of the different arrangement of energy level [74]. The traditional type-Ⅱ heterojunction is formed by combining semiconductor Ⅰ with semiconductor Ⅱ with higher conduction band and lower valence band [75–77]. Under the irradiation of sunlight, photogenerated electrons from semiconductor Ⅰ to semiconductor Ⅱ [78,79].
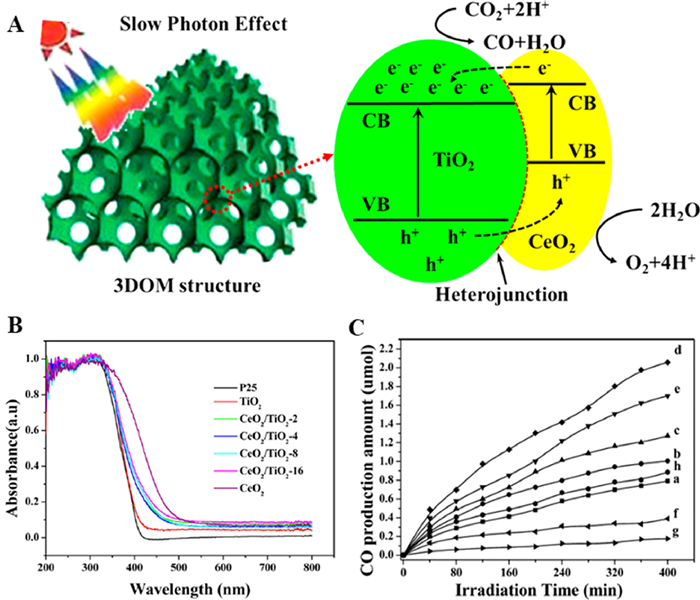
CeO2 has a narrow band gap (2.81 eV), which can absorb visible light [80]. Zhao and coauthors [81] successfully synthesized 3DOM CeO2/TiO2 heterojunction photocatalyst with different mass ratio and high photocatalytic performance for CO2 reduction (Fig. 15A). 3DOM TiO2 with large specific surface area provides a rich coupling interface for CeO2. The loading of semiconductor CeO2 extended the absorption edge of TiO2 at 380 nm to the visible light range (Fig. 15B), which improved the light utilization efficiency. The amount of CO produced by CO2 photocatalytic reduction under simulated light conditions is shown in Fig. 15C. It was found that 3DOM TiO2/CeO2–4 had the highest catalytic activity, produced the highest amount of CO (2.06 µmol). These results indicated that the synergistic effect of photonic crystal and the heterojunction between TiO2 and CeO2 enhance the photocatalytic performance.
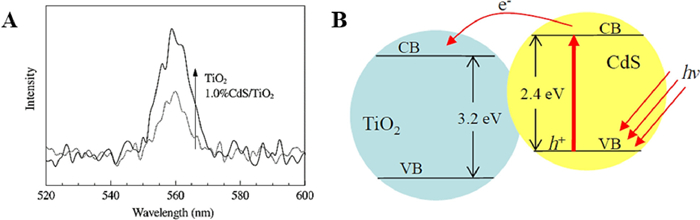
CdS is widely used in TiO2 sensitization driven by visible light because of its reasonable band gap (2.43 eV) well matched with the solar visible spectrum [82]. A series of characterization tests by Xie [83] and coauthors showed that the catalytic activity of the CdS-sensitized 3DOM TiO2 films under visible light was much higher than that of the non-CdS-sensitized 3DOM TiO2 films and the CdS-loaded TiO2 films that did not form an OM structure, and the results demonstrated that a heterojunction structure was established between them to facilitate the effective separation of photogenerated electrons and holes. Besides, Chen and coauthors [84] prepared 3DOM CdS/TiO2 films using a generalized sol-gel method. As shown in Fig. 16A, with the benefit of photoexcited electron transfer from CdS to the conduction band of TiO2, which promotes the separation of electrons and holes, the PL peak intensity of CdS/TiO2 composites is lower than that of pure TiO2 (Fig. 16B).
Indeed, the p-n heterojunction can be constructed between n-type semiconductor TiO2 and p-type semiconductor with a matching electronic band structure [85,86]. The difference Fermi energy levels lead to the migration of negative charges near the p-n interface in p-type semiconductor to TiO2. This process makes the region near the p-n interface electrified for forming an internal electric field. The separation of TiO2 electron-hole pairs was accelerated by forming p-n heterojunction and establishing an electric field to create a potential difference.
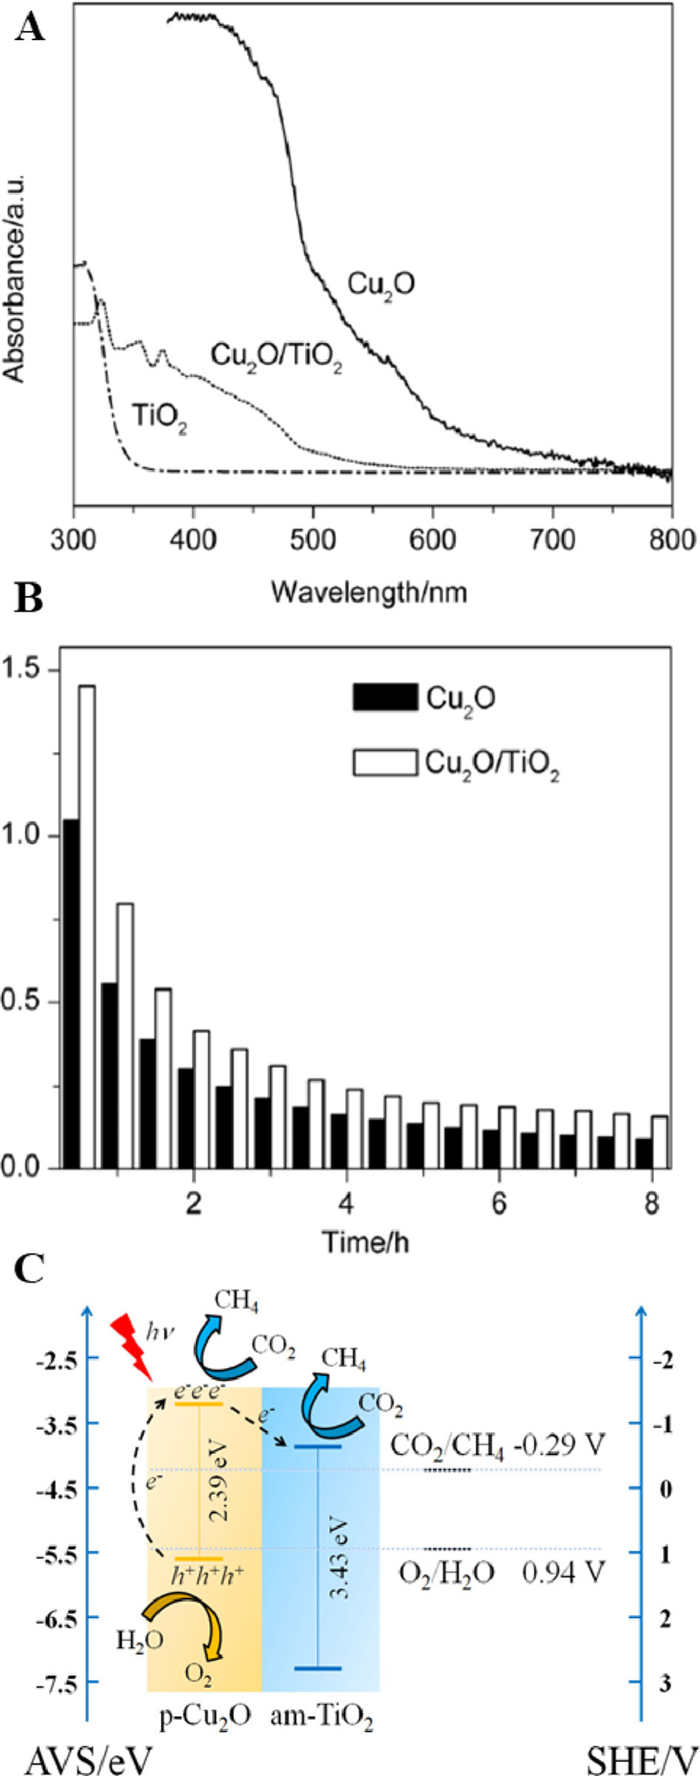
Cu2O is a typical p-type semiconductor with narrow band gap, which is widely applied in CO2 emission reduction. In previous studies, Bi and coauthors [87] reported the use of Cu2O/TiO2 hollow nanosphere composites for photocatalytic reduction of CO2 to CH4. It was found that the internal electric field of p-n heterojunction and the combination effect of band arrangement between Cu2O and TiO2 greatly facilitated the separation of photogenerated electrons and holes. Therefore, Cu2O/TiO2 hollow nanospheres showed higher activity in photocatalytic reduction of CO2 to CH4 compared with pure TiO2 and Cu2O (Fig. 17). In another study, Wang and coauthors [88] prepared Cu2O/OM TiO2 composite nanomaterials with p-n heterojunction structure by electrodepositing Cu2O into OM TiO2. It was obvious from the SEM cross-section and top view that the outer wall and top of the OM TiO2 are tightly wrapped by Cu2O nanoparticles (Figs. S8A and B in Supporting information). Under the condition of visible light, only Cu2O could produce excited electrons. Nevertheless, for composite system nder UV–vis irradiation, both Cu2O and TiO2 could be excited to generate photogenerated electrons, and then the potential difference between Cu2O and TiO2 leaded to the transfer of photogenerated electrons from Cu2O to the TiO2 conduction band (Figs. S8C and D in Supporting information). Cu2O/OM TiO2 showed the best photocatalytic activity in the reduction of CO2 to CH3OH by the presence of p-n heterojunction in nanomaterials.
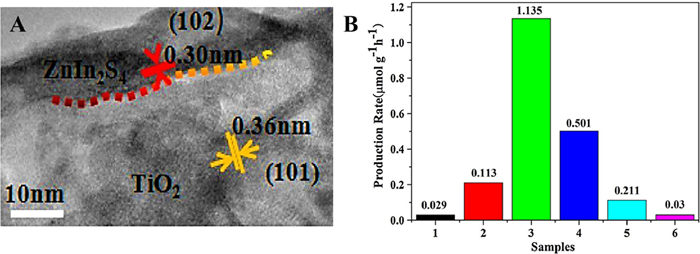
In order to maximize the redox ability of photocatalyst, Z-scheme heterostructure (Fig. S9 in Supporting information), which is different from the traditional Ⅱ-type and p-n-type heterostructures [89,90], emerged as the times require. Yang's group [91] designed and constructed a 3D ZnIn2S4/TiO2 Z-scheme system without solid electronic medium for photocatalytic reduction of CO2 to renewable hydrocarbon fuel (Fig. 18A). The 3D ZnIn2S4/TiO2 system exhibited excellent light absorption performance in photocatalytic reduction of CO2 attributed to the larger specific surface area of the Z-scheme heterojunction, more active centers, and the electron-holes separation by the complexing of the holes on the ZnIn2S4 nanosheets with the electrons in the TiO2 nanoribbons. Under simulated sunlight, ZnIn2S4 nanosheets and TiO2 nanobelts had almost no photoreduction CO2 activity. However, ZnIn2S4/TiO2 could significantly improve the efficiency of CO2 photocatalytic reduction to CH4. As shown in Fig. 18B, the production rate of CH4 was 1.135 µmol g−1 h−1, which was about 39 higher than that of ZnIn2S4, greatly improved the catalytic activity.
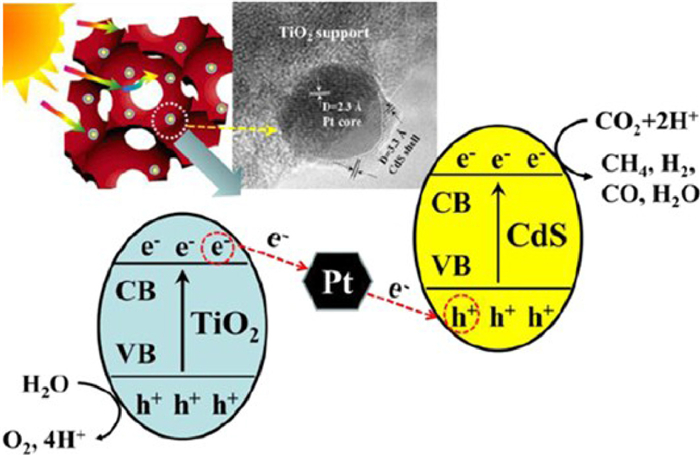
Zhao and coauthors [92] firstly demonstrated the response of all-solid-state 3DOM Pt@CdS/TiO2 Z-scheme heterojunction composite photocatalyst with core-shell structure to visible light. The thickness of CdS shell on the surface of Pt nanoparticles could be controlled by the ratio of CdS/Pt. 3DOM Pt@CdS/TiO2–1 catalyst had the highest photocatalytic activity and selectivity for CO2 reduction (Table S2 in Supporting information). The CH4 production rate of the catalyst was 36.8 µmol g−1 h−1, and the selectivity of CO2 reduction to CH4 was 98.1%. The mediator Pt and semiconductor CdS embedded in CdS (shell)-Pt (core)-TiO2 (support) Z-scheme heterojunction catalysts constructed vector electron transfer channels, and the direction of electron transfer facilitated the separation of photogenerated electrons and holes (Fig. 19), and greatly improved the reduction efficiency of CO2.
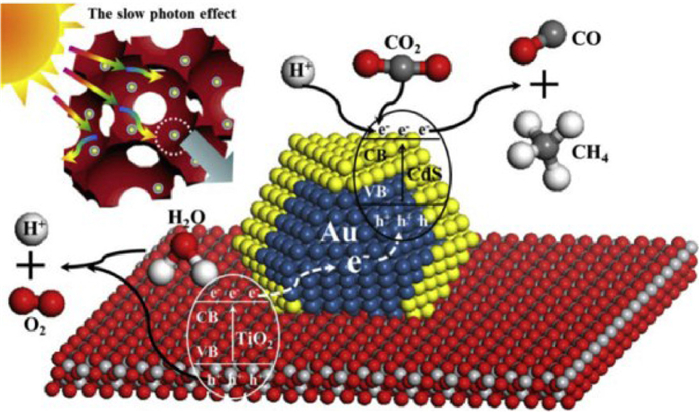
Furthermore, Wei and coauthors [93] used the same gas bubbling-assisted membrane reduction precipitation (GBMR/P) method to establish a Z-scheme nanojunction system of Au@CdS/OM TiO2 photocatalyst. From the SEM and TEM images (Fig. S10 in Supporting information), it can be seen that all the samples have a clear OM structure with large pores interconnected by windows. Subsequently, the core-shell nanoparticles with different CdS/Au molar ratios were uniformly dispersed on the inner wall of the OM TiO2 carrier. The results showed that the CdS (shell)-Au (core)-TiO2 (support) nanosystem was constructed to ensure the effective transfer of photogenerated electrons (Fig. 20). Appropriate addition of CdS can boost the selectivity of CO2 to CO, on the contrary, the addition of Au can significantly improve the selectivity of CO2 to CH4. As shown in Table S3 (Supporting information), among all the samples, Au@CdS/OM TiO2–1 had the highest CH4 production rate (41.6 µmol g−1 h−1). The catalytic activity was 26, 8 and 23 times higher than that of OM TiO2, Au/OM TiO2 and CdS/OM TiO2, respectively. The Z-scheme heterojunction constructed between CdS and TiO2 effectively enhances the spatial separation of photogenerated electron-hole pairs, providing more reactive sites and vector electrons.
Carbon nanomaterials with many excellent properties are considered to be one of the viable alternatives to noble metal elements and can be widely used to improve the performance of photocatalytic CO2 emissions [94–96]. Detailed descriptions of different forms of carbon materials are shown in Supporting information.
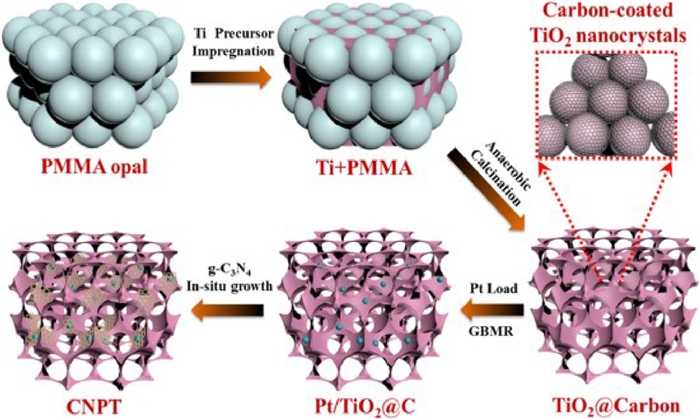
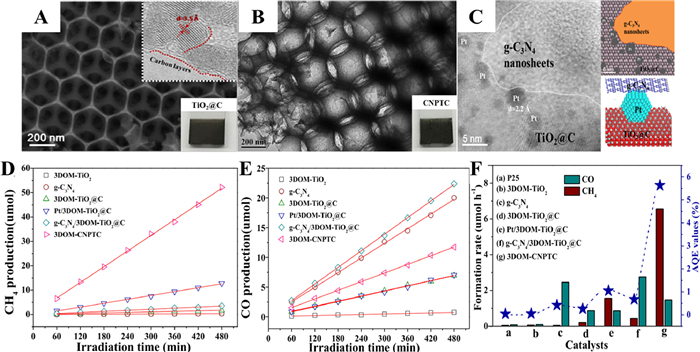
Wang and coauthors constructed an all-solid-state Z-scheme g-C3N4/Pt/3DOM-TiO2@C (3DOM-CNPTC) photocatalyst by high-temperature calcination and GBMR method (Fig. 21) [97]. The ternary solid system formed by Pt as an electron transport medium realizes the two-step transfer of vector electrons, which greatly improves the separation efficiency of photogenerated electrons and holes. Overall, it is beneficial to obtain high selectivity of CO2 photocatalytic reduction to CH4. As shown in Figs. 22A-C, TEM and HRTEM images clearly showed that the pore walls of anatase 3DOM-TiO2@C were surrounded by a 1–2 molecular carbon layer. After introducing of Pt nanoparticles, the spheres with a lattice spacing of 2.3 Å were uniformly loaded on the 3DOM TiO2@C pore wall. Compared with P25 and 3DOM TiO2, 3DOM TiO2@C showed higher photocatalytic activity for CO2 photoreduction. The good adsorption and activation properties of pure g-C3N4 for CO2 reactants and the coordination of 3DOM TiO2 and g-C3N4 significantly improved the selectivity of g-C3N4/3DOM TiO2@C catalysts for CO product formation. The three-component 3DOM-CNPTC catalyst exhibits the highest CH4 product formation rate (6.56 µmol/h) and the highest CO2 reduction selectivity (97.1%) (Figs. 22D, E and F).
Semiconductor photocatalysts have great potential and far-reaching significance in solving environmental pollution problems, especially porous TiO2 nanomaterials. The construction of larger interconnected macropores inside and outside the mesoporous films formed a hierarchically porous system in order to improve surface transport efficiency and diffusion rates of reactants and products, increasing internal availability, reducing the length of mesoporous channels [98,99].
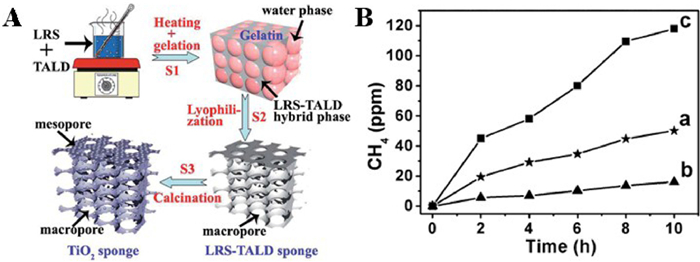
Green leaves, as a system with multidimensional pores, fix CO2 and convert it to hydrocarbons through photosynthesis, which provides inspiration for constructing artificial simulations of photocatalytic reduction in porous channels. For instance, Wang and coauthors [100] planned to synthesize a kind of macroporous TiO2 consisting of interconnected mesoporous channels using a combination of hard template and soft template from lotus root starch as the raw material (Fig. 23A). SEM and TEM images were shown in Supporting information. Gas chromatography analysis showed that CH4 was the only product of photocatalytic CO2 reduction by macro-mesoporous TiO2. The macroporous structure promoted gas diffusion of reactants and products, lengthened the internal reflection path of sunlight, and maintained a longer duration, which provided opportunities to absorb more sunlight. More importantly, the presence of mesoporous structure enhanced the gas adsorption and afforded more active sites for photoreduction of CO2. The CH4 conversion of macro-mesoporous TiO2 (5.13 ppm/h) was 2.60 times higher than that of OM TiO2 (1.97 ppm/h) (Fig. 23B).
The photocatalytic reduction of CO2 process simulating natural photosynthesis converts greenhouse gasses into usable clean energy such as CH4, CO, CH3OH, HCHO, and HCOOH, providing a practical and effective solution to resource and environmental problems [101]. According to the literature, the bond energy of C=O double bond is 800 kJ/mol, however, the C—C, C—O, C—H bond energies mentioned in the second part are all significantly lower than the C=O bond energy, thus, the energy required to cleave the C=O bond is much higher than them [102,103]. In addition, the relatively wide energy gap and the electron affinity energy of CO2 allow for a negative redox potential for single electron transfer, and therefore different low-energy reaction pathways have been developed to address the problem of reducing CO2 emissions [104,105].
The reaction mechanism of photocatalytic reduction of CO2 with H2O is discussed broadly in three aspects: Firstly, the adsorption, activation and dissociation of CO2 on photocatalysts. Secondly, the mechanism of electron transfers from photocatalysts to CO2. Thirdly, the formation of intermediate products and the selectivity of final products. Since the recombination rate of photogenerated electrons and holes is twice or even three times of the migration rate [106], reducing the recombination rate of photogenerated carriers is one of the important methods to achieve high CO2 conversion. For OM TiO2-based photocatalytic system, the separation and transportation of photogenerated charges are closely related to three main factors: the first factor is the crystal phase, for pure TiO2, anatase with low electron-hole recombination rate and high surface adsorption energy has stronger photocatalytic activity than rutile [107]. The second factor is defect disorders, where doping with N, C and other anions creates defect vacancies under photoexcitation conditions [108]. The third factor is the surface modification of TiO2. The doping of nonmetallic elements can create impurity energy level from which electrons are transferred to TiO2 under visible light irradiation. In addition, the introduction of noble metals or metal oxides as electron acceptors promote electron transfer. The experimenters used density functional theory (DFT) and in-situ IR to verify the mechanism of CO2 adsorption/activation (shown in Fig. S14 in Supporting information).
This review briefly summarizes the recent research progress of OM TiO2 photocatalysts for CO2 reduction. Some newly developed photocatalysts extend the absorption wavelength of TiO2 to the visible light region and accelerated the separation of photogenerated electron holes in TiO2, and the most basic characteristics of OM TiO2-based photocatalysts are the increase of specific surface area and the improvement of active sites. However, in addition to the research on catalyst modification, the mechanism of TiO2 photocatalytic CO2 reduction should be studied and analyzed in more depth to provide a more favorable theoretical basis for the design of new materials. According to the catalytic mechanism, both the surface electron density and redox potential have significant effect on determining that CO2 reduction can be converted into a variety of products, so how to obtain highly selective reduction products has become another key research direction. To sum up, this infinite potential technology has both opportunities and challenges in future development.
We declare that we have no financial and personal relationships with other people or organizations that can inappropriately influence our work, and there is no professional or other personal interest of any nature or kind in any products, service and/or company that could be construed as influencing the position presented in, or the review of, the manuscript entitled.
This work was supported by the National Key Research and Development Program of China (No. 2022YFB3504100), and the National Natural Science Foundation of China (No. 21972166).
Supplementary material associated with this article can be found, in the online version, at doi:
P. Chen, Y.X. Zhang, Y. Zhou, F. Dong, Nano Mater. Sci. 3 (2021) 344–367. doi: 10.1016/j.nanoms.2021.05.003
W.H. Zhang, A.R. Mohamed, W.J. Ong, Angew. Chem. Int. Ed. 59 (2020) 22894–22915. doi: 10.1002/anie.201914925
C.H.A. Tsang, K. Li, Y.X. Zeng, et al., Environ. Int. 125 (2019) 200–228. doi: 10.1016/j.envint.2019.01.015
Y. Bao, J. Wang, Q. Wang, et al., Nanoscale 12 (2020) 2507–2514. doi: 10.1039/c9nr09321d
W. Cui, J.Y. Li, F. Dong, ACS ES&T Engg. 2 (2022) 1103–1115. doi: 10.1021/acsestengg.1c00503
X. Li, W. Wang, F. Dong, et al., ACS Catal. 11 (2021) 4739–4769. doi: 10.1021/acscatal.0c05354
J.L. White, M.F. Baruch, J.E.P. Iii, et al., Chem. Rev. 115 (2015) 12888–12935. doi: 10.1021/acs.chemrev.5b00370
S. Ye, R. Wang, M.Z. Wu, Y.P. Yuan, Appl. Surf. Sci. 358 (2015) 15–27. doi: 10.1016/j.apsusc.2015.08.173
L.Z. Liu, S.B. Wang, H.W. Huang, Y.H. Zhang, T.Y. Ma, Nano Energy 75 (2020) 104959. doi: 10.1016/j.nanoen.2020.104959
O. Ola, M.M. Maroto-Valer, J. Photochem. Photobiol. C: Photochem. Rev. 24 (2015) 16–42. doi: 10.1016/j.jphotochemrev.2015.06.001
S.N. Habisreutinger, L. Schmidt-Mende, J.K. Stolarczyk, Angew. Chem. Int. Ed. 52 (2013) 7372–7408. doi: 10.1002/anie.201207199
X. Li, J.Q. Wen, J.X. Low, Y.P. Fang, J.G. Yu, Sci. China Mater. 57 (2014) 70–100. doi: 10.1007/s40843-014-0003-1
Z. Xiong, Z. Lei, C.C. Kuang, et al., Appl. Catal. B 202 (2017) 695–703. doi: 10.1016/j.apcatb.2016.10.001
M. Wu, Y. Li, Z. Deng, B.L. Su, ChemSusChem 4 (2011) 1481–1488. doi: 10.1002/cssc.201100082
H. Park, Y. Park, W. Kim, W. Choi, J. Photochem. Photobiol. C: Photochem. Rev. 15 (2013) 1–20. doi: 10.1016/j.jphotochemrev.2012.10.001
W.J. Ong, L.L. Tan, S.P. Chai, S.T. Yong, A.R. Mohamed, Nanoscale 6 (2014) 1946–2008. doi: 10.1039/c3nr04655a
M. Sagir, M.B. Tahir, M. Rafique, M.S. Rafique, T. Nawaz, Nanotechnol. Photocatal. Environ. Appl. 10 (2020) 159–189.
C.G. Barraclough, J. Lewis, R.S. Nyholm, J. Chem. Soc. 173 (1959) 3552–3555.
S.J. Xie, Q.H. Zhang, G.D. Liu, Y. Wang, Chem. Commun. 52 (2016) 35–59. doi: 10.1039/C5CC07613G
A. Sarkar, E. Gracia-Espino, T. Wågberg, et al., Nano Res. 9 (2016) 1–13. doi: 10.21843/reas/2015/1-8/108322
J. Wu, H.W. Lu, X.L. Zhang, et al., Chem. Commun. 52 (2016) 5027–5029. doi: 10.1039/C6CC00772D
A.J. Cowan, J.R. Durrant, Chem. Soc. Rev. 42 (2013) 2281–2293. doi: 10.1039/C2CS35305A
K. Li, X. An, K.H. Park, M. Khraisheh, J. Tang, Catal. Today 224 (2014) 3–12. doi: 10.1016/j.cattod.2013.12.006
R. Camarillo, S. Tostón, F. Martínez, C. Jiménez, J. Rincón, J. Chem. 92 (2017) 1710–1720. doi: 10.1002/jctb.5169
X. Li, J.G. Yu, M. Jaroniec, Chem. Soc. Rev. 45 (2016) 2603–2636. doi: 10.1039/C5CS00838G
J.W. Fu, B.C. Zhu, C.J. Jiang, et al., Small 13 (2017) 1603938. doi: 10.1002/smll.201603938
T.M. Di, B.C. Zhu, B. Cheng, J.G. Yu, J.S. Xu, Chem. Soc. Rev. 352 (2017) 532–541.
J.R. Jin, T. He, Appl. Surf. Sci. 394 (2017) 364–370. doi: 10.1016/j.apsusc.2016.10.118
M. Tahir, B. Tahir, Appl. Surf. Sci. 377 (2016) 244–252. doi: 10.1016/j.apsusc.2016.03.141
K.M. Ji, H.X. Dai, J.G. Deng, et al., Appl. Catal. B 168 (2015) 274–282. doi: 10.1016/j.apcatb.2014.12.045
T.Y. Tan, W. Xie, G.J. Zhu, et al., J. Porous Mat. 22 (2015) 659–663. doi: 10.1007/s10934-015-9938-4
J. Poolwong, T. Kiatboonyarit, S. Achiwawanich, et al., Nanomaterials 11 (2021) 1715. doi: 10.3390/nano11071715
H. Khan, S. Samanta, M. Seth, S. Jana, J. Mater. Sci. 55 (2020) 11907–11918. doi: 10.1007/s10853-020-04858-2
Y. Song, Y. Peng, H.Y. Li, et al., Chem. Eng. J. 447 (2022) 137450. doi: 10.1016/j.cej.2022.137450
L.Q. Tang, W. Ni, H. Zhao, Q. Xu, J.X. Jiao, Bioresources 4 (2019) 38–48. doi: 10.3390/educsci9010038
X.Y. Yang, L.H. Chen, Y. Li, et al., Chem. Soc. Rev. 46 (2017) 481–558. doi: 10.1039/C6CS00829A
J.X. Low, B. Cheng, J.G. Yu, Appl. Surf. Sci. 392 (2017) 658–686. doi: 10.1016/j.apsusc.2016.09.093
S. Das, W.M.A.W. Daud, RSC Adv. 4 (2014) 20856–20893. doi: 10.1039/c4ra01769b
S.R. Lingampalli, M.M. Ayyub, C.N.R. Rao, ACS Omega 2 (2017) 2740–2748. doi: 10.1021/acsomega.7b00721
C. Han, M. Pelaez, V. Likodimos, et al., Appl. Catal. B 107 (2011) 77–87. doi: 10.1016/j.apcatb.2011.06.039
M.K. Singh, M.S. Mehata, Opt. Mater.: X 109 (2020) 110309–110310. doi: 10.1016/j.optmat.2020.110309
T. Wang, X.G. Meng, G.G. Liu, et al., J. Mater. Chem. A 3 (2015) 9491–9501. doi: 10.1039/C4TA05892E
N. Shehzad, M. Tahir, K. Johari, T. Murugesan, M. Hussain, J. CO2 Util. 26 (2018) 98–122. doi: 10.1016/j.jcou.2018.04.026
J. Ye, J.H. He, S. Wang, et al., Sep. Purif. Technol. 220 (2019) 8–15. doi: 10.1016/j.seppur.2019.03.042
C.L. Muhich, J.Y. Westcott, T. Fuerst, A.W. Weimer, C.B. Musgrave, J. Phys. Chem. C 118 (2014) 27415–27427. doi: 10.1021/jp508882m
K. Kalantari, M. Kalbasi, M. Sohrabi, S.J. Royaee, Ceram. Int. 42 (2016) 14834–14842. doi: 10.1016/j.ceramint.2016.06.117
L.H. Zhang, C.H. Hu, L.Y. Cheng, et al., Chin. J. Catal. 34 (2013) 2089–2097. doi: 10.1016/S1872-2067(12)60692-5
H.Y. Li, D.J. Wang, H.M. Fan, et al., J. Colloid Interface Sci. 354 (2011) 175–180. doi: 10.1016/j.jcis.2010.10.048
L.S. Jia, J.J. Li, W.P. Fang, et al., Catal. Commun. 10 (2009) 1230–1234. doi: 10.1016/j.catcom.2009.01.025
M.S. Akple, J.X. Low, Z.Y. Qin, et al., Chin. J. Catal. 36 (2015) 2127–2134. doi: 10.1016/S1872-2067(15)60989-5
W. Zhou, H.G. Fu, ChemCatChem 5 (2013) 885–894. doi: 10.1002/cctc.201200519
R. Asahi, T. Morikawa, T. Ohwaki, K. Aoki, Y. Taga, Science 293 (2001) 269–271. doi: 10.1126/science.1061051
S. Sato, Chem. Phys. Lett. 123 (1986) 126–128. doi: 10.1016/0009-2614(86)87026-9
S. Cho, C.G. Ahn, J.Y. Park, S. Jeon, Nanoscale 10 (2018) 9747–9751. doi: 10.1039/C8NR02330A
Z.D. Li, F. Wang, A.V. Kvit, X.D. Wang, J. Phys. Chem. C 119 (2015) 4397–4405. doi: 10.1021/jp512622j
L. Sun, J.H. Cai, Q. Wu, et al., Electrochim. Acta 108 (2013) 525–531. doi: 10.1016/j.electacta.2013.06.149
M.R. Khan, T.W. Chuan, A. Yousuf, M.N.K. Chowdhury, C.K. Cheng, Catal. Sci. Technol. 5 (2015) 2522–2531. doi: 10.1039/C4CY01545B
H. Abdullah, M. Maksudur Rahman Khan, H. Ong, Z. Yaakob, J. CO2 Util. 22 (2017) 15–32. doi: 10.1016/j.jcou.2017.08.004
N. Singhal, A. Ali, A. Vorontsov, C. Pendem, U. Kumar, Appl. Catal. A: Gen. 523 (2016) 107–117. doi: 10.1016/j.apcata.2016.05.027
L.Q. Ye, J.Y. Liu, L.H. Tian, T.Y. Peng, L. Zan, Appl. Catal. B 134 (2013) 60–65. doi: 10.1016/j.apcatb.2012.12.043
S. Neaţu, J.A. Maciá-Agulló, P. Concepción, H. Garcia, J. Am. Chem. Soc. 136 (2014) 15969–15976. doi: 10.1021/ja506433k
O. Ishitani, C. Inoue, Y. Suzuki, T. Ibusuki, J. Photochem. Photobiol. A 72 (1993) 269–271. doi: 10.1016/1010-6030(93)80023-3
Y.X. Zhao, B.F. Yang, J. Xu, et al., Thin Solid Films 520 (2012) 3515–3522. doi: 10.1016/j.tsf.2011.12.076
Z.Y. Chen, L. Fang, W. Dong, et al., J. Mater. Chem. A 2 (2014) 824–832. doi: 10.1039/C3TA13985A
J.Q. Jiao, Y.C. Wei, Z. Zhao, et al., Catal. Today 258 (2015) 319–326. doi: 10.1016/j.cattod.2015.01.030
J.Q. Jiao, Y.C. Wei, Y.L. Zhao, et al., Appl. Catal. B 209 (2017) 228–239. doi: 10.1016/j.apcatb.2017.02.076
A. Kumar, M. Khan, J. He, I.M.C. Lo, Water Res. 170 (2020) 115356. doi: 10.1016/j.watres.2019.115356
M. Mazur, D. Wojcieszak, D. Kaczmarek, et al., Appl. Surf. Sci. 380 (2016) 165–171. doi: 10.1016/j.apsusc.2016.01.226
M. Dahl, Y. Liu, Y.J.C.R. Yin, Chem. Rev. 114 (2014) 9853–9889. doi: 10.1021/cr400634p
B.T. Barroca, N. Ambrožová, K. Kočí, Materials 15 (2022) 967. doi: 10.3390/ma15030967
G.X. Song, F. Xin, J.S. Chen, X.H. Yin, Appl. Catal. A: Gen. 473 (2014) 90–95. doi: 10.1016/j.apcata.2013.12.035
J.X. Low, J.G. Yu, M. Jaroniec, S. Wageh, A.A. Al-Ghamdi, Adv. Mater. 29 (2017) 1601694. doi: 10.1002/adma.201601694
H.J. Li, W.G. Tu, Y. Zhou, Z.G. Zou, Adv. Sci. 3 (2016) 1500389. doi: 10.1002/advs.201500389
J.J. Tao, Z.Z. Gong, G. Yao, et al., J. Alloy. Compd. 688 (2016) 605–612. doi: 10.1016/j.jallcom.2016.07.074
C.L. Yu, W.Q. Zhou, J.C. Yu, H. Liu, L.F. Wei, Chin. J. Catal. 35 (2014) 1609–1618. doi: 10.1016/S1872-2067(14)60170-4
Y.J. Wang, Q.S. Wang, X.Y. Zhan, et al., Nanoscale 5 (2013) 8326–8339. doi: 10.1039/c3nr01577g
K.Z. Qi, J.G. Yu, Interface Sci. Technol. 31 (2020) 265–284. doi: 10.1016/B978-0-08-102890-2.00008-7
X.Y. Pan, Y.J. Xu, J. Phys. Chem. C 119 (2015) 7184–7194. doi: 10.1021/jp512797t
C.Y. Dong, M.Y. Xing, J.L. Zhang, J. Phys. Chem. Lett. 7 (2016) 2962–2966. doi: 10.1021/acs.jpclett.6b01287
J.Y. Bai, X.L. Sun, G. Han, G.W. Diao, J. Alloy. Compd. 722 (2017) 864–871. doi: 10.1016/j.jallcom.2017.06.102
J.Q. Jiao, Y.C. Wei, Z. Zhao, et al., Ind. Eng. Chem. Res. 53 (2014) 17345–17354. doi: 10.1021/ie503333b
Y. Xie, G. Ali, S.H. Yoo, S.O. Cho, ACS Appl. Mater. Interfaces 2 (2010) 2910–2914. doi: 10.1021/am100605a
H. Xie, T. Zeng, S.F. Jin, et al., J. Nanosci. Nanotechno. 13 (2013) 1461–1466. doi: 10.1166/jnn.2013.6056
X.F. Chen, J. Zhang, Y.N. Huo, H.X. Li, Chin. J. Catal. 34 (2013) 949–955. doi: 10.1016/S1872-2067(12)60560-9
J.W. Xue, M. Fujitsuka, T. Majima, Chem. Commun. 57 (2021) 3532–3542. doi: 10.1039/d1cc00204j
Y.R. Wang, F. Wang, Z.X. Wang, Nano Res. 14 (2021) 4328–4335. doi: 10.1007/s12274-021-3833-x
F. Bi, M.F. Ehsan, W. Liu, T. He, Chin. J. Chem. 33 (2015) 112–118. doi: 10.1002/cjoc.201400476
J.Y. Wang, G.B. Ji, Y.S. Liu, M.A. Gondal, X.F. Chang, Catal. Commun. 46 (2014) 17–21. doi: 10.1016/j.catcom.2013.11.011
Y. Zhao, X.Y. Linghu, Y. Shu, et al., J. Environ. Chem. Eng. 10 (2022) 108077. doi: 10.1016/j.jece.2022.108077
J.X. Low, C.J. Jiang, B. Cheng, et al., Small Methods 1 (2017) 357–366. doi: 10.1177/1753193416684658
G. Yang, D.M. Chen, H. Ding, et al., Appl. Catal. B 219 (2017) 611–618. doi: 10.1016/j.apcatb.2017.08.016
Y.C. Wei, J.Q. Jiao, Z. Zhao, et al., J. Mater. Chem. A 3 (2015) 11074–11085. doi: 10.1039/C5TA00444F
Y.C. Wei, J.Q. Jiao, Z. Zhao, et al., Appl. Catal. B 179 (2015) 422–432. doi: 10.1016/j.apcatb.2015.05.041
J.R. Ran, J. Zhang, J.G. Yu, M. Jaroniec, S.Z. Qiao, Chem. Soc. Rev. 43 (2014) 7787–7812. doi: 10.1039/C3CS60425J
M.Q. Yang, N. Zhang, Y.J. Xu, ACS Appl. Mater. Interfaces 5 (2013) 1156–1164. doi: 10.1021/am3029798
M. Inagaki, Carbon 50 (2012) 3247–3266. doi: 10.1016/j.carbon.2011.11.045
C.J. Wang, L. Xi, W.J. He, et al., J. Catal. 389 (2020) 440–449. doi: 10.1016/j.jcat.2020.06.026
P.D. Yang, T. Deng, D.Y. Zhao, et al., Science 282 (1998) 2244–2246. doi: 10.1126/science.282.5397.2244
N.G. Moustakas, J. Strunk, Chem. Eur. J. 24 (2018) 12739–12746. doi: 10.1002/chem.201706178
F. Wang, Y. Zhou, P. Li, et al., RSC Adv. 4 (2014) 43172–43177. doi: 10.1039/C4RA06565D
Y. Yuan, R.T. Guo, Z.W. Zhang, et al., Energy Fuel 35 (2021) 13291–13303. doi: 10.1021/acs.energyfuels.1c01563
Z.X. Bi, R.T. Guo, X. Hu, et al., Nanoscale 14 (2022) 3367–3386. doi: 10.1039/d1nr08235c
K. Li, B. Peng, T.Y. Peng, ACS Catal. 6 (2016) 7485–7527. doi: 10.1021/acscatal.6b02089
Z.Y. Sun, N. Talreja, H.C. Tao, et al., Angew. Chem. Int. Ed. 57 (2018) 7610–7627. doi: 10.1002/anie.201710509
G. Kaune, M. Memesa, R. Meier, et al., ACS Appl. Mater. Interfaces 1 (2009) 2862–2869. doi: 10.1021/am900592u
W.Q. Fan, Q.H. Zhang, Y. Wang, Phys. Chem. Chem. Phys. 15 (2013) 2632–2649. doi: 10.1039/c2cp43524a
H. He, C. Liu, K. Dubois, et al., Ind. Eng. Chem. Res. 51 (2012) 11841–11849. doi: 10.1021/ie300510n
X.K. Li, Z.J. Zhuang, W. Li, H.Q. Pan, Appl. Catal. A: Gen. 429 (2012) 31–38. doi: 10.1016/j.apcata.2012.04.001

Figure 2 Typical surface modification of TiO2 for enhanced photocatalytic CO2 reduction.

Figure 4 Schematic illustration for the comparison of band structure of the pure TiO2, metal doped TiO2 and non-metal doped TiO2. Reprinted with permission [37]. Copyright 2017, Elsevier.


Figure 6 (A) Schematic diagram of IO-B-TiO2/Ni preparation. (B) UV–vis DRS. (C) the corresponding hv-[hvF (R∞)]1/2 curves. (D) PL spectra and (E) evolution of CO formation for photocatalytic CO2 reduction. (a) commercial-P25, (b) IO-W-TiO2, (c) IO-B-TiO2, (d) IO-B-TiO2/Ni. Reprinted with permission [44]. Copyright 2019, Elsevier.

Figure 7 (A) flowchart of 3D N-doped TiO2 film production. (B) Comparison of band diagrams of undoped and N-doped TiO2 films. Reprinted with permission [54]. Copyright 2018, Royal Society of Chemistry.

Figure 8 UV–vis DRS of TiO2 NTs and N-doped TiO2 NTs. Reprinted with permission [56]. Copyright 2013, Elsevier.

Figure 9 Formation of Schottky barrier between TiO2 and metal. Reprinted with permission [57]. Copyright 2015, Royal Society Chemistry.

Figure 10 (A-D) SEM images of the top view for the different samples prepared by the pulsed current deposition method. (E) UV–vis absorption spectra of the different samples. Reprinted with permission [64]. Copyright 2014, Royal Society of Chemistry.

Figure 11 SEM images of (A) TiO2, (B) Au2/TiO2, and (C) Au4/TiO2. (D) TEM, (E) HRTEM and (F) Au nanoparticles size distribution of 3DOM Au4/TiO2. Reprinted with permission [65]. Copyright 2015, Elsevier.

Figure 12 (A) Photoluminescence spectra. (B) Schematic illustration of the SPR effect for photocatalytic CO2 reduction on 3DOM Au/TiO2, (a) commercial-P25, (b) TiO2; (c) Au4/TiO2. (C) UV–vis DRS and (D) CH4 production. (A, C) (a) Commercial-P25, (b) TiO2, (c) Au0.5/TiO2, (d) Au1/TiO2, (e) Au2/TiO2, (f) Au4/TiO2, (g) Au8/TiO2. Reprinted with permission [65]. Copyright 2015, Elsevier.

Figure 13 (A) The schematic for photocatalytic CO2 reduction with H2O to CH4, CO and O2 on AuPd/3DOM TiO2 catalyst. (B) TEM, (C) HRTEM images and (D) EDS elemental mapping images of Au3Pd1/3DOM-TiO2. (E) PL spectra. (F, G) Evolutions of CH4 and CO production for photocatalytic conversion of CO2 with H2O. (a) TiO2, (b) Au4/3DOM-TiO2, (c) Au3Pd1/3DOM-TiO2, (d) Au2Pd2/3DOM-TiO2, (e) Au1Pd3/3DOM-TiO2, (f) Pd4/3DOM-TiO2, (g) commercial-P25. Reprinted with permission [66]. Copyright 2017, Elsevier.

Figure 14 (A) Schematic illustration of the TiO2-based conventional type-Ⅱ heterojunction photocatalyst. (B) p-n heterojunction photocatalyst. Reprinted with permission [72]. Copyright 2017, Wiley Online Library. (C) Direct Z-scheme and (D) indirect Z-scheme heterojunction photocatalyst for CO2 reduction. Reprinted with permission [73]. Copyright 2016, Wiley Online Library.

Figure 15 (A) Schematic diagram for photocatalytic CO2 reduction. (B) UV−vis DRS of CeO2/TiO2 catalysts. (C) CO production amounts of (a) P25, (b) TiO2, (c) CeO2/TiO2–2, (d) CeO2/TiO2–4, (e) CeO2/TiO2–8, (f) CeO2/TiO2–16, (g) CeO2, and (h) particle-type CeO2/TiO2–4. Reprinted with permission [81]. Copyright 2014, American Chemical Society.

Figure 16 (A) PL spectra of TiO2 and 1.0% CdS/TiO2. (B) Electron transfer diagram of CdS/TiO2 films. Reprinted with permission [84]. Copyright 2013, Elsevier.

Figure 17 (A) UV–vis DRS of TiO2, Cu2O and Cu2O/TiO2. (B) CH4 formation rate of Cu2O and Cu2O/TiO2. (C) Schematic diagram for photocatalytic CO2 reduction over Cu2O/TiO2. Reprinted with permission [87]. Copyright 2015, Wiley Online Library.

Figure 18 (A) HRTEM image of ZnIn2S4/TiO2. (B) CH4 generation velocity of (1) ZnIn2S4 nanosheets, (2) ZIS-0.25/TO, (3) ZIS-0.33/TO, (4) ZIS-0.50/TO, (5) ZIS-1/TO, and (6) TiO2 nanobelts. Reprinted with permission [91]. Copyright 2017, Elsevier.

Figure 19 Schematic diagram for photocatalytic CO2 reduction of Pt@CdS/TiO2 Z-scheme heterojunction catalyst. Reprinted with permission [92]. Copyright 2015, Royal Society Chemistry.

Figure 20 Schematic diagram for photocatalytic CO2 reduction of Au@CdS/IO-TiO2. Reprinted with permission [93]. Copyright 2015, Elsevier.

Figure 21 Schematic of synthesis procedures for 3DOM-CNPTC photocatalyst. Reprinted with permission [97]. Copyright 2020, Elsevier.

Figure 22 (A) SEM images of 3DOM-TiO2@C material. (B) TEM and (C) HRTEM images of 3DOM-CNPTC photocatalysts. (D, E) Evolutions of CH4 and CO products for photocatalytic CO2 conversion. (F) Average efficiency of photocatalytic CO2 conversion with different catalysts. Reprinted with permission [97]. Copyright 2020, Elsevier.

Figure 23 (A) Schematic diagram of the procedure for preparing specific TiO2 sponge. (B) CH4 generation of (a) macro-mesoporous TiO2 sponges, (b) referred TiO2 without LRS, and (c) Pt-Cu supported macro-mesoporous TiO2 sponges. Reprinted with permission [100]. Copyright 2014, Royal Society Chemistry.

 扫一扫看文章

扫一扫关注我们
 DownLoad:

 下载:
下载:
