Figure 1.
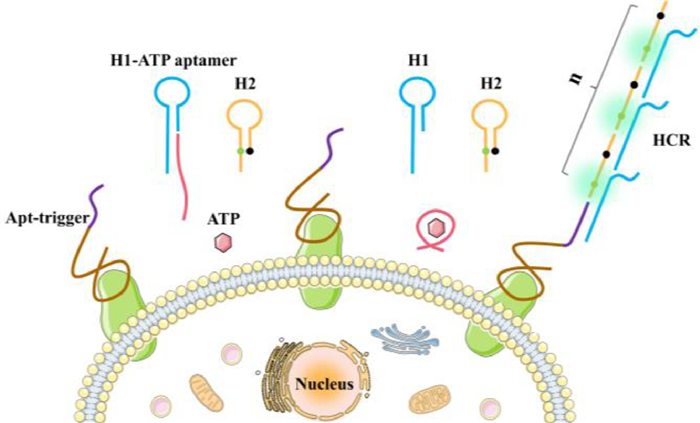
Schematic illustration of the extracellular ATP-activated hybridization chain reaction for cancer cell detection.
Extracellular ATP-activated hybridization chain reaction for accurate and sensitive detection of cancer cells
Lie Li , Suping Li , Jie Wang , Xiaohong Wen , Mei Yang , Haiyan Chen , Qiuping Guo , Kemin Wang

Cancer is one of the most fatal diseases in the world, causing several millions of deaths every year [1–3]. Early diagnosis of cancer can offer great opportunities for efficient cancer treatment [4,5]. Thus, accurate and sensitive detection of cancer cells plays a particularly critical role in improving the survival rate of cancer patients. To date, many technologies based on polymerase chain reaction, mass spectrometry and immunohistochemistry have been developed for the detection of cancer cells [6–10]. However, most of these approaches are restricted by their time-consuming processes, complicated operation platform, high cost, and poor stability [11,12]. It is still highly appealing to design a facile strategy with high sensitivity and specificity for identifying and detecting cancer cells.
In recent years, various aptamer-based probes have been reported for the detection of intact cancer cells [13–16]. Aptamers are short single-stranded oligonucleotides that can act as reliable affinity ligands to specifically bind and recognize proteins on the surface of cancer cells [17,18]. Despite the progress made, these aptamer biosensors exhibit limited sensitivity for detecting cancer cells because of their low concentration at early stages and heterogeneity [19]. Therefore, signal amplification strategies are drawing increasing attention [20–22]. Especially, several nonenzymatic DNA amplification techniques have been explored with satisfactory performance for bio-detection, including hybridization chain reaction (HCR) [23,24], catalyzed hairpin assembly [25,26], and entropy-driven catalysis [27,28]. Among them, HCR shows great prospect in signal amplification due to its high signal gain and low signal leakage. It will generate long linear dsDNA nanostructures by initiating toehold-mediated successive hybridization between two kinetically trapped hairpin reactants upon the introduction of a trigger sequence. For example, Zhang et al. have developed a tetrahedral DNA framework-enhanced hybridization chain reaction probe for facilitating in situ tumor imaging [29]. Wu et al. have reported a novel cell-targeting tripartite DNA probe that enables miRNA imaging in living mice via an in vivo hybridization chain reaction circuit [30]. Nevertheless, a limitation of these studies is that the HCR was initiated passively by the direct binding of hairpin with a trigger, which cannot be precisely controlled at the desired position.
The photoactivated strategies were first introduced to achieve precise temporal and spatial control over biological processes, yet could be restrained by the superficial tissue penetration and potential phototoxicity of light [31–33]. Then, the endogenous enzyme-activation methods were developed to achieve in situ bioimaging, which was constrained by the limit availability of cancer-related enzymes [34,35]. Additionally, the inherent vulnerability of these enzymes may easily result in inaccurate or even erroneous transductions in complex biological systems [36]. Adenosine triphosphate (ATP) is the vital biogenic molecule that plays essential regulatory roles in many biochemical synthesis and metabolic processes in living organisms [37–40]. It has been shown that ATP is presented at a high concentration of 100–500 µmol/L in the extracellular milieu of tumours, which is 103 to 104 times higher than that in the interstitium of normal tissues (10–100 nmol/L) [41,42]. Therefore, the ultrahigh level of ATP in the tumor microenvironment enables it to be an effective endogenous control for developing ATP-activated bioorthogonal reactions for cancer cell detection.
Inspired by the above arguments, we proposed an extracellular ATP-activated HCR amplification strategy for accurate and sensitive detection of cancer cells. As shown in Fig. 1, three DNA probes (Apt-trigger, H1-ATP aptamer duplex, and hairpin H2) were designed for this experiment, and their predicted secondary structure simulation diagrams were shown in Fig. S1 (Supporting information). The Apt-trigger probe consisted of two components: a ZYsls aptamer for specific binding to SMMC-7721 cells and a trigger sequence for initiating the HCR assembly. The duplex structure of H1-ATP aptamer caused the toehold in hairpin H1 to be hidden, preventing the strand-displacement reaction between hairpin H1 and Apt-trigger (i.e., the first step of the HCR reaction). In addition, the opposite side of the hairpin H2 stem was labeled with a fluorescein (AF488) and a quencher (BHQ1), resulting in a low fluorescence background due to the fluorescence resonance energy transfer. Upon activation with ATP, the ATP aptamer would bind to ATP to dissociate from the hairpin H1, thus leading to an Apt-trigger-induced strand-displacement reaction and subsequent HCR with hairpin H2 on the target cell surface. As a result of the formation of the chainlike HCR product, many hairpin H2 were successively opened with the separation of AF488 from BHQ1, thereby activating an amplified fluorescent signal for sensitive detection of cancer cells.
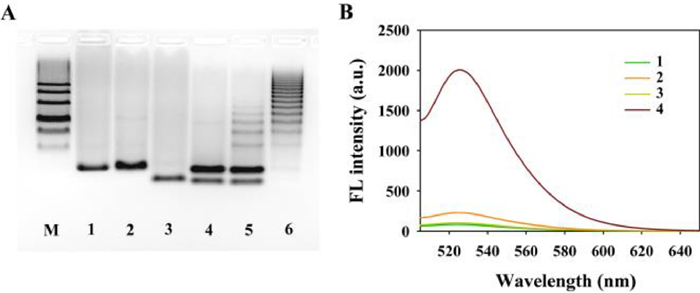
The feasibility of extracellular ATP-activated HCR assembly was first studied via 3% agarose gel electrophoresis. As shown in Fig. 2A, the ATP aptamer could effectively block the hairpin H1, making Apt-trigger unable to trigger the HCR assembly in the absence of ATP (Lane 5). In contrast, a distinct long-dispersed band was observed after incubation of Apt-trigger/H1-ATP aptamer/H2 with ATP (Lane 6), which demonstrated the ATP-activated HCR assembly. The fluorescence profile was further performed to support the results (Fig. 2B). The mixture of H1-ATP aptamer/H2 gave very weak fluorescence, indicating that the designed probes had a low background signal and no HCR occurred. Incubation of a H1-ATP aptamer/H2 mixture with Apt-trigger or ATP produced a negligible increase in fluorescence signal. Upon addition of ATP to the mixture of Apt-trigger/H1-ATP aptamer/H2, a significant fluorescence increase could be observed, which justified the ATP-activated sensing design. To explore whether the designed HCR assembly was specifically activated by ATP, three analogue molecules of ATP, including cytidine triphosphate (CTP), guanosine triphosphate (GTP) and uridine triphosphate (UTP), were introduced as controls. As shown in Fig. S2A (Supporting information), the addition of CTP, GTP, or UTP did not produce apparent HCR product due to the specific recognition site between ATP and its aptamer sequence. Furthermore, the fluorescence intensity in the presence of ATP was obviously higher than that of these ATP analogues (Fig. S2B in Supporting information), which indicated the excellent specificity of the ATP-activated strategy.
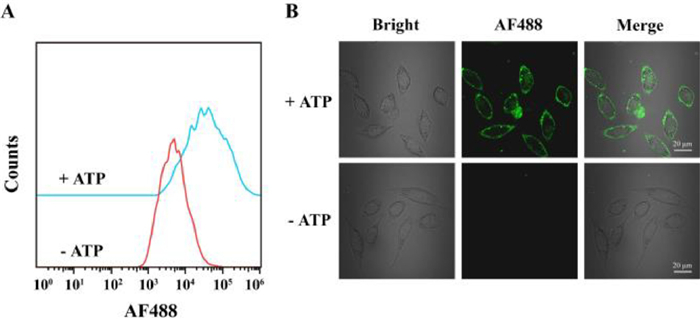
Having demonstrated the ATP-activated HCR assembly in test tubes, we explored its performance for target SMMC-7721 cell detection by flow cytometry. As shown in Fig. 3A, application of Apt-trigger/H1-ATP aptamer/H2 to SMMC-7721 cells in the absence of ATP induced a low fluorescence intensity. In contrast, addition of ATP significantly increased the fluorescence intensity on the cells, indicating that the ATP aptamer could bind to ATP to dissociate from hairpin H1, resulting in an HCR amplification. The results were also verified by confocal fluorescent imaging (Fig. 3B). After incubation with Apt-trigger/H1-ATP aptamer/H2 plus ATP, SMMC-7721 cells showed obvious green fluorescence on the cell surfaces, whereas almost no fluorescence was seen in the control group without ATP addition. These results indicated that the designed HCR assembly could be activated by ATP for the detection of target cells.
To further improve the detection performance of this strategy, the probe concentration and incubation time were optimized by flow cytometry. As shown in Fig. S3 (Supporting information), the signal-to-background ratio (SBR) gradually increased with the Apt-trigger concentration from 10 nmol/L to 100 nmol/L, yet slightly decreased at 200 nmol/L. Thus, 100 nmol/L of Apt-trigger was chosen for the incubation of target cells. Subsequently, the fluorescence response of the probes incubated with target cells for different times was examined, which indicated that the optimal SBR could be obtained at an incubation time of 30 min (Fig. S4 in Supporting information). Based on the above results, the best condition was determined to be 30 min of incubation with 100 nmol/L probe, which was used for the following experiments.
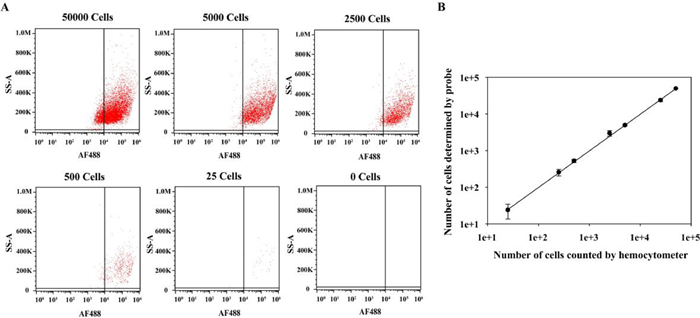
Under the optimal conditions, the extracellular ATP-activated HCR assembly was explored for the quantitative assay of target SMMC-7721 cells by flow cytometry. The samples with different cell numbers ranging from 0 to 50,000 in 200 µL of binding buffer were prepared. As shown in Fig. 4A, the number of labeled target cells appearing in the upper right region gradually decreased with decreasing number of SMMC-7721 cells. The background counts were obtained in the absence of any cells in 200 µL of binding buffer. The effective counts were determined by subtracting the background counts plus three times of standard deviation. As shown in Fig. 4B, the calibration curve showed a good linear response with a regression equation of logY = 1.0005(logX) + 0.0063, (R2 = 0.9991) where X and Y represented the number of cells measured by this strategy and a hemocytometer, respectively. The minimum number of cells detected in the real experiments was 25 cells in 200 µL of binding buffer. Moreover, the capability of this strategy to detect target SMMC-7721 cells in 10% fetal bovine serum (FBS) was evaluated. As shown in Fig. S5 (Supporting information), this strategy retained excellent binding ability to SMMC-7721 cells, and the obtained regression equation was logY = 0.9787(logX) + 0.1129, (R2 = 0.9948) based on the quantitative analysis of cells. The lowest cell number detected in the real experiments was 50 cells in 200 µL of 10% FBS samples. These results suggested that this strategy holds great potential for detecting target cells in complex samples.
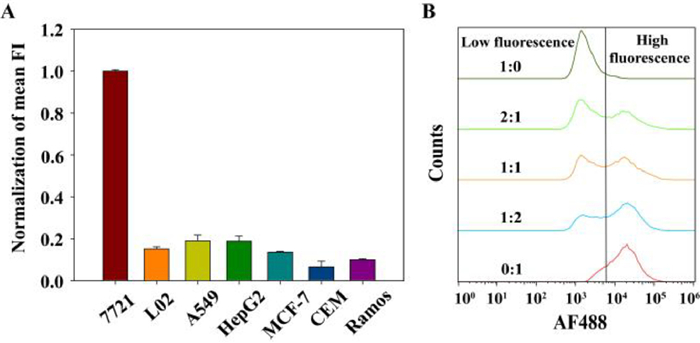
Furthermore, we investigated the specificity of ATP-activated HCR assembly to detect the target SMMC-7721 cells. As shown in Fig. S6A (Supporting information), the fluorescence intensity of SMMC-7721 cells incubated with Apt-trigger/H1-ATP aptamer/H2 plus ATP was much higher than that without ATP addition. In contrast, addition of ATP did not obviously enhance the signal intensity for control cells. Moreover, we compared the mean fluorescence intensity of SMMC-7721 cells and control cells incubated with Apt-trigger/H1-ATP aptamer/H2 plus ATP, which showed an obviously stronger fluorescence intensity in the former (Fig. 5A). The results were further confirmed by confocal fluorescence imaging (Fig. S6B in Supporting information). Very bright green fluorescent appeared around SMMC-7721 cells incubated with Apt-trigger/H1-ATP aptamer/H2 plus ATP, while little fluorescence was observed on the surface of control cells under the same treatment. These results demonstrated the high specificity of this strategy for target cell detection. Then, we assessed the capability of this strategy for detecting target SMMC-7721 cells in mixed cell samples. As shown in Fig. 5B, the increasing cells appeared in the high fluorescence region (right of line), while decreasing cells remained in the low fluorescence region (left of line) with the increase of SMMC-7721 cells' number in the cell mixture. The corresponding flow cytometry scatter plots were displayed in Fig. S7 (Supporting information), in which the detected target cells appearing in the blue box gradually increased following the increase of the SMMC-7721 cells' number. All these results indicated that the ATP-activated HCR amplification strategy is promising for accurate and sensitive detection of target cells in heterogeneous mixtures.
In summary, using an aptamer as the recognition unit and ATP-activated HCR as the signal amplification, we designed a reliable activatable strategy for specific and sensitive detection of cancer cells. The proposed assay possesses several merits. First, the detection limit is significantly improved, which is achieved at as low as 25 cells in 200 µL of binding buffer. Second, this approach is shown to have excellent specificity and accuracy for identifying target cells from control cells and mixed cell samples. Importantly, this method retains stable and good performance for target cell detection in 10% FBS, demonstrating great potential for clinical diagnosis in complex biological matrices. Moreover, this strategy can be adapted to detect various types of cancer cells by changing the corresponding aptamer sequence. Therefore, it may provide a valuable application platform for accurate and sensitive detection of cancer cells in cancer-related research.
The authors declare that they have no known competing financial interests or personal relationships that could have appeared to influence the work reported in this paper.
This work was supported by the Natural Science Foundation of China (Nos. 21877030, 21735002 and 21778016).
Supplementary material associated with this article can be found, in the online version, at doi:
J. Ferlay, M. Colombet, I. Soerjomataram, et al., Int. J. Cancer 144 (2019) 1941–1953. doi: 10.1002/ijc.31937
F. Bray, J. Ferlay, I. Soerjomataram, et al., CA: Cancer J. Clin. 68 (2018) 394–424. doi: 10.3322/caac.21492
P.A. Pesavento, D. Agnew, M.K. Keel, K.D. Woolard, Nat. Rev. Cancer 18 (2018) 646–661. doi: 10.1038/s41568-018-0045-0
R. Etzioni, N. Urban, S. Ramsey, et al., Nat. Rev. Cancer 3 (2003) 243–252. doi: 10.1038/nrc1041
F. Lu, L. Yang, T. Hou, F. Li, Chem. Commun. 56 (2020) 11126–11129. doi: 10.1039/D0CC04516K
N. Xenidis, M. Perraki, M. Kafousi, et al., J. Clin. Oncol. 24 (2006) 3756–3762. doi: 10.1200/JCO.2005.04.5948
J. Tang, X. He, Y. Lei, et al., Chem. Commun. 53 (2017) 11889–11892. doi: 10.1039/C7CC06218D
Y. He, S. Chen, L. Huang, et al., Anal. Chem. 91 (2019) 1171–1177. doi: 10.1021/acs.analchem.8b05085
S.K. Singh, C. Hawkins, I.D. Clarke, et al., Nature 432 (2004) 396–401. doi: 10.1038/nature03128
W.C.C. Tan, S.N. Nerurkar, H.Y. Cai, et al., Cancer Commun. 40 (2020) 135–153. doi: 10.1002/cac2.12023
P.G. Schiro, M. Zhao, J.S. Kuo, et al., Angew. Chem. Int. Ed. 51 (2012) 4618–4622. doi: 10.1002/anie.201108695
H. Jiang, L.B. Wang, Y.T. Zhang, et al., Anal. Chim. Acta 1228 (2022) 340299. doi: 10.1016/j.aca.2022.340299
J. Liu, Y. Zhang, Q. Zhao, et al., Anal. Chim. Acta 1029 (2018) 58–64. doi: 10.1016/j.aca.2018.04.068
B. Yuan, Y. Sun, Q. Guo, et al., Anal. Chem. 89 (2017) 9347–9353. doi: 10.1021/acs.analchem.7b02153
L. Li, H. Jiang, X. Meng, et al., Talanta 223 (2021) 121724. doi: 10.1016/j.talanta.2020.121724
B. Chen, W. Ma, X. Long, et al., Anal. Chem. 94 (2022) 2502–2509. doi: 10.1021/acs.analchem.1c04347
J.D. Munzar, A. Ng, D. Juncker, Chem. Soc. Rev. 48 (2019) 1390–1419. doi: 10.1039/C8CS00880A
X. Li, Y. An, J. Jin, et al., Anal. Chem. 87 (2015) 4941–4948. doi: 10.1021/acs.analchem.5b00637
Y. Song, T. Tian, Y. Shi, et al., Chem. Sci. 8 (2017) 1736–1751. doi: 10.1039/C6SC04671A
R. Duan, X. Lou, F. Xia, Chem. Soc. Rev. 45 (2016) 1738–1749. doi: 10.1039/C5CS00819K
C. Feng, T. Chen, D. Mao, et al., ACS Sens. 5 (2020) 3116–3123. doi: 10.1021/acssensors.0c01166
L. Liu, J.W. Liu, H. Wu, et al., Anal. Chem. 90 (2018) 1502–1505. doi: 10.1021/acs.analchem.7b04848
J. Li, S. Liu, L. Sun, et al., J. Am. Chem. Soc. 140 (2018) 16589–16595. doi: 10.1021/jacs.8b08442
H. Wang, Y. He, J. Wei, et al., Angew. Chem. Int. Ed. 61 (2022) e202115489. doi: 10.1002/anie.202115489
Y. Liu, T. Shen, J. Li, et al., ACS Sens. 2 (2017) 1430–1434. doi: 10.1021/acssensors.7b00313
L.L. Li, W.Y. Lv, Y.T. Xu, et al., Anal. Chem. 94 (2022) 4399–4406. doi: 10.1021/acs.analchem.1c05327
F. Li, G. Li, S. Cao, et al., Biosens. Bioelectron. 172 (2021) 112757. doi: 10.1016/j.bios.2020.112757
Q. Zhang, R. Zhao, C.C. Li, et al., Anal. Chem. 94 (2022) 13978–13986. doi: 10.1021/acs.analchem.2c03223
B. Zhang, T. Tian, D. Xiao, et al., Adv. Funct. Mater. 32 (2022) 2109728. doi: 10.1002/adfm.202109728
H. Wu, T.T. Chen, X.N. Wang, Y. Ke, J.H. Jiang, Chem. Sci. 11 (2020) 62–69. doi: 10.1039/C9SC03469B
W.A. Velema, W. Szymanski, B.L. Feringa, J. Am. Chem. Soc. 136 (2014) 2178–2191. doi: 10.1021/ja413063e
H. Chu, J. Zhao, Y. Mi, Y. Zhao, L. Li, Angew. Chem. Int. Ed. 58 (2019) 14877–14881. doi: 10.1002/anie.201906224
J. Zhao, H. Chu, Y. Zhao, Y. Lu, L. Li, J. Am. Chem. Soc. 141 (2019) 7056–7062. doi: 10.1021/jacs.9b01931
D. Yi, J. Zhao, L. Li, Angew. Chem. Int. Ed. 60 (2021) 6300–6304. doi: 10.1002/anie.202015979
Q. Wang, K. Tan, H. Wang, et al., J. Am. Chem. Soc. 143 (2021) 6895–6904. doi: 10.1021/jacs.1c00570
S. He, S. Yu, R. Li, et al., Angew. Chem. Int. Ed. 61 (2022) e202206529. doi: 10.1002/anie.202206529
L. Lu, B. Li, S. Ding, et al., Nat. Commun. 11 (2020) 4192. doi: 10.1038/s41467-020-18051-1
Y. Wang, L. Tang, Z. Li, Y. Lin, J. Li, Nat. Protoc. 9 (2014) 1944–1955. doi: 10.1038/nprot.2014.126
S. Biswas, K. Kinbara, T. Niwa, et al., Nat. Chem. 5 (2013) 613–620. doi: 10.1038/nchem.1681
X. Feng, Y. Jia, P. Cai, J. Fei, J. Li, ACS Nano 10 (2016) 556–561. doi: 10.1021/acsnano.5b05579
F.D. Virgilio, A.C. Sarti, S. Falzoni, E.D. Marchi, E. Adinolfi, Nat. Rev. Cancer 18 (2018) 601–618. doi: 10.1038/s41568-018-0037-0
Z. Di, J. Zhao, H. Chu, et al., Adv. Mater. 31 (2019) 1901885. doi: 10.1002/adma.201901885

Figure 1 Schematic illustration of the extracellular ATP-activated hybridization chain reaction for cancer cell detection.

Figure 2 (A) 3% Agarose gel electrophoresis imaging of the ATP-activated HCR assembly. Lane M: 20 bp DNA marker; Lane 1: Apt-trigger; Lane 2: H1-ATP aptamer; Lane 3: H2; Lane 4: H1-ATP aptamer + H2; Lane 5: Apt-trigger + H1-ATP aptamer + H2; Lane 6: Apt-trigger + H1-ATP aptamer + H2 + ATP. (B) Fluorescence spectral responses obtained from different reactions. Curve 1: H1-ATP aptamer + H2; Curve 2: Apt-trigger + H1-ATP aptamer + H2; Curve 3: H1-ATP aptamer + H2 + ATP; Curve 4: Apt-trigger + H1-ATP aptamer + H2 + ATP.

Figure 3 Flow cytometry assays (A) and confocal fluorescence imaging (B) of SMMC-7721 cells incubated with Apt-trigger/H1-ATP aptamer/H2 with or without the addition of ATP.

Figure 4 (A) Flow cytometry assays of SMMC-7721 cells with decreasing cell number from 50,000 to 0 in 200 µL of binding buffer after incubation with Apt-trigger/H1-ATP aptamer/H2 plus ATP. (B) The corresponding calibration curve illustrating the linear relationship between the cell number detected by this strategy and the cell number counted by the hemocytometer. The error bars represent the standard deviation of three repeated experiments.

Figure 5 (A) Normalization of the mean fluorescence intensity (FI) of the target SMMC-7721 (7721) cells and other control cells (L02, A549, HepG2, MCF-7, CEM and Ramos cells) incubated with Apt-trigger/H1-ATP aptamer/H2 plus ATP. The error bars represent the standard deviation of three repeated experiments. (B) Flow cytometry assays of the cell mixtures incubated with Apt-trigger/H1-ATP aptamer/H2 plus ATP. The ratios of L02 cells to SMMC-7721 cells were 1:0, 2:1, 1:1, 1:2, and 0:1, respectively.

 扫一扫看文章

扫一扫关注我们
 DownLoad:
 下载:
下载: