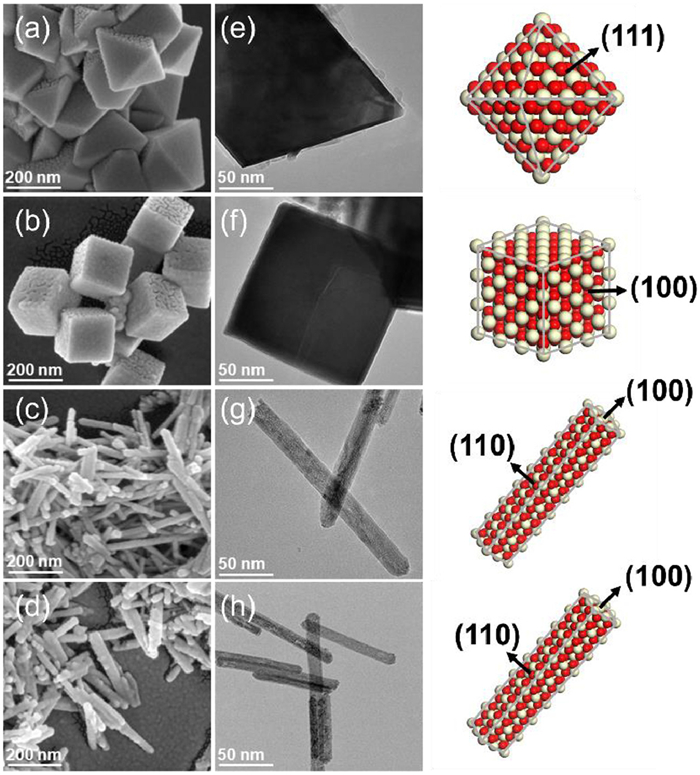
Figure 1.
SEM and TEM images of CeO2 nano-octahedra (a, e), nano cubes (b, f), nanorods from Ce(NO3)3 (c, g), nanorods from CeCl3 (d, h).
Mechanism study on direct synthesis of glycerol carbonate from CO2 and glycerol over shaped CeO2 model catalysts
Jiarui Gao , Jia-Wei Yang , Tenglin Ma , Jia Wang , Dan Xia , Bin Du , Yan Cui , Chengwu Yang

In 2021, global CO2 emissions from energy combustion and industrial processes reached the highest annual level ever recorded, 36.3 billion tons [1]. To achieve the IPCC (Intergovernmental Panel on Climate Change) goal of limiting global warming to 1.5 ℃ by 2100, global greenhouse gas emissions, especially CO2, must be significantly reduced. Using CO2 as a feedstock to produce value-added chemicals is a more economically valuable way to reduce carbon than storing it deep underground. Currently, the reaction routes for converting CO2 into chemicals can be divided into reductive and non-reductive reactions. Products that can be obtained by reductive reactions include CO, methane, methanol, formaldehyde, formic acid, carbon-rich hydrocarbons, oxygenated compounds, etc. Since CO2 has a very low Gibbs free energy and carbon is in its highest oxidation state, it is chemically inert in most cases. Therefore, reduction of CO2 requires external energy or the use of high-energy molecules (e.g., H2). Non-reductive reactions are another route for CO2 conversion that require less external energy input because the oxidation state of the carbon in the target product is the same as in CO2. This route can produce urea, carbamates, organic carbonates, etc. Among them, direct synthesis of organic carbonates from CO2 and alcohols is an attractive process [2,3]. For example, using CO2 and glycerol as feedstock to produce GC (Eq. 1) cannot only help reduce CO2 emissions, but also consume glycerol, a byproduct generated in biodiesel production. GC can be used as an environmentally friendly solvent, additive, chemical intermediate, polymer monomer, etc. [4,5]. Especially in recent years, with the explosive development of the new energy vehicle industry, the demand for organic carbonates as the electrolyte component of lithium-ion battery grows rapidly.
|
|
(1) |
The atomic utilization (atom economy) of this process is 87% and the only byproduct is H2O, which is a typical reaction in accordance with the principles of "green chemistry" [6]. However, this process has not yet been commercialized due to the lack of highly active and long-lived catalysts, in addition to the low yield caused by the thermodynamic equilibrium limitation of the reaction, but this limitation can be overcome to some extent by innovating the reaction process [7], using dehydrating agents to remove the water produced during the reaction [2,3], or applying an external field [8]. Organic tin compounds were first used as homogeneous catalysts to catalyze this reaction, mainly nBu2SnO or nBu2Sn(OMe)2 [9,10]. However, there have been few follow-up studies for this catalyst due to its strong toxicity and difficulty in recycling. Heterogeneous catalysts such as inorganic bases, Cu/La2O3 [11], La2O2CO3-ZnO [12], Zn/Al/La and Zn/Al/La/M (M = Li, Mg, Zr) [13] also have been studied for this reaction, which have the advantage to be easily separated.
Recently, various metal oxide catalysts (including CeO2, ZnO, TiO2, ZrO2, Al2O3, Ho2O3, Pr6O11, Nd2O3, Sm2O3, Bi2O3, Er2O3, GeO2, SrO, Gd2O3, and Mo2O3) were tested for the direct synthesis of CO2 and glycerol to GC and found that CeO2 showed the best catalytic performance [14,15]. However, to our knowledge, no experimental study with CeO2 model catalysts (single crystals or shaped nanocrystals) and no theoretical study on the catalytic mechanism of the direct GC formation from CO2 and glycerol on CeO2 (111), (110) and (100) surfaces have been reported. In the present study, we synthesized single-crystalline CeO2 nano-octahedra, nanorods, and nanocubes as model catalysts, which predominantly expose {111}, {110}, and {100} facets, respectively. The nanocrystals and reaction system were characterized by scanning and transmission electron microscopy (SEM, TEM), X-ray diffraction (XRD), temperature programmed reduction of H2 (H2-TPR), temperature programmed desorption of CO2 and NH3 (CO2-TPD, NH3-TPD), Raman spectroscopy, and attenuated total reflectance infrared spectroscopy (ATR-IR). We also systematically investigated the mechanism of adsorption, activation, and reaction of CO2 and glycerol on the surface of CeO2 using first-principles calculations. This study for the first time determined the relationship between the surface structure, acid-base properties of CeO2 and its catalytic performance, provided deeper insights into the catalytic mechanism at the molecular level and thus will support the development of CeO2-based catalysts for direct GC synthesis.
Figs. 1a−h show the SEM and TEM images of the as-synthesized CeO2 nanocrystals with different morphologies. The CeO2 nano-octahedra have a size of 200−500 nm and predominantly expose {111} facets. Both nanorods have a diameter of 10−15 nm and the length varying from 150 to 500 nm with the {110} (or {100}) facets preferentially exposed. The nanocubes reveal a regular shape with edge lengths in the range of 150−200 nm, and the surface is dominated by {100} facets.
Fig. S1 presents the XRD patterns collected for the CeO2 nanocrystals. All these samples display diffraction peaks at 2θ of 28.7°, 33.1°, 47.5°, 56.4°, and 59.1°, which are in line with the (111), (200), (220), (311), and (222) planes of pure fluorite cubic structure of CeO2 (JCPDS 34-0394). The XRD peaks of CeO2 nanorods are relatively broader compared to other CeO2 nanocrystals, since CeO2 nanorods have smaller size in some dimensions. The Raman spectra of the CeO2 nanocrystals are collected as shown in Fig. S2. To visualize and compare the intensity difference between the different vibrational bands, all Raman spectra in Fig. S2 have been normalized to the F2g band at 462 cm−1. The band at about 258 cm−1 is assigned to the second-order transverse acoustic (2TA) mode [16]. The band at ca. 598 cm−1 has been attributed to the defect-induced (D) mode [16], which is very weak for all CeO2 nanocrystals as synthesized indicating that the amount of oxygen vacancies on the sample surface can be neglected.
Table 1 summarizes the average particle sizes determined from SEM and TEM images, the specific surface areas measured by Brunauer−Emmett−Teller (BET) analysis, and the density of basic and acid sites obtained from TPD-QMS. The specific area of CeO2 nano-octahedra and nanocubes is comparable, but an order of magnitude smaller than that of nanorods. The acid-base properties will be discussed in detail below.
 DownLoad:
CSV
DownLoad:
CSV

|
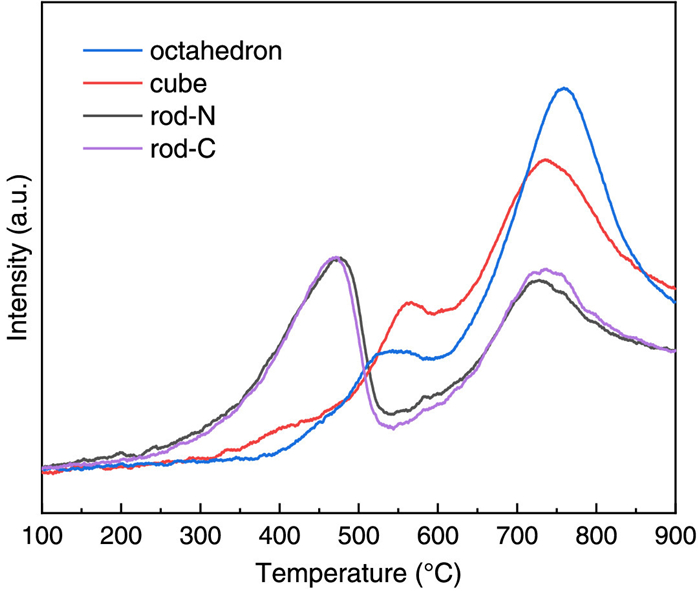
Fig. 2 shows the H2-TPR of CeO2 nanocrystals. It is known that TPR gives indications of the reducibility of surface and bulk of ceria. The reduction of conventional CeO2 powders is characterized by a bimodal shape with a peak (or peaks) at low temperature characteristic of surface reduction and a large peak at high temperature typical of bulk reduction. In agreement with previous studies, the bulk reduction of all samples in this study shows a major peak in the temperature range from 650 ℃ to 850 ℃, which is nearly independent of the facets exposed by the nanocrystals. However, CeO2 nanocrystals of different morphologies show a strongly different behavior for the low temperature peaks. The starting temperature of surface reduction of the CeO2 nanocrystals follows the order of rods (200 ℃) < cubes (320 ℃) < octahedra (390 ℃). This indicates that the surface reducibility follows the order (110) < (100) < (111), which are predominantly exposed by CeO2 nanorods, nanocubes, and nano-octahedra, respectively. Since the reduction of the surface leads to the formation of surface oxygen vacancies, the formation energy of surface oxygen vacancies should play a decisive role in the reducibility of the CeO2 surface. Previous DFT calculations show that the oxygen vacancy formation energy of low-indexed CeO2 surfaces follows the order (110) < (100) < (111) [17,18], which is thus consistent with our experimental observations. Two ceria nanorods synthesized with Ce(NO3)3 and CeCl3 exhibit almost the same TPR profiles, with the surface reduction even showing a relatively higher peak intensity than the peak of bulk reduction at high temperature. The surface reduction of the CeO2 nanocubes leads to two peaks at 400 and 560 ℃, with the second peak being quite close to the surface reduction peak of the CeO2 nano-octahedra (545 ℃). This is because above 500 ℃ the nanocubes begin to change their morphology, resulting in the development of extended flat {111} facets (corner-truncated) and {110} planes (edge-truncated) [19–21]. And the edge-truncated {110} planes are further fully {111}-faceted, exposing a characteristic sawtooth-like structure [21,22].
Based on previous studies on the synthesis of organic carbonates from alcohols and CO2, acid-base properties are crucial for the catalyst performance since acidic sites usually facilitate the adsorption of methanol and basic sites activate CO2. To investigate the acid-base properties of the catalysts, we measured the temperature programmed desorption (TPD) of NH3 and CO2. The chemisorption analyzer equipped with a downstream quadruple mass spectrometer (QMS) as detector can provide very high sensitivity. The NH3-TPD-QMS profiles of all catalysts used to study the amount and strength of acid sites are shown in Fig. 3a. As expected, the NH3-TPD-QMS profiles of CeO2 nanocrystals of different morphologies are very different. The desorption peaks at 100–300 ℃ and 430–600 ℃ are attributed to the weak and strong acidic sites, respectively. It can be observed that two CeO2 nanorods show nearly the same desorption behavior, a large peak for NH3 desorbed from weak acid sites and a small peak desorbed from strong acid sites. The CeO2 nano-octahedra exhibit a relatively small peak for NH3 desorbed from weak acid sites. Surprisingly, the CeO2 nanocubes show nearly no visible NH3 desorption peak, indicating the absence of acidic sites on the (100) surface.

The CO2-TPD-QMS profiles of all catalysts used to study the amount and strength of basic sites are shown in Fig. 3b. The CO2-TPD-QMS profiles suggest that the CeO2 nanocrystals contain weak, moderate, and strong basic sites with peak maxima of < 200, 200−400, and > 450 ℃, respectively. Again, the two CeO2 nanorods exhibit almost the same CO2-TPD-QMS profiles, indicating the quite similar surface properties of these two CeO2 nanorods synthesized with different cerium salt precursors. The CeO2 nano-octahedra and nanocubes exhibit similar desorption peaks, namely a large peak at about 100 ℃ for CO2 desorbed from weak basic sites and a broad peak with peak maxima above 450 ℃ for CO2 desorbed from strong basic sites. In addition, the nano-octahedra also exhibit a small peak at about 260 ℃ for CO2 desorbed from moderate basic sites. The CO2-TPD-QMS profiles over CeO2 nano-octahedra and nanocubes agree well with those over well-defined CeO2 (111) and (100) single crystalline films [23–25], suggesting that the CeO2 nano-octahedra and nanocubes predominantly expose {111} and {100} facets.
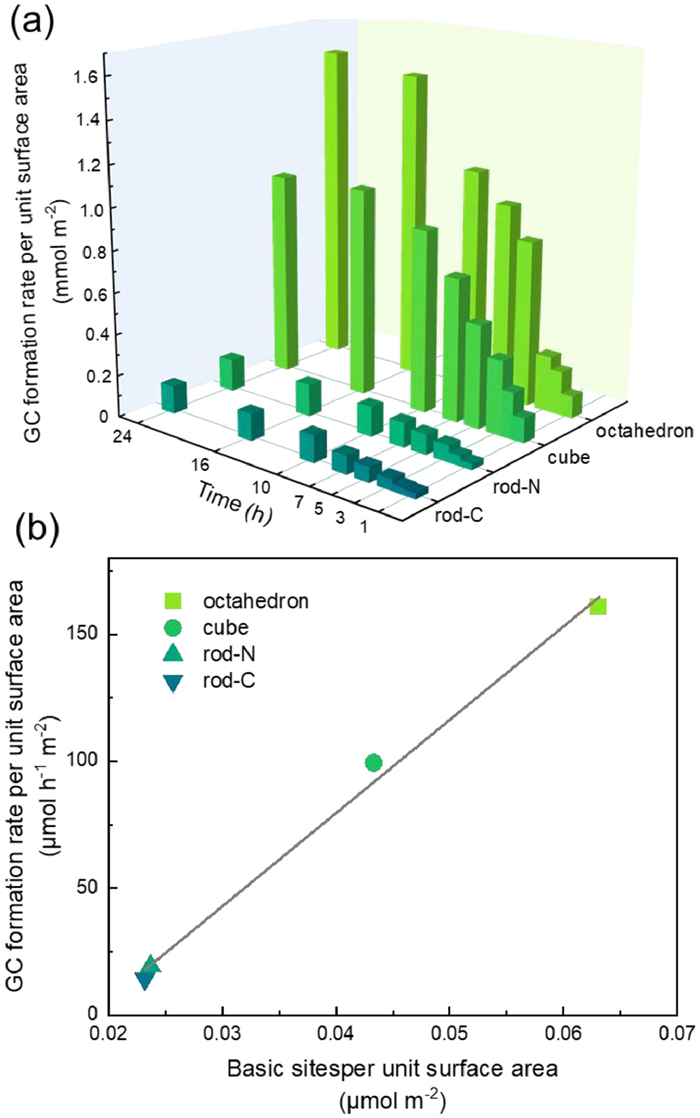
Fig. 4a shows the rate of GC formation per unit surface area with varying reaction time over CeO2 nano-octahedra, nanorods, and nanocubes at 160 ℃ and 40 bar of CO2 pressure. The rate of GC formation was high at the initial phase and decreased after 10 h. According to previous studies, a longer reaction time leads to the decomposition of GC, i.e., the reverse reaction, and thus to a lower instantaneous GC formation rate of the catalysts. At 24 h, the CeO2 nano-octahedra have the cumulative formation rate of 1.548 mmol/m2, while the two CeO2 nanorods show much lower cumulative formation rate of 0.155 mmol/m2 and 0.134 mmol/m2, with the formation rate over CeO2 nanocubes being in between, 0.988 mmol/m2. CeO2 nanorods synthesized with Ce(NO3)3 and CeCl3 have almost the same activity, indicating that the residual NO3− and Cl− anions have a similar influence on the activity or the influence can be neglected. Fig. S3 shows the comparison of ATR-IR spectra for glycerol carbonate and products obtained after 16 h of reaction with CeO2 nanocrystal catalysts. Glycerol carbonate exhibits a C−O vibrational band at 1760 cm−1, which appears for the products of all CeO2 nanocrystal catalysts, indicating the formation of GC. Figs. S4 and S5 show the SEM and XRD data after catalytic reactions of the CeO2 nanocrystals, which retained their original morphology and structure, indicating the high stability as reported in previous study [14].
It is commonly reported that for the synthesis of organic carbonates from CO2 and alcohol, both acidic and basic sites must be present on the catalyst surfaces. In many reactions catalyzed by CeO2, the catalytic reactivity is attributed to the redox properties of CeO2, which are related to the oxygen vacancies or cerium cations of multiple oxidation states (Ce3+/Ce4+) [25–31]. Their importance in the present reaction cannot be completely ruled out. However, it should be noted that this reaction occurs under mild and non-reducing conditions, so it is unlikely that oxygen vacancies and Ce3+ cations are involved. The reaction is probably catalyzed only by acid and base sites.
According to Fig. 4b, we found that the catalytic performance (GC formation rate) is not strictly linearly dependent on the acidity and the ratio of acidity to basicity, but linearly dependent on the density of basic sites. The oxygen anions on the CeO2 surface are Lewis basic sites, which are relevant to the adsorption and activation of CO2. It is quite plausible that CO2 activation is more important for a three-phase reaction in which a very inert gaseous reactant, CO2, and a high-velocity liquid reactant, glycerol, are coupling up over the surfaces of a solid catalyst, CeO2. This correlation is also mentioned by many previous studies [12,13,32,33].
To depict a more microscopic reaction mechanism underlying the formation of GC from CO2 and glycerol on all three CeO2 (111), (110), and (100) surfaces, we also performed a comprehensive first principles calculations.
First, various placements and geometric configurations of pre-adsorbed CO2 and glycerol are examined. After full geometry optimization, the adsorption energies of CO2 and glycerol on the stoichiometric CeO2 (111), (110) and (100) surfaces are computed. Note that the CeO2 (100) is a polar surface and must be restructured to compensate the surface polarity. Although the structure of the CeO2 (100) surface reconstruction is still in debate currently, herein we adapted the more accepted O-terminated (2 × 2) model by removing 50% of surface oxygen atoms [21].
As shown in Fig. 5a, on all three surfaces, the adsorbed CO2 can be in either linear or bent configuration. In the linear configuration, the CO2 molecule retains the linear geometry as in the gas phase, and no C–O bond is formed between CO2 and CeO2 surface. In the bent configuration, the CO2 molecule forms a C–O bond (denoted as C–Olatt) with a lattice O on the CeO2 surface. Due to the formation of the C–Olatt bond, the CO2 molecule is negatively charged with the C–O double bond being elongated, resulting in a carbonate species. In such a bent configuration, the carbonate species forms a 'Y' shape with the original two oxygen atoms of CO2 dangling toward the vacuum. Linear adsorption of CO2 on CeO2 (111), (110) and (100) surfaces entail comparable adsorption energies of −0.23, −0.25 and −0.21 eV, respectively. Stronger adsorption is expected in the bent configuration, which is true for (110) and (100) surfaces with more negative adsorption energy of −0.32 and −0.57 eV, respectively. Unexpectedly, the bent configuration of CO2 adsorption on the CeO2 (111) surface is a bit weaker than that for the linear configuration, entailing an adsorption energy of −0.19 eV; this is due to a larger distortion of surface lattice upon CO2 adsorption on the CeO2 (111) surface.
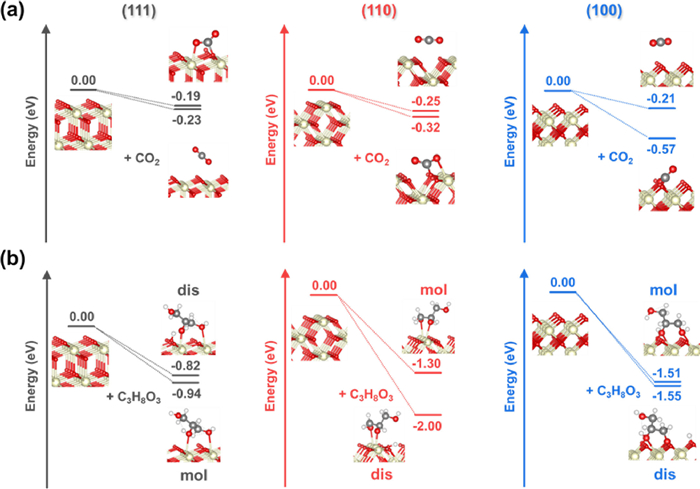
Fig. 5b shows the adsorption configurations of glycerol on the CeO2 (111), (110), and (100) surfaces. The glycerol molecules can be adsorbed molecularly and dissociatively. In the molecular adsorption configuration, two glycerol O bind to the surface Ce cations and the −CH2OH group dangles toward the vacuum. The molecular adsorption configurations of glycerol on CeO2 (110) and (100) entail close adsorption energies, −1.30 and −1.51 eV, respectively, which are more negative than that of the molecularly adsorbed glycerol on the CeO2 (111) surface (−0.94 eV). That sugg-ests the stronger binding of glycerol on the CeO2 (110) and (100) surfaces. The dissociative adsorption configurations with one H dissociated from the −OH group of glycerol on CeO2 (110) and (100) surfaces have more negative adsorption energies, −2.00 and −1.55 eV, respectively, than the molecular adsorption counterpart. Again, the dissociative adsorption of glycerol on the CeO2 (111) surface is slightly weaker than the molecular adsorption and it has an adsorption energy of −0.82 eV.
Upon the adsorption of two reactants, CO2 and glycerol, three successive steps are identified towards the formation of GC on the CeO2 surface, as shown by the calculation: the interaction of glycerol with the CeO2 surface to form an adsorbed glyceroxide, which then attacks the CO2 molecule to form a linear carbonate intermediate. Subsequently, the secondary hydroxyl of glycerol attacks the linear carbonate group to form the cyclic carbonate. Fig. 6 shows the most favorable energy profile for the formation of a GC from a CO2 and a glycerol molecule on the CeO2 (111), (110) and (100) surfaces. The activation energy for the first step on the CeO2 (111), (110) and (100) surfaces is comparable and is 0.54, 0.50, and 0.55 eV, respectively.
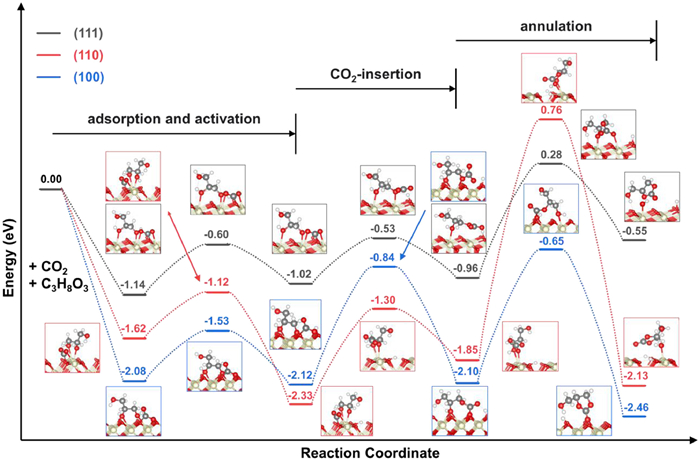
On the CeO2 (111) surface (black dotted curve in Fig. 6), the linear carbonate intermediate can be formed from a slightly endothermic reaction between the adsorbed CO2 (bent structure) and a co-adsorbed glycerol molecule. The formation of the linear carbonate intermediate from the bent CO2 entails an activation energy barrier of 0.5 eV. Note that the formation of the intermediate from the linear CO2 is also considered and both CO2 configurations exhibit comparable activation energy barrier, which is also true for CeO2 (110) and (100) surfaces. The subsequent attack of the secondary hydroxyl of glycerol to the carbonate group leads to the formation of GC. Such a step must overcome a high activation energy barrier (1.24 eV). On the CeO2 (111) surface, the annulation step is the rate-limiting step for GC formation.
The formation of GC from CO2 and glycerol on the CeO2 (110) surface proceeds via a three-step mechanism similar to that on the CeO2 (111) surface. As shown in Fig. 6 by the red dotted curve, the co-adsorbed CO2 and glycerol react with each other to form the linear carbonate intermediate with a higher activation energy barrier of 1.03 eV compared to the CeO2 (111) surface. This process is slightly endothermic with an energy input of 0.48 eV. The subsequent annulation step entails a very high activation energy barrier of 2.61 eV, leading to the formation of the GC. As with the CeO2 (111) surface, the annulation step is the rate-limiting step with a high activation energy barrier of 2.61 eV, which is 1.37 eV higher than that on the CeO2 (111) surface.
Next, we investigate the formation of GC on the CeO2 (100) surface. The CeO2 (100) surface is a polar surface and has a higher surface energy compared to the CeO2 (111) and (100) surfaces. As shown in Fig. 6 by blue dotted curve, the GC formation on the CeO2 (100) surface also follows the three-step mechanism as on the CeO2 (111) and (110) surface. On the CeO2 (100) surface the co-adsorbed CO2 and glycerol react with each other and form the linear carbonate intermediate with an activation energy barrier of 1.28 eV. On the CeO2 (100) surface, this step is associated with a higher activation energy barrier than on the CeO2 (111) and (110) surfaces. In the following step, the annulation reaction to form GC is the rate-limiting step with the activation energy barrier of 1.45 eV. Passing the transition state leads to the formation of GC and hydration of the CeO2 surface, and the activation energy is higher than for CeO2 (111) but lower than for CeO2 (110).
From the optimized energy profile, the overall activation energy of GC formation on the CeO2 surface follows the order of (111) < (100) < (110), which agrees well with the evaluation of the performance of CeO2 nanocrystal catalysts, i.e., the CeO2 nano-octahedra, predominantly exposing {111} facets, exhibit the highest GC formation rate and the CeO2 (110) nanorods, predominantly exposing {110} facets, show the lowest GC formation rate.
In summary, we synthesized CeO2 nanocrystals with well-defined surface structure as model catalysts to investigate the reaction mechanism for the direct synthesis of GC from glycerol and CO2. Under the same reaction conditions, CeO2 nano-octahedra, predominantly exposing {111} facets, showed the highest GC formation rate than CeO2 nanorods and nanocubes, which predominantly expose {110} and {100} facets, respectively. Using high-sensitivity TPD with quadrupole mass spectrometry as detector, we characterized the acid-base properties of CeO2 nanocrystals. The catalytic performance (GC formation rate) was found to be strictly linearly dependent on the density of basic sites, suggesting that the density of surface basicity is crucial for the high catalytic performance, which is relevant to the adsorption and activation of CO2.
We have also performed the first principles calculations for adsorption, activation, and reaction of CO2 and glycerol over CeO2 (111), (110), and (100) surfaces and obtained deeper insights into the catalytic mechanism at the molecular level. It is found that CO2 can be adsorbed on CeO2 surfaces in either a linear or bent configuration, and glycerol can be adsorbed on CeO2 surfaces molecularly and dissociatively. A three-step Langmuir–Hinshelwood (LH) mechanism was identified in which the annulation reaction is the rate-limiting step. The CeO2 (111) surface exhibits the lowest overall activation energy, which agrees well with the catalytic performance that the CeO2 nano-octahedra, predominantly exposing {111} facets, have the highest GC formation rate. The CeO2 (110) surface exhibits the highest overall activation energy, which agrees well with the catalytic reaction performance that the CeO2 nanorods, predominantly exposing {110} facets, have the lowest GC formation rate. Clarification of the catalytic reaction mechanism will help to develop CeO2-based catalysts with better performance.
The authors declare that they have no known competing financial interests or personal relationships that could have appeared to influence the work reported in this paper.
This work was supported by the National Natural Science Foundation of China (No. 21902005); Beihang University; and State Key Laboratory of Advanced Technology for Materials Synthesis and Processing (Wuhan University of Technology).
Supplementary material associated with this article can be found, in the online version, at doi:
IEA (2021), Global energy review 2021, IEA, Paris
D. Procopio, M.L. Di Gioia, Catalysts 12 (2022) 50. doi: 10.3390/catal12010050
S. Christy, A. Noschese, M. Lomelí-Rodriguez, N. Greeves, J.A. Lopez-Sanchez, Curr. Opin. Green Sustain. Chem. 14 (2018) 99–107. doi: 10.1016/j.cogsc.2018.09.003
M. Szőri, B.R. Giri, Z. Wang, A.E. Dawood, B. Viskolcz, Sustain. Energy Fuels 2 (2018) 2171–2178. doi: 10.1039/c8se00207j
M.O. Sonnati, S. Amigoni, E.P. Taffin de Givenchy, et al., Green Chem. 15 (2013) 283–306. doi: 10.1039/C2GC36525A
P. Anastas, N. Eghbali, Chem. Soc. Rev. 39 (2010) 301–312. doi: 10.1039/B918763B
D.C. Shi, S. Heyte, M. Capron, S. Paul, Green Chem. 24 (2022) 1067–1089. doi: 10.1039/d1gc04093f
J.X. Liu, Y.J. Li, H.M. Liu, D.H. He, Appl. Catal. B: Environ. 244 (2019) 836–843. doi: 10.1016/j.apcatb.2018.12.018
J. George, Y. Patel, S.M. Pillai, P. Munshi, J. Mol. Catal. Chem. 304 (2009) 1–7. doi: 10.1016/j.molcata.2009.01.010
M. Aresta, A. Dibenedetto, F. Nocito, C. Pastore, J. Mol. Catal. Chem. 257 (2006) 149–153. doi: 10.1016/j.molcata.2006.05.021
J. Zhang, D.H. He, J. Colloid Interface Sci. 419 (2014) 31–38. doi: 10.1016/j.jcis.2013.12.049
H.G. Li, D.Z. Gao, P. Gao, et al., Catal. Sci. Technol. 3 (2013) 2801–2809. doi: 10.1039/c3cy00335c
H.G. Li, X. Jiao, L. Li, et al., Catal. Sci. Technol. 5 (2015) 989–1005. doi: 10.1039/C4CY01237B
J.X. Liu, Y.M. Li, J. Zhang, D.H. He, Appl. Catal. A Gen. 513 (2016) 9–18. doi: 10.1016/j.apcata.2015.12.030
X.L.N. Su, W.W. Lin, H.Y. Cheng, et al., Green Chem. 19 (2017) 1775–1781. doi: 10.1039/C7GC00260B
Z.L. Wu, M.J. Li, J. Howe, H.M. Meyer III, S.H. Overbury, Langmuir 26 (2010) 16595–16606. doi: 10.1021/la101723w
M. Nolan, S.C. Parker, G.W. Watson, Surf. Sci. 595 (2005) 223–232. doi: 10.1016/j.susc.2005.08.015
J. Paier, C. Penschke, J. Sauer, Chem. Rev. 113 (2013) 3949–3985. doi: 10.1021/cr3004949
E. Aneggi, D. Wiater, C. de Leitenburg, J. Llorca, A. Trovarelli, ACS Catal. 4 (2014) 172–181. doi: 10.1021/cs400850r
Z.L. Wu, M.J. Li, S.H. Overbury, J. Catal. 285 (2012) 61–73. doi: 10.1016/j.jcat.2011.09.011
C.W. Yang, M. Capdevila-Cortada, C.Y. Dong, et al., J. Phys. Chem. Lett. 11 (2020) 7925–7931. doi: 10.1021/acs.jpclett.0c02409
C.W. Yang, X.J. Yu, S. Heißler, et al., Angew. Chem. Int. Ed. 56 (2017) 375–379. doi: 10.1002/anie.201609179
S.D. Senanayake, D.R. Mullins, J. Phys. Chem. C 112 (2008) 9744–9752. doi: 10.1021/jp8016425
P.M. Albrecht, D.E. Jiang, D.R. Mullins, J. Phys. Chem. C 118 (2014) 9042–9050. doi: 10.1021/jp501201b
D.C. Yang, Y.C. Xu, K. Pan, et al., Chem. Phys. Lett. 33 (2022) 378–384.
J.Y. Liu, X.Q. Gong, Chin. Chem. Lett. 32 (2021) 1127–1130. doi: 10.1016/j.cclet.2020.08.033
W.J. Yang, J.J. Li, X.Y. Cui, et al., Chin. Chem. Lett. 32 (2021) 2489–2494. doi: 10.1016/j.cclet.2020.12.057
L.N. Wang, F.M. Meng, K.K. Li, F. Lu, Appl. Surf. Sci. 286 (2013) 269–274. doi: 10.1016/j.apsusc.2013.09.067
F.M. Meng, Z.H. Fan, C. Zhang, et al., J. Mater. Sci. Technol. 33 (2017) 444–451. doi: 10.1016/j.jmst.2016.06.018
L.N. Wang, F.M. Meng, Mater. Res. Bull., 48 (2013) 3492–3498. doi: 10.1016/j.materresbull.2013.05.036
F.M. Meng, L.N. Wang, J.B. Cui, J. Alloy. Compd. 556 (2013) 102–108. doi: 10.1016/j.jallcom.2012.12.096
D. Stoian, F. Medina, A. Urakawa, ACS Catal. 8 (2018) 3181–3193. doi: 10.1021/acscatal.7b04198
J. Zhang, D.H. He, J. Chem. Technol. Biotechnol. 90 (2015) 1077–1085. doi: 10.1002/jctb.4414

Figure 1 SEM and TEM images of CeO2 nano-octahedra (a, e), nano cubes (b, f), nanorods from Ce(NO3)3 (c, g), nanorods from CeCl3 (d, h).

Figure 3 NH3-TPD-QMS (a) and CO2-TPD-QMS (b) profiles of CeO2 nanocrystals with different morphologies.

Figure 4 (a) GC formation rate per unit surface area at different reaction time over CeO2 nano-octahedra, nanorods, and nanocubes. Reaction conditions: 160 ℃, 40 bar CO2, 4.68 g glycerol, 8.515 g 2-cyanopyridine, 0.52 g CeO2, and 24.44 g DMF. (b) Correlation between the catalytic activity (GC formation rate at reaction time of 5 h) and the basicity. The density of basic sites can be obtained by dividing the peak area value of basic sites (Fig. 3b) by the specific surface area.

Figure 5 Computed adsorption energies and optimized geometries of CO2 (a) and glycerol (b) adsorbed on the CeO2 (111), (110) and (100) surface. The black, red, white, and gray balls represent C, O, H, and Ce atoms, respectively. "dis" and "mol" refer to dissociative and molecular adsorption, respectively.

Figure 6 Energy profiles of the GC formation on the CeO2 (111), (110) and (100) surfaces.
Table 1. Physicochemical properties of the CeO2 nanocrystals. rod-N and rod-C refer to nanorods synthesized with Ce(NO3)3 and CeCl3, respectively.
|
|
 下载: 导出CSV

 扫一扫看文章

扫一扫关注我们
