Received Date:
25 November 2022 Accepted Date:
16 March 2023 Revised Date:
12 March 2023 Available Online:
15 November 2023
Abstract:
While superhydrophobic coatings have shown promise as potential anti-icing coatings, the surface roughness of these coatings is prone to damage during repeated icing-deicing cycles. Herein, two kinds of superhydrophobic anti-icing coatings are prepared from organic resin and micro-nano particles using two strategies, and their excellent anti-icing properties are also investigated. However, superhydrophobic surface Ⅰ (SF1), prepared by first strategy, cannot be used for extended periods of time due to irreversible damage to the surface roughness during the icing–deicing process. Finite element simulations and experimental studies are preformed to investigate the fatal issue of such roughness damage. In contrast, the anti-icing properties of superhydrophobic surface Ⅱ (SF2), prepared by second strategy, can easily regain through a simple sandpaper abrasion treatment even the surface roughness was damaged during the icing–deicing process. These exploratory results and SF2 preparation strategy provide a facile design of anti-icing coating, and the derived restorable anti-icing coating is expected to be useful for a wide application.
Icing of a material surface is often undesired and can lead to serious economic, energy efficiency, and safety issues in daily life [1]. Accordingly, various anti-icing solutions have been developed to mitigate these issues [2–4]. Current state of the art anti-icing strategies includes coating materials with low-surface-energy polymers [5,6], synthetic superhydrophobic surfaces [7–9], low-interfacial toughness coatings [10], and slippery liquid-infused porous surfaces, etc. [11–14]. Superhydrophobic anti-icing coatings are attracting growing interest as anti-icing coatings [15,16]. In recent years, superhydrophobic coating have been prepared and widely used in various fields due to their unique wettability [17–19]. The surface roughness is typically constructed by incorporating micro-nano particles with low surface energies [20–22]. However, superhydrophobic surfaces are still vulnerable to damage after multiple icing–deicing cycles which limits their practical application [23,24]. Specifically, the expansion force from the water–ice phase change and the deicing force lead to the detachment of the micro-nano particles from the organic resin [25].
Finite element simulations are an effective method for visualizing the stress distribution in a material [26]. Yet, how superhydrophobic coatings are affected by expansion and deicing forces have not yet been investigated using combined experimental and simulated approaches. Previous works focus on low surface energy material regeneration instead of roughness collapse repairing [27,28]. While regenerating a coarse structure on a superhydrophobic anti-icing surface is still a challenge, the use of a universal superhydrophobic paint to prepare a recoverable superhydrophobic anti-icing coating has not been explored to date.
There are two primary preparation strategies that have been used to fabricate mechanically stable superhydrophobic coatings. The first strategy uses an organic resin to bond low surface energy micro-nano particles to the substrate surface [29,30]. In the second strategy, the organic resin and superhydrophobic micro-nano particles are directly mixed in a so called one-pot method [31]. The first strategy has been used commercially in products (e.g., NeverWet, Ultra-Ever-Dry) because it easily results in a higher surface roughness structure than the second strategy. However, neither surface prepared with these strategies maintained their high water contact angles after prolonged use because the rough surface structure was vulnerable to damage [32]. Yet among these strategies, the second strategy is a more promising approach to creating recoverable superhydrophobic coatings with high mechanical strengths [33].
Here, two kinds of superhydrophobic surfaces were prepared, and the anti-icing performance of these coatings was studied. Specifically, superhydrophobic surface Ⅰ (SF1) was prepared by spraying alternating layers of organic resin and fluorinated silica particles (Methods 1.1.3, 1.2.1 and 1.2.2 in Supporting information), and superhydrophobic surface Ⅱ (SF2) was prepared by spraying a suspension of the fluorinated silica particles mixed in the organic resin (Methods 1.1.4, 1.2.1 and 1.2.2 in Supporting information). The anti-icing properties of the coated surfaces, including the static waterdrop icing time, dynamic icing time, and deicing shear stress, were measured and compared with the untreated material surface. Moreover, finite element modeling was also used to study the damage caused by the expansion and deicing forces, and the damage to the different surfaces was compared to determine the failure mode. The irrecoverable failure of the SF1 anti-icing coating is also discussed. However, the superhydrophobic properties of SF2 could be regenerated by superficial abrasion of the surface with sandpaper. The recovered surface properties, such as the surface morphology, water contact angle, surface energy, and roughness, after treatment with different grits of sandpaper and with different applied pressures were also studied. Overall, superhydrophobic SF2 coatings were easily prepared and recovered and have promising potential for use as durable anti-icing coatings.
Previous studies have shown that superhydrophobic coatings delay water freezing due to their intrinsic water repellent properties and rough structure [34,35] (Supplementary Note in Supporting information). The ice nucleation rate is higher on flat surfaces, which in turns increases the Gibbs energy barrier to heterogeneous nucleation. Thus, superhydrophobic coatings can suppress ice nucleation by rough structure (Fig. 1a).
Figure 1
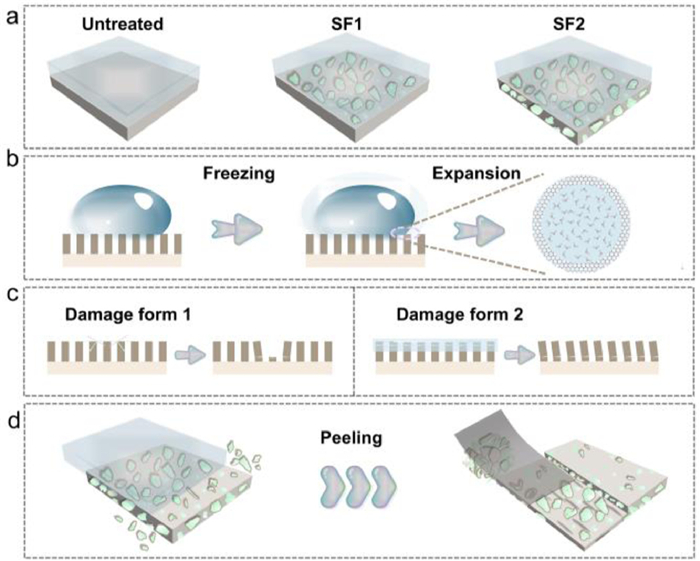
Figure 1.
Illustration of damage to SF1 and SF2 coatings. (a) Illustration of the ice formation mechanism on untreated, SF1-coated, and SF2- coated substrates. (b) Illustration of the water droplet to ice transition on a superhydrophobic coating. (c) Illustration of different forms of surface damage caused with the water–ice phase transition. Damage form 1 is caused by volume expansion of water droplets during the water–ice phase transition. Damage form 2 is caused by the external force used to remove the ice layer during the deicing process. (d) Illustration of roughness restoration to SF2.
However, the water contact angle of superhydrophobic anti-icing surfaces decreases after multiple icing–deicing cycles [36]. Basically, the ice nucleation is accompanied by non-negligible expansion forces ranging from 9408 N/cm2 to 19,600 N/cm2 depending on the temperature (Fig. 1b). Here, the classical Cassie-Baxter model is used to describe the superhydrophobic surface roughness changes during the water–ice phase transition. The meniscus formed between the upper layer of pillars and created an air-cushion. When the waterdrop froze, the contour line along the waterdrop expanded. Therefore, the pillars close to the waterdrop meniscus were affected by the accompanying expansion forces and detached from the bottom square (i.e., the organic resin, Figs. 1b and c, damage form 1). Actually, such icing phenomena cannot be avoided after long exposure times to low-temperature conditions. Employing external forces to accelerate the deicing process is another damage to roughness. When a deicing force was applied to one side of the ice layer, the pillars detached from the bottom square because the stress concentrated at the particle-resin interfaces (Fig. 1c, damage form 2).
To illustrate how such damage was affected by the expansion and deicing forces, we utilized scanning electron microscopy (SEM) to observe the SF1 and SF2 morphologies changes after water droplet icing and deicing (Fig. S6 in Supporting information). This evidence showed that change of rough structure occurred in both superhydrophobic anti-icing surfaces when the frozen waterdrops were removed, which ultimately weakened the hydrophobic properties of the surface. However, the superhydrophobic properties of SF2 can be potentially restored because the micro-nano particles are evenly incorporated throughout the coating (Fig. 1d). Although some of the semi-embedded silica particles fall off of the surface, the silica embedded in the coating could be exposed through removing some of the organic resin with an external force. The newly exposed surface should exhibit a similar morphology to the initial coating, and therefore, the preparation strategy used to create SF2 has enormous potential for use in creating long-term, stable coatings even after exposure to multiple icing–deicing cycles.
The ice suppression properties originate from the intrinsic hydrophobicity of the superhydrophobic coatings. Thus, the freezing times of static and dynamic water droplets on the SF1 and SF2 surfaces were investigated in artificial low-temperature conditions. Specifically, a 5 µL water droplet was placed in the samples in an environmental chamber at a temperature of −5 ℃, and the time required for the droplet to freeze was recorded (Method 1.2.3 in Supporting information). The results showed that the water droplet freezing time increased significantly on the coated surfaces, which indicated that both superhydrophobic coating strategies successfully delayed static water droplet freezing (Fig. 2a). Freezing of dynamic water droplets, as commonly encountered in the form of freezing rain, also needs to be considered. Freezing of dynamic droplets was simulated using a peristaltic pump to continuously drop water (Method 1.2.4 and Fig. S7 in Supporting information) on the three substrate surfaces. The extended freezing times (Fig. 2b) seen in the dynamic icing experiments were due to the waterdrops bouncing off of the superhydrophobic surfaces. Moreover, in scenarios where the surfaces are not flat, such as in the inclined SF1 and SF2 coated surfaces, the droplets easily rolled off of the substrates. In other words, the ice-phobic properties of the superhydrophobic coatings were seen in both static and dynamic waterdrop freezing experiments, as also seen in work by Graeber and Xie et al. [5,37]. These ice-phobic properties of the treated surfaces were attributed to the outstanding superhydrophobic properties of the prepared coatings.
Figure 2
Figure 2.
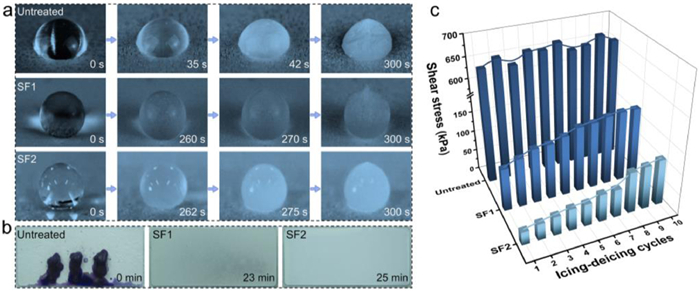
Anti-icing and deicing performance of SF1 and SF2 coated surfaces. (a) Pictures of water droplets freezing process on untreated, SF1-coated, and SF2-coated aluminum plates (The data in the lower right corner were the time point when the water droplet is freezing). (b) Picture of a continuous water stream freezing on untreated, SF1-coated, and SF2-coated aluminum plates (The data in the lower right corner were the freezing times of the dynamic droplets on different surface). (c) Shear stresses required to remove an ice cube during 10 icing–deicing cycles on untreated, SF1-coated and SF2-coated aluminum plates.
Water freezing on various surfaces exposed to low temperature environments for long periods of time is unavoidable, regardless of the hydrophilic or superhydrophobic properties of the coating. Therefore, it is crucial to reduce the force needed to deice a surface as much as possible [3,10,38]. Here, ice detachment experiments were performed by placing an ice cube (i.e., 1.5 cm × 1.5 cm × 1.5 cm) on the three different surfaces and then applying a force to one side of the ice cube until it fell off of the surface (Methods 1.2.5 in Supporting information). The schematic diagram of the experimental set-up is displayed in Fig. S8 (Supporting information). The results showed that the deicing force required to remove ice cubes from the untreated aluminum plate, SF1, and SF2 were 142.2, 23.4, and 7.1 N, respectively. The corresponding shear stresses of the ice cubes on the three surfaces were 630, 104 and 32 kPa, respectively (Fig. 2c). The sharp decrease in shear stress further confirmed that less force was required to remove ice from the designed SF1 and the SF2 anti-icing coatings than from the untreated aluminum plate.
However, the deicing shear stress increased gradually with the number of icing-deicing cycles on the SF1 and SF2 coatings as depicted in Fig. 2c. The increase in the deicing shear stress with cycle number may have been due to the formation of adhesion between the ice layer and the micro-nano particles. To the best of our knowledge, the influence of the expansion force during the water–ice phase change and required deicing force on a rough surface structure has not been discussed in literature.
To better understand the mechanism underlying the increase in the deicing force after multiple icing–deicing cycles, the water contact angle and sliding angle on SF1 and SF2-coated surfaces were also measured. As shown in Fig. S9 (Supporting information), the decrease in the water contact angle with increasing icing–deicing cycle number was opposite to increase in the deicing force seen over the same period of use (Fig. 2c). To better understand this increasing in the wetting ability of the surfaces, the Cassie-Baxter model was used quantify the surface forces as presented in Fig. 3a. According to the above analysis, two forms of damage caused the decrease in the water contact angle of the superhydrophobic surfaces.
Figure 3
Figure 3.
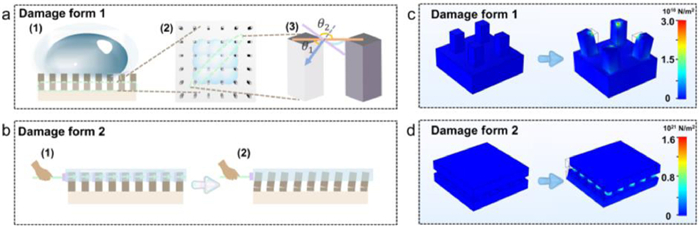
Simulation for the surface damage caused by the expansion force imposed by the water–ice phase transition and the external force required to deice the surface. (a) Illustration of the mechanism of water droplet expansion damage. (b) Illustration of mechanical damage caused during deicing. (c) Visualization of the finite element simulation results of the damage caused by the volume expansion of water droplets. (d) Visualization of the finite element simulation results of the damage caused by the deicing process.
The first form of damage was due to the volume expansion of the water droplets during the water–ice phase transition, as shown in the illustration in Fig. 3a-l of the contact formed between the bottom of a droplet and the rough pillars on the surface. A meniscus formed between the water and superhydrophobic surface, which is an ideal model superhydrophobic surface in the Cassie-Baxter model (Fig. 3a-2) [39]. The force direction was determined as the intersection angle between the water-substrate phase contact line and a horizontal line, as shown in Fig. 3a-3. The apex of a single pillar was the contact point of the water droplet on the solid substrate. Taking SF1 and SF2 in their original states as an example, the average contact angles of a water droplet with a volume of 5 µL were 162.05° on SF1 and 157.65° on SF2, or an average value of 159.85° between the two surfaces. Thus, θ1 was taken angle of intersection between the tri-phase contact line and tangent to the contour of the water droplet and was calculated according to θ1 = θ2 - 90°, where θ2 was the average water contact angle on the surfaces of 159.85° (Fig. 3a-3). The expansion force during the water-ice phase change is between 9408 and 19,600 N/cm2, and a drop of water (5 µL) had a contact area of 4.135 × 10⁻⁷ m2 with the substrate, so that an expansion force of 7.725 × 10⁻⁴ N was subjected to a single apex of the pillar. Additional details of these estimates are provided in the Methods 1.3.3 (Supporting information). The second form of damage was caused by the deicing force used during the deicing process. The average force was distributed evenly on all pillars and exceeded the adhesion force between the micro-nano particles and the resin, which resulted in detachment of the particles (Fig. 3b).
To investigate the first form damage, we simulated the water expansion processes utilizing finite element methods. The Young' s moduli of the pillars and the bottom square were defined based on the known moduli of the silica and fluorinated resin, respectively (Methods 1.3.3 in Supporting information). The simulated results for the water expansion processes are shown in Fig. 3c. When the estimated force was applied to the apex of the pillars, the stress concentrated at the joint between the pillars and the bottom square, and the bottom square slightly deformed. To better illustrate water expansion damage to the superhydrophobic surfaces, experiments simulating 10 icing-melting cycles were also performed (Methods 1.2.7 in Supporting information). The changes in the arithmetic mean roughness (Ra) and surface energy were recorded before and after each cycle. As shown in Fig. S11 (Supporting information), the Ra measured for both SF1 and SF2 decreased slightly to 85.1% (from 2.572 µm to 2.188 µm) and 86.2% (from 2.415 µm to 2.082 µm), respectively, of the corresponding as-prepared surface. The surface energy of SF1 increased slightly from 17.31 mJ/m2 to 26.18 mJ/m2 after 10 icing-melting cycles, while that of SF2 remained around 24.5 mJ/m2. Therefore, it can be inferred from the simulated and experimental results described above that the decrease in the surface roughness was due to the expansion force applied to the surfaces during the icing and melting cycles, which altered the wetting of both superhydrophobic coatings.
The second form of superhydrophobic surface damage (i.e., deicing process) was also simulated using finite element methods. An ice cubic layer that was the same size as the bottom square of the sample was placed on top of the pillars. When a force was applied to one side of the ice layer, the average shear stress, τice, on all pillars exceeded the bond force between the semi-embedded silica particles and the organic resin. Thus, the applied stress concentrated at the joints between the pillars and the square base, and the pillars collapsed and moved with the surrounding adhesive because the Young's modulus of the pillars was higher than that of the ice cube (Fig. 3d and Fig. S10 in Supporting information). The Ra and surface energy of SF1 and SF2 were also experimentally measured before and after 10 icing-deicing cycles (Fig. S12 in Supporting information). The Ra of SF1 and SF2 both dropped significantly to 52.2% (from 2.572 µm to 1.346 µm) and 51.5% (from 2.415 µm to 1.245 µm), respectively, compared with the as-prepared surfaces. The surface energy of the SF1 coating increased from 17.31 mJ/m2 to 66.62 mJ/m2, while the surface energy of the SF2 coating remained approximately constant at 24.5 mJ/m2. These simulated and experimental results show that both the Ra and surface energy of the SF1 coating changed drastically during the icing-deicing cycles, while only the Ra of the SF2 coating changed. Moreover, it is worth noting that a more significant decrease in Ra was measured after the icing-deicing cycles than after the icing-melting cycles, suggesting that the deicing force caused more surface damage than the water-ice expansion force during the droplet freezing.
The results of the simulations and experiments suggested that the point of structural failure was the weak bond that formed between the organic resin and micro-nano particles. The decrease in surface roughness associated with this failure led to the decrease in water contact angle and increase in the deicing shear stress after multiple icing–deicing cycles. However, there were subtle differences in the surface morphologies of SF1 and SF2 after multiple icing–deicing cycles. The micro-structures of SF1 after multiple icing–deicing cycles are shown in Fig. S13 (Supporting information). It was observed that the SF1 surfaces after 10th icing–deicing cycle could be divided into two regions, regions with sparse particles and regions of flat adhesive. In addition, the surface energy increased to 66.62 mJ/m2, which approached the value of the neat flat fluorocarbon resin of 71.23 mJ/m2 (Fig. S12). By comparison, the silica particles remained embedded in the fluorocarbon resin in the SF2 sample after the 10th icing–deicing cycle (Figs. S14e and f in Supporting information), and the surface energy remained around 24.5 mJ/m2 (Fig. S12). The above results suggested that SF1 was unsuitable for use as a large-scale anti-icing coating due to the irreversible decrease in surface roughness over multiple icing–deicing cycles. Meanwhile, the SF2 anti-icing coating prepared by the one pot method had a consistent composition throughout the depth of the film, and the surface roughness could be recovered.
While the decrease in the water contact angle on the SF1 coating after multiple icing–deicing cycles was irreversible, the superhydrophobicity of the SF2 coating was easily recovered by abrading the surface with sandpapers (Fig. 4a, Figs. S15 and S16 in Supporting information). The changes in the surface morphology of the failed SF2 coating after it was abraded with sandpaper were also studied with SEM and Surface 3D Optical Profilometry. The failed SF2 surface was flat after the rough structure collapsed from the expansion and deicing forces (Fig. 4b-1, Figs. S14e and f in Supporting information); however, groove-like scratches were present on the surface after it was abraded with sandpaper (Fig. 4b-2, Fig. S17 in Supporting information). These changes in surface morphology were due to the coarse texture of the sandpaper. It could be clearly seen that the width of the scratches left on SF2 coating was equal to the size of the abrasive (SiC) on the corresponding sandpaper.
Figure 4
Figure 4.
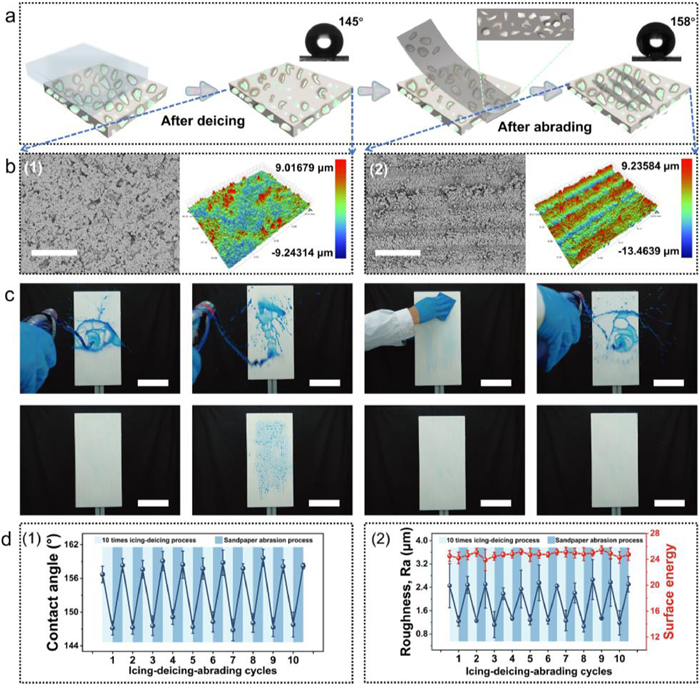
Performance of the SF2 coating after multiple roughness restoration cycles. (a) Illustration of the restoration of the SF2 roughness after an icing–deicing–abrasion process. (b) SEM image and surface profile image of the changes in the surface structure of SF2 during the icing–deicing–abrasion process; (b-1) Surface morphology of SF2 after 10 icing–deicing cycles; (b-2) Surface morphology of SF2 after sandpaper (grit No. 240, applied pressure: 1.5 N/cm2) abrasion (scale bar: 100 µm). (c) Changes in the superhydrophobicity of SF2 on wood board during one icing–deicing–abrasion cycle (scale bar: 10 cm). (d-1) Changes in the water contact angle on SF2 throughout 10 icing-deicing-abrasion cycles. (d-2) Changes in the roughness (Ra) and surface energy of SF2 throughout 10 icing–deicing–abrasion cycles.
The influence of the sandpaper grit number and applied pressure on the recovered surface morphology were also investigated (Methods 1.2.8 and Fig. S16 in Supporting information). The results showed that the superhydrophobicity of the SF2 coating could only be recovered with certain grits of sandpapers (Fig. S18 in Supporting information), and the recovery effect weakened with increasing grit numbers. Specifically, the properties of the failed SF2 coatings were not recovered in samples treated with sandpaper grit No. > 800. Furthermore, experiments where the applied pressure during the sandpaper abrasion was varied showed that the hydrophobicity increased with increasing applied pressure during the recovery process (Fig. S19 in Supporting information). Those above results clearly show that treating the SF2 samples with more coarse-grained sandpapers (grit No. ≤ 800) and higher downward pressures easily restored the surface roughness.
The differences in the recovered roughness with different grit numbers of sandpaper were explained by Cassie-Baxter theory (Eq. 1).
(1)
where f1 is the water–solid contact area fraction, θ is the apparent water contact angle, θ1 is the intrinsic water–solid contact angle. Such that the increase of f1 will lead to a decrease in the apparent contact angle, θ, when θ1 is nondimensional constant. Treating the surface with higher grit numbers sandpaper resulted in finer surface structures formed by the SiC particles, and therefore, the recovered surface morphology had a lower roughness (Fig. S17) and larger contact area fraction, f1, as the grit number increased (Fig. S20 in Supporting information).
The above results suggest that the SF2 coating can prepared on a large scale and applied in practical anti-icing scenarios. To demonstrate this potential, a wood board with dimensions of 10 × 50 cm2 was coated by SF2 and tested the anti-icing properties of the treated wood board with water dyed with methylene blue (Fig. 4c). The wetting ability experiments showed that no droplets remained on the as-prepared SF2 board. On the contrary, water droplets adhered at multiple locations on the deiced SF2 surface. However, after the surface was quickly abraded with 400 grit sandpaper, no water droplets adhered to the coated wood board when it was splattered with dyed water again, showing that the recovered SF2 coating was able to resist ice formation. These results demonstrate that a simple and convenient sandpaper abrasion process effectively restored the superhydrophobic, anti-icing properties of SF2.
The durability of SF2 anti-icing coating after multiple icing–deicing-abrasion cycles was also investigated (Methods 1.2.9 in Supporting information), and the wettability, surface energy and roughness after each cycle were recorded. As the number of icing–deicing-abrasion cycles increased, the water contact angle fluctuated between 145° and 158° (Fig. 4d-1). The surface energy of SF2 varied slightly around 25 mJ/m2 while the Ra decreased significantly after multiple icing–deicing cycles to an average value of 1.24 µm. Fortunately, the Ra increased dramatically to an average value of 2.45 µm after the surface was abraded with sandpaper (Fig. 4d-2). These results highlight that the SF2 prepared by the one pot method enables the easy and reproducible recovery of the surface roughness, which is of practical importance for industry. Moreover, the reduction in the coating thickness after the icing–deicing-abrasion cycles was also measured. The average decrease in the thickness was 86.56 µm after multiple icing-deicing processes (10 icing–deicing cycles), and there was only a minimal further decrease of 10.25 µm after the abrasion process (Fig. S21 in Supporting information). Hence, a 1000 µm thick SF2 coating could maintain its anti-icing performance over more than 100 icing–deicing cycles. Compared with the SF1 coating that irreversibly failed after 10 icing–deicing cycles, the SF2 coating can be used as a long-lasting, low-cost, superhydrophobic, anti-icing treatment. In addition, the SF2 coating simultaneously displayed a great chemical stability because its water contact angle remained as high as the initial stage when exposed under the conditions of extreme pH (Fig. S22 in Supporting information) or UV radiation for 24 h (Fig. S23 in Supporting information).
Two strategies were employed to fabricate superhydrophobic anti-icing surfaces. Two kinds of superhydrophobic anti-icing coatings exhibited excellent static and dynamic ice-phobic properties. Unfortunately, the surface roughness of the SF1 superhydrophobic coating irreversibly collapsed after multiple icing–deicing cycles, and the surface thus lost its superhydrophobic and anti-icing properties. Finite element simulations and corresponding experimental measurement results showed that the decrease in roughness was caused by the forces exerted on the surface during the water–ice phase change and deicing process and was the primary cause of the coating failure. However, the superhydrophobicity of the SF2 coatings was easily recovered by abrading the surface with sandpaper (grit No. ≤ 800) and higher downward pressures. Further extending the number of icing–deicing–abrasion cycles showed that a 1000 µm thick coating could resist 100 icing–deicing cycles. However, it should be noted that too low grit number of sandpaper and too high download pressure will seriously shorten the life of the SF2 coating. Therefore, the operator can choose a compromise, choosing 600 grit or 800 grit sandpaper and a relatively low download pressure, which can easily and quickly restore the coating's superhydrophobic and anti-icing properties while maximizing the coating's lifespan. Overall, this work provides novel insights into the design of recoverable superhydrophobic anti-icing coatings, facilitating the preparation of practical and durable anti-icing coatings for a wide range of applications.
Declaration of competing interest
The authors declare that they have no known competing financial interests or personal relationships that could have appeared to influence the work reported in this paper.
Acknowledgments
This work was supported by the National Natural Science Foundation of China (No. 32171693), the Fundamental Research Funds for the Central Universities (No. 2572021CG02) and the Fundamental Research Funds for the Central Universities (No. 2572017AB16).
Supplementary materials
Supplementary material associated with this article can be found, in the online version, at doi:10.1016/j.cclet.2023.108353.
[1]
M.J. Kreder, J. Alvarenga, P. Kim, J. Aizenberg, Nat. Rev. Mater. 1 (2016) 15003. doi: 10.1038/natrevmats.2015.3
[2]
P. Irajizad, M. Hasnain, N. Farokhnia, et al., Nat. Commun. 7 (2016) 13395. doi: 10.1038/ncomms13395
M. Tenjimbayashi, S. Samitsu, M. Naito, Adv. Funct. Mater. 29 (2019) 1900688. doi: 10.1002/adfm.201900688
[37]
G. Graeber, M. Schutzius Thomas, H. Eghlidi, D. Poulikakos, Proc. Natl. Acad. Sci. U. S. A. 114 (2017) 11040–11045. doi: 10.1073/pnas.1705952114
[38]
S.H. Lee, M. Seong, M.K. Kwak, et al., ACS Nano 12 (2018) 10693–10702. doi: 10.1021/acsnano.8b05109
[39]
V. Bahadur, L. Mishchenko, B. Hatton, et al., Langmuir 27 (2011) 14143–14150. doi: 10.1021/la200816f
Figure 1
Illustration of damage to SF1 and SF2 coatings. (a) Illustration of the ice formation mechanism on untreated, SF1-coated, and SF2- coated substrates. (b) Illustration of the water droplet to ice transition on a superhydrophobic coating. (c) Illustration of different forms of surface damage caused with the water–ice phase transition. Damage form 1 is caused by volume expansion of water droplets during the water–ice phase transition. Damage form 2 is caused by the external force used to remove the ice layer during the deicing process. (d) Illustration of roughness restoration to SF2.
Figure 2
Anti-icing and deicing performance of SF1 and SF2 coated surfaces. (a) Pictures of water droplets freezing process on untreated, SF1-coated, and SF2-coated aluminum plates (The data in the lower right corner were the time point when the water droplet is freezing). (b) Picture of a continuous water stream freezing on untreated, SF1-coated, and SF2-coated aluminum plates (The data in the lower right corner were the freezing times of the dynamic droplets on different surface). (c) Shear stresses required to remove an ice cube during 10 icing–deicing cycles on untreated, SF1-coated and SF2-coated aluminum plates.
Figure 3
Simulation for the surface damage caused by the expansion force imposed by the water–ice phase transition and the external force required to deice the surface. (a) Illustration of the mechanism of water droplet expansion damage. (b) Illustration of mechanical damage caused during deicing. (c) Visualization of the finite element simulation results of the damage caused by the volume expansion of water droplets. (d) Visualization of the finite element simulation results of the damage caused by the deicing process.
Figure 4
Performance of the SF2 coating after multiple roughness restoration cycles. (a) Illustration of the restoration of the SF2 roughness after an icing–deicing–abrasion process. (b) SEM image and surface profile image of the changes in the surface structure of SF2 during the icing–deicing–abrasion process; (b-1) Surface morphology of SF2 after 10 icing–deicing cycles; (b-2) Surface morphology of SF2 after sandpaper (grit No. 240, applied pressure: 1.5 N/cm2) abrasion (scale bar: 100 µm). (c) Changes in the superhydrophobicity of SF2 on wood board during one icing–deicing–abrasion cycle (scale bar: 10 cm). (d-1) Changes in the water contact angle on SF2 throughout 10 icing-deicing-abrasion cycles. (d-2) Changes in the roughness (Ra) and surface energy of SF2 throughout 10 icing–deicing–abrasion cycles.

 DownLoad:

 下载:
下载:


