Citation:
Jie Xu, Yi Lai, Fengyang Wang, Zhifeng Zou, Renjun Pei, Haijun Yu, Zhiai Xu. Dual stimuli-activatable versatile nanoplatform for photodynamic therapy and chemotherapy of triple-negative breast cancer[J]. Chinese Chemical Letters,
2023, 34(12): 108332.
doi:
10.1016/j.cclet.2023.108332
Dual stimuli-activatable versatile nanoplatform for photodynamic therapy and chemotherapy of triple-negative breast cancer
English
Dual stimuli-activatable versatile nanoplatform for photodynamic therapy and chemotherapy of triple-negative breast cancer
School of Chemistry and Molecular Engineering, East China Normal University, Shanghai 200241, China
b.
State Key Laboratory of Drug Research & Center of Pharmaceutics, Shanghai Institute of Materia Medica, Chinese Academy of Sciences, Shanghai 201203, China
c.
Key Laboratory for Nano-Bio Interface Division of Nanobiomedicine Suzhou Institute of Nano-Tech and Nano-Bionics Chinese Academy of Sciences, Suzhou 215123, China
Received Date:
19 December 2022 Accepted Date:
09 March 2023 Revised Date:
07 March 2023 Available Online:
15 December 2023
Abstract:
Photodynamic therapy (PDT) has emerged as an efficient cancer treatment method with minimal invasiveness. However, the majority of current photosensitizers (PSs) display severe dark toxicity and low tumor specificity due to their "always-on" photoactivity in blood circulation. To address this concern, we herein report a series of acid-activatable PSs for ultrasensitive PDT of triple-negative breast tumors. These set of novel PSs are synthesized by covalently modifying tetrakis(4-carboxyphenyl)porphyrin (TCPP) with a variety of tertiary amines for acidity-activatable fluorescence imaging and reactive oxygen species (ROS) generation. The resultant TCPP derivatives are grafted with a poly(ethylene glycol) (PEG) chain via a matrix metalloproteinase-2 (MMP-2)-liable peptide spacer and chelated with Mn2+ for magnetic resonance imaging (MRI) capability. The PEGylated TCPP derivatives are amphiphilic and self-assemble into micellar nanoparticles to elongate blood circulation and for tumor-specific PDT. We further demonstrate that the PEGylated TCPP nanoparticles could serve as a nanoplatform to deliver the anticancer drug doxorubicin (DOX) and perform fluorescence image-guided combinatorial PDT and chemotherapy, which efficiently suppress the growth of 4T1 breast tumors and lung metastases in a mouse model. These acid-activatable PS-incorporated nanoparticles might provide a versatile platform for precise PDT and combinatorial breast cancer therapy.
Triple-negative breast cancer (TNBC) is one of the most aggressive breast cancer subtypes and accounts for the majority of breast cancer cases among the female population [1,2]. To date, conventional therapeutic strategies, including surgical resection, chemotherapy and radiotherapy (RT), are the mainstream clinical treatments for TNBC; unfortunately, the therapeutic benefits of these approaches are restricted by severe side effects and the occurrence of drug resistance [3,4]. Alternatively, photodynamic therapy (PDT), which produces reactive oxygen species (ROS) to kill tumor cells, has attracted considerable attention in breast cancer therapy owing to its spatial-temporally controllable activity and noninvasive characteristics [5-7]. However, most of the current photosensitizers (PSs) employed for PDT are based on "always-on" fluorophores [8], which cause severe dark toxicity and have low tumor specificity, as well as produce unsatisfactory therapeutic results [9-11].
Novel PSs have been engineered to target tumor-specific biomarkers such as γ-glutamyl transferase, nitroreductase [12], human epidermal growth factor receptor-2 (Her-2) [13] and epidermal growth factor receptor (EGFR) [14]. However, only a subset of tumors express these biomarkers [15,16], and the development of PSs that are specifically activated in the tumor microenvironment remains a great challenge for cancer PDT [17,18]. Thus, the development of PSs that respond to endogenous stimuli, including pH [19-22], enzyme [23-25], hypoxic [26,27] and redox reactions [28-31], has emerged as a promising approach to improve PS bioavailability. It has been shown that a broad spectrum of solid tumors have a deregulated extracellular pH (i.e., 6.5–6.8) due to anaerobic glycolysis [32,33]. Apart from the extracellular acidic tumor microenvironment, the pH values are also decreased in the endosomal (pH 6.3–5.5) and lysosomal versicles (pH 4.5) [34-37]. Therefore, it is highly desirable to develop acid-responsive PSs for precise cancer PDT.
To this end, we first synthesized a series of ultrasensitive acid-activatable PSs with tunable pKa values by substituting the four carboxyl groups of tetrakis(4-carboxyphenyl)porphyrin (TCPP) with a variety of tertiary amines. In this way, this series of molecules could have a pH-responsive property that is opposite that of TCPP [38], which means they are activated in acidic environments but quenched in alkaline environments. On this basis, nanoplatforms using the TCPP derivatives as hydrophobic pH-sensitive cores to control micelle dissociation were generated. The micellar nanoparticles were self-assembled by the poly(ethylene glycol) (PEG)-modified TCPP derivatives via a matrix metalloproteinase-2 (MMP-2)-liable peptide spacer for tumor-specific penetration and good antitumor potency. Subsequently, the aromatic cores of the TCPP derivatives in the obtained amphiphilic complexes were coordinated with Mn2+ for acid-responsive magnetic resonance imaging (MRI). The chemotherapeutic agent doxorubicin (DOX) was further loaded into the hydrophobic core of the micelles for combinatorial PDT and chemotherapy in a 4T1 TNBC tumor model. It was demonstrated that the acid-activatable PS nanoparticles were specifically activated at the tumor site and efficiently suppressed the growth of 4T1 breast cancer tumors in a mouse model by dual-modal image-guided synergetic therapy (Scheme 1). Overall, this pKa-tunable nanoplatform for dual-modal image-guided combinatorial therapy of TNBC might reduce the dark toxicity of PSs for tumor-specific PDT of TNBC.
Scheme 1
Scheme 1.
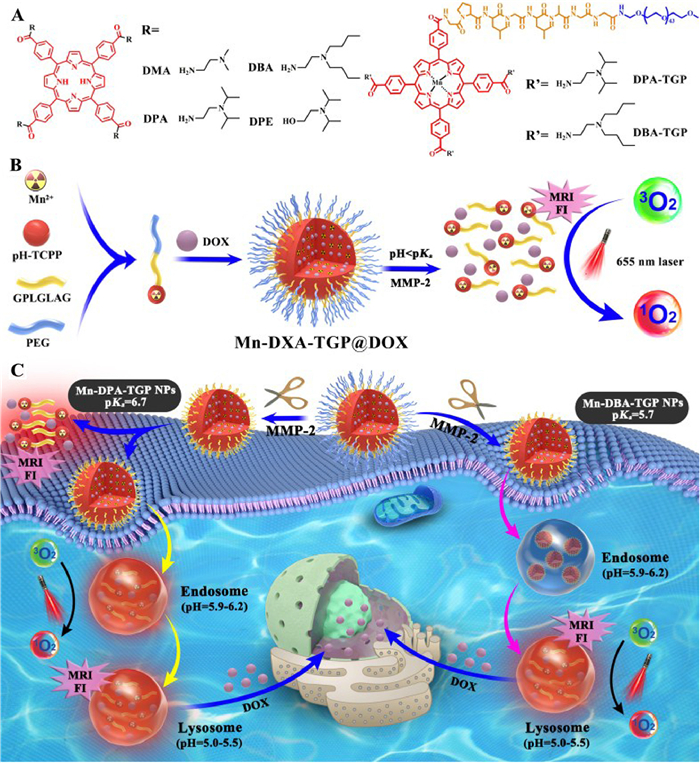
(A) Chemical structures of the tertiary amine-modified TCPP derivatives. The PEG chain was further coupled with the TCPP derivatives via a GPLGLAG peptide spacer. (B) Self-assembly and acid-activatable FI/MRI profiles of Mn-DXA-TGP@DOX nanoparticles. (C) Schematic illustration of the Mn-DXA-TGP@DOX nanoparticles for fluorescence and magnetic resonance dual-modal image-guided combinatorial PDT/chemotherapy against cancer.
To prepare acid-activatable PSs, the four carboxylic groups of TCPP were substituted by four kinds of tertiary amines: N, N-dimethylethylenediamine (DMA), N, N-diisopropylethylenediamine (DPA), N, N-dibutylethylenediamine (DBA) and 2-diisopropylaminoethanol (DPE). The obtained TCPP derivatives were named DMA-TCPP (pKa = 7.5), DPA-TCPP (DPA) (pKa = 6.7), DBA-TCPP (DBA) (pKa = 5.7) and DPE-TCPP (pKa = 4.9), respectively (Fig. 1A). Mass spectrometry (MS) analysis validated the successful synthesis of the amino-modified TCPPs (pH-TCPPs) (Fig. S2 in Supporting information).
Figure 1
Figure 1.
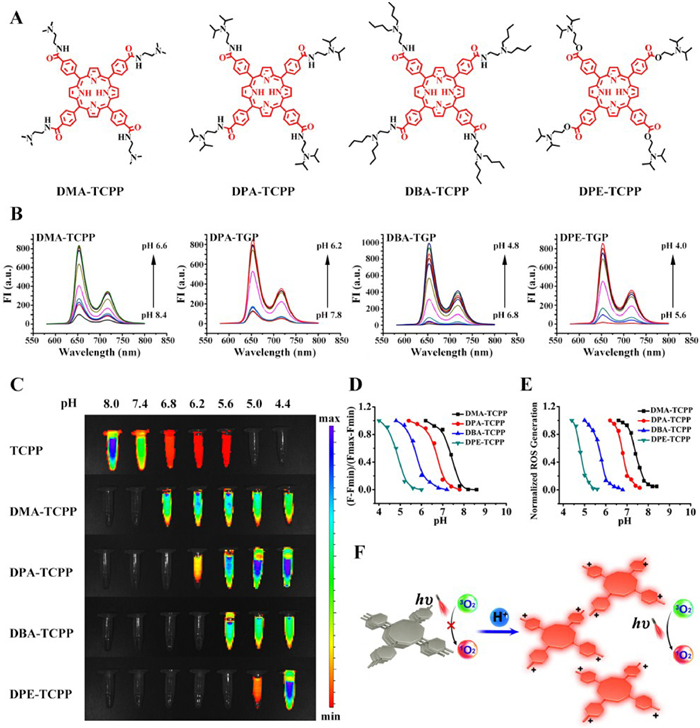
Acid-activated property of pH-TCPPs. (A) The molecular structures of the four pH-TCPPs. (B) pH-responsive fluorescence spectra of the acid-activated pH-TCPPs in BR buffer at a series of different pH values. (C) FL imaging of TCPP and different pH-TCPPs. (D) Acid-activated fluorescence property of pH-TCPPs. (E) Acid-activated ROS generation property of pH-TCPPs. (F) Mechanism of the acid-activated property of pH-TCPPs.
The acid-triggered fluorescence properties of the pH-TCPPs were evaluated using fluorescence spectrometer by incubating the pH-TCPPs in Britton-Robison (BR) buffer at different pH values and measuring the fluorescence intensity with a fluorescence spectrometer (Fig. 1B). The fluorescence signals of DMA-TCPP, DPA-TCPP, DBA-TCPP and DPE-TCPP increased by 8-, 7-, 11- and 50-fold, respectively, in acidic BR buffer (pH = 6.4, 6.0, 5.2 and 4.2, respectively) compared to the fluorescence signals detected at pH 7.4. In contrast, the fluorescence of TCPP was quenched as the pH decreased (Fig. S1 in Supporting information). The apparent pKa values of the pH-TCPPs were 7.5, 6.7, 5.7 and 4.9, as calculated by fitting of the fluorescence spectra data (Table S1 in Supporting information). The fluorescence of the pH-TCPPs was quenched at pH 7.4 but recovered when the pH was lower than their pKa (Fig. 1C). DPA-TCPP and DPE-TCPP shared a same tertiary amine group but with different linkage. For DPA-TCPP it was acid amide, while for DPE-TCPP it was an ester bond. N atoms in acid amide were easier to binding with protons than ester bond. In another word, ester bond tended to dissociate with proton resulting in a lower pKa. Moreover, the fluorescence quantum yields (QYs) of TCPP, DPA-TCPP and DBA-TCPP at different pH values were detected by fluorescence spectroscopy and ultraviolet–visible (UV–vis) spectroscopy using Ce6 as a reference (QY = 0.18 at pH 7.4, 0.16 at pH 6.4, 0.15 at pH 5.4) (Fig. S3 and Table S2 in Supporting information) [39]. For the TCPP molecules, the QY was positively correlated with pH. In contrast, the QYs of the DPA-TCPP and DBA-TCPP molecules gradually decreased as the pH increased and sharply decreased around the pKa. For DPA-TCPP, the QY was 0.028 at pH 7.4, but rose to 0.044 at pH 6.4 and then to 0.052 at pH 5.4. For DBA-TCPP, the QYs were 0.012, 0.013 and 0.042 at a pH value of 7.4, 6.4 and 5.4, respectively. These results further indicated the acid-responsive property of the pH-TCPPs.
To exploit the pH-dependent photoactivity of the pH-TCPPs, 9,10-anthracenediyl-bis(methylene)dimalonic acid (ABDA) was used as a singlet oxygen (1O2) indicator (Fig. 1D) [40]. Similar to the acid-activated fluorescence property, DMA-TCPP, DPA-TCPP, DBA-TCPP and DPE-TCPP displayed no photoactivity at pH 7.4, but their photoactivity was dramatically activated at acidic pH (Fig. 1E). This could be explained by protonation of the tertiary amine moiety and reversion of the aggregation-caused quenching (ACQ) effect [41]. The pH-TCPPs aggregate in alkaline environments, while the tertiary amines are ionized with the addition of H+, which is followed by separation of the pH-TCPPs. The pH-TCPPs could then again emit fluorescence and produce singlet oxygen in an acidic environment (Fig. 1F).
Reversible changes were further detected in the absorption spectra of the pH-TCPPs as shown in Fig. S4 (Supporting information). First, pH-TCPPs at the same concentration were dissolved in alkaline buffer, and the absorption spectra were acquired. Then, acid was added, and the absorption spectra were again obtained. With dissociation of the pH-TCPP aggregates, the absorbance peak became more intense, and a redshift occurred. When the pH was again made alkaline, the absorption spectra were almost the same as those before acid treatment. This confirmed that the aggregation of the pH-TCPPs were reversible with changes in pH and that the pH-TCPPs were stable in acidic environments [42].
To achieve specific tumor delivery and accumulation, acid-activated micelles were further developed based on the acid-activated pH-TCPP molecules. DPA-TCPP with a pKa of 6.7 could be activated in the tumor milieu and early endosomes of tumor cells. Additionally, DBA-TCPP with a pKa of 5.7 could emit fluorescence only at the lysosomes of tumor cells. Hence, these two kinds of pH-TCPPs were chosen to be made into multifunctional micelles.
The novel acid-activated micelles were synthesized by modifying pH-TCPPs with an enzyme-cleavable PEG corona via a GPLGLAG heptapeptide spacer [9,43], namely, DPA/DBA-TCPP-GPLGLAG-PEG (DPA/DBA-TGP). To prepare the multifunctional micelles, PEG was first linked to the GPLGLAG peptide via an amidation reaction with HOBt and EDCI. Then, TCPP was linked via an acylation reaction through the oxalyl chloride of TCPP, followed by the quick addition of DPA or DBA (Fig. S5 in Supporting information). 1H NMR analyses proved the successful synthesis of the DPA-TGP and DBA-TGP polymers (Fig. S6 in Supporting information).
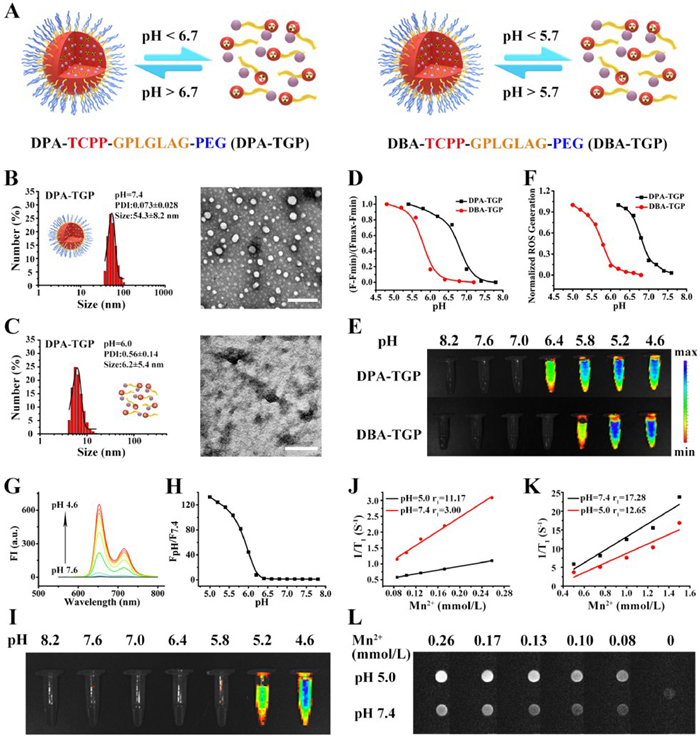
The drug-free DPA/DBA-TGP micelles were prepared by the nanoprecipitation method according to a previously published procedure (Fig. 2A) [44,45]. The pH-responsive property of the micelles was examined by dynamic light scattering (DLS) measurements (Figs. 2B and C). The DPA-TGP micelles displayed an average hydrodynamic diameter of 54.3 nm and a narrow polydispersity index (PDI) of 0.073 at pH 7.4. The size of the DPA-TGP micelles remained stable at pH ≥ 7.4 but significantly decreased at pH ≤ 6.0 with an increasing PDI. The transmission electron microscopy (TEM) images in Figs. 2B and C showed that the as-prepared DPA-TGP micelles had a spherical morphology with a uniform size of 45 nm, which was consistent with the DLS results. In contrast, the size distribution of the DPA-TGP micelles became heterogeneous upon incubation with pH 6.0 BR buffer due to protonation of the amine. The DBA-TGP micelles displayed similar properties (Fig. S8 in Supporting information). The acid-responsive property of these micelles was further investigated by measuring the fluorescence in BR buffer at a series of pH values. The pKa values of the DPA-TGP micelles and DBA-TGP micelles were 6.7 and 5.7, respectively (Fig. 2D). The fluorescence intensity of the DPA-TGP micelles at pH 6.0 was 4-fold higher than that found at pH 7.4. Additionally, the fluorescence intensity of the DBA-TGP micelles at pH 5.0 was 7 times higher than that found at pH 7.4. As shown in Fig. 2E, the strong fluorescence intensity of the DPA-TGP and DBA-TGP micelles in acidic buffer gradually decreased with increasing pH. Fluorescence imaging also indicated that the DPA-TGP and DBA-TGP micelles had different transition points. The pH-responsive property may also be explained by protonation of the DPA/DBA amine group nitrogen atoms, which led to the inner portion of the pH-TCPPs on the polymer chain becoming hydrophilic and micelle dissociation. DPA is hydrophobic at pH > 6.7; thus, the micelles would not dissociate and the DPA-TCPP inside the micelles would be in an aggregated state, causing homo-fluorescence resonance energy transfer (Homo-FRET) to quench the fluorescence of the DPA-TGP micelles [46].
Figure 2
Figure 2.
Physiochemical characterization of DPA/DBA-TGP. (A) Dissociation of the DPA-TGP and DBA-TGP micelles. (B) DLS and TEM images of the DPA-TGP micelles at pH 7.4 (scale bar: 200 nm). (C) DLS and TEM images of the DPA-TGP micelles at pH 6.0 (scale bar: 200 nm). (D) Acid-activated fluorescence property of the DPA/DBA-TGP micelles. (E) Fluorescence imaging of DPA/DBA-TGP micelles in BR buffer at different pH values. (F) Acid-activated ROS generation property of the DPA/DBA-TGP micelles. (G) Curves of Mn-DBA-TGP fluorescence at different pH values. (H) Acid-activated fluorescence property of the Mn-DBA-TGP micelles. (I) Fluorescence imaging of the Mn-DBA-TGP micelles at different pH values. (J) r1 values of Mn-DBA-TGP at pH 7.4 and pH 5.0. (K) r1 values of Mn-TGP at pH 7.4 and pH 5.0. (L) MRI of Mn-DBA-TGP at pH 7.4 and pH 5.0 at different Mn2+ concentrations.
Furthermore, the acid-responsive ROS generation property of the micelles was further investigated with the ROS indicator ABDA. The generation of ROS increased with increasing exposure time to irradiation but gradually slowed down after 10 min of irradiation (Fig. S9 in Supporting information). We therefore determined to irradiate for 10 min to study the effect of pH on the generation of ROS. DPA-TGP exhibited 28-fold greater ROS generation at pH 6.0 than at pH 7.4, while the DBA-TGP micelles showed 35-fold greater ROS generation at pH 5.0 than at pH 7.4. These data were in accordance with the fluorescence response activity results, since the pKa values of these compounds were 6.7 and 5.7, respectively (Fig. 2F). These results demonstrated the acid-induced recovery of photoactivity property of these compounds.
In addition to an acidic environment, enzymes are another biological stimulus that micelles can respond to. MMPs are enzymes that decompose the extracellular matrix (ECM) and promote the spread and metastasis of tumor cells [47,48]. Therefore, we examined the MMP-2-responsive properties of the nanoparticles by measuring the changes in size and PDI upon treatment with MMP-2. The micelles were incubated with MMP-2 in TNBC buffer at pH 7.4. After 1 h of incubation, the PDI of the DPA-TGP micelles increased and their size decreased as determined by DLS measurements. Their size gradually increased to 100 nm with an increasing PDI after 5 h of incubation (Fig. S10 in Supporting information), indicating the occurrence of MMP-2-mediated cleavage of the PEG corona. It was thought that decomposition of the micelles by MMP-2 left the acid-activated core of the micelles to aggregate in pH 7.4 buffer. DLS analysis confirmed that the GPLGLAG peptide was synthesized successfully in the micelles and that the micelles could sensitively respond to MMP-2. When the micelles gathered at the tumor site by the enhanced permeability and retention (EPR) effect, the GPLGLAG peptide could be recognized and degraded by MMP-2 so that the micelles would be retained in the ECM, enhancing PDT efficacy and reducing dark toxicity.
To further demonstrate the potential to use the micelles for acid-activatable MRI, the T1-weighted MR phantom Mn2+ was then conjugated into the hydrophobic core of the DBA-TGP micelles by mixing MnAc2 with the DBA-TGP polymer [49]. Inductively coupled plasma-mass spectrometry (ICP-MS) examination determined that approximately 30% of the TCPP molecules were successfully chelated to Mn2+. The influence of Mn2+ on the acid-activatable property of the DBA-TGP micelles was first detected by fluorescence spectroscopy (Figs. 2G and H). It is worth noting that the pKa of Mn-DBA-TGP is 5.7, which is the same as that of DBA-TGP. The fluorescent intensity of Mn-DBA-TGP at pH 5.0 was 120-fold higher than that at pH 7.4, implying that the micelle was a superb and sensitive probe for imaging tumors. Fig. 2I showed that the fluorescence of the Mn-DBA-TGP micelles in acidic BR buffer was much brighter than that in alkaline buffer but was gradually quenched as the pH increased. The transition pH, the pH at which the fluorescence displayed a sharp decline, was the same as the pKa detected by fluorescence spectroscopy. Notably, the magnetic signal was linearly related to the concentrations of the micelles.
As shown in Figs. 2J, the longitudinal relativity (r1) of the Mn-DBA-TGP micelles at pH 5.0 was approximately 11.17, which was 4 times higher than the value of 3.00 obtained at pH 7.4. In contrast, the r1 of Mn-TGP at pH 7.4 was slightly larger than that at pH 5.0, which did not display acid-activated properties (Fig. 2K). Furthermore, the MRI images of Mn-DBA-TGP micelles with different concentrations of Mn2+ in BR buffer at pH 5.0 were brighter than those in BR buffer at pH 7.4 (Fig. 2L). This acid-activated MRI signal could be explained by dissociation of the micelles. The T1−MRI signals recovered as the r1 value was majorly attributed to the direct water coordination with Mn2+ [50]. When Mn2+ was within the core of the micelles, it was tetra-coordinated with four N atoms of TCPP molecules without exposure to water outside the micelles. However, when the micelles dissociated, the release of the hydrophobic DBA-TCPP end of the polymer chain was accompanied by the extra coordination with two H2O molecules with Mn2+, which led to an amplified MRI signal.
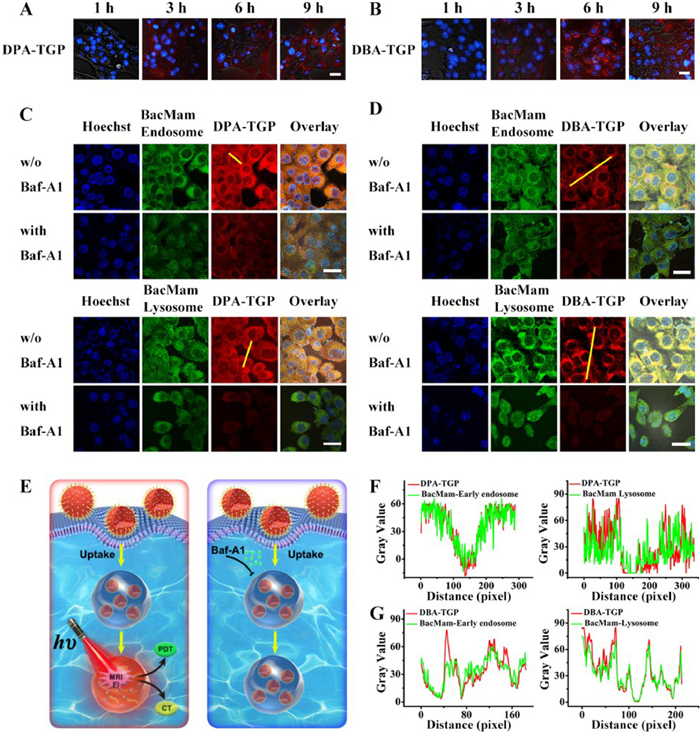
We next investigated the cellular uptake of DPA/DBA-TGP micelles by coincubating 4T1 cells with DPA/DBA-TGP micelles for the desired time durations (i.e., 1, 3, 6, 9 h), and the results were determined by confocal laser scanning microscopy (CLSM) (Figs. 3A and B). After 1 h of incubation, little fluorescence was observed from the micelles in the 4T1 cells. After 3 h of incubation, the red fluorescence from the DPA-TGP micelles in the tumor cells was much brighter in the 4T1 cells than that of the DBA-TGP micelles. It was assumed that at this time, a great deal of DPA-TGP micelles had already been transferred to the early endosomes, where they dissociated and started to emit fluorescence. However, for the DBA-TGP micelles, the pH in early endosomes was not low enough to cause complete micelle dissociation and fluorescence activation. After 6 h of incubation, the red fluorescence from the DBA-TGP micelles became much brighter and was located around the nuclei. After 9 h of incubation, the fluorescence intensity from the DPA/DBA-TGP micelles was almost the same as that from the micelles incubated for 6 h. In summary, the uptake of the micelles by 4T1 cells showed a time-dependent behavior. After 3 h of incubation, only the DPA-TGP micelles emitted fluorescence, and it was believed that at this time, the DPA-TGP micelles had reached the early endosomes. However, after 6 h of incubation, the micelles might be transferred to the lysosomes, because at this time, the DBA-TGP micelles began to emit fluorescence.
Figure 3
Figure 3.
Cellular uptake and colocalization of DPA/DBA-TGP nanopaticles in 4T1 cells. (A, B) CLSM images taken at different time intervals after the administration of (A) DPA-TGP and (B) DBA-TGP micelles to 4T1 cells (scale bar: 25 µm). (C) DPA-TGP and (D) DBA-TGP colocalized with BacMam-labeled early endosomes and BacMam-labeled lysosomes (scale bar: 25 µm). (Blue channel: λex = 405 nm, λem = 433–494 nm; green channel: λex = 488 nm, λem = 501–579 nm; red channel: λex = 552 nm, λem = 596–734 nm). (E) Schematic illustration of how Baf-A1 influences the behavior of DPA/DBA-TGP micelles after cellular uptake. (F) Colocalization plots of DPA-TGP micelles (yellow line in C). (G) Colocalization plots of DBA-TGP micelles (yellow line in D).
The acid-triggered intracellular activation of DPA/DBA-TGP micelles was then investigated in vitro in 4T1 cells. The fluorescence signals of DPA/DBA-TGP were abolished by pretreatment with bafilomycin A1 (Baf-A1), an H+-ATPase (V-ATPase) proton pump inhibitor, for 2 h (Figs. 3C and D), implying that intracellular protonation of the DPA/DBA moiety accounted for the recovery of DPA/DBA-TGP micelle fluorescence. This was because Baf-A1 inhibits the pumping of H+ into cells, making endosomes and lysosomes insufficiently acidic to activate the micelles (Fig. 3E). Moreover, the red fluorescence emitted by the DPA-TGP micelles colocalized well with the green fluorescence signal of BacMam Endosome, an early endosome transfection reagent (Fig. 3C), while the red fluorescence from the DBA-TGP micelles spotted around the nuclei colocalized well with the green fluorescence of BacMam Lysosome, a lysosome transfection reagent (Fig. 3D), indicating that both types of micelles were activated in different organelles. The fluorescence intensity profiles of the linear regions of interest across the cells stained with DPA-TGP micelles and BacMam Endosome colocalized well with a Pearson's colocalization coefficient (PCC) of 0.73, while those stained with DPA-TGP micelles and BacMam Lysosome varied with remarkable inconsistency to give a PCC of 0.34 (Figs. 3F and G). In contrast, DBA-TGP micelles showed good colocalization with the lysosomes (0.78) but poorly colocalization with early endosome vesicles (0.41), indicating that DBA-TGP could be activated only in the lysosomes.
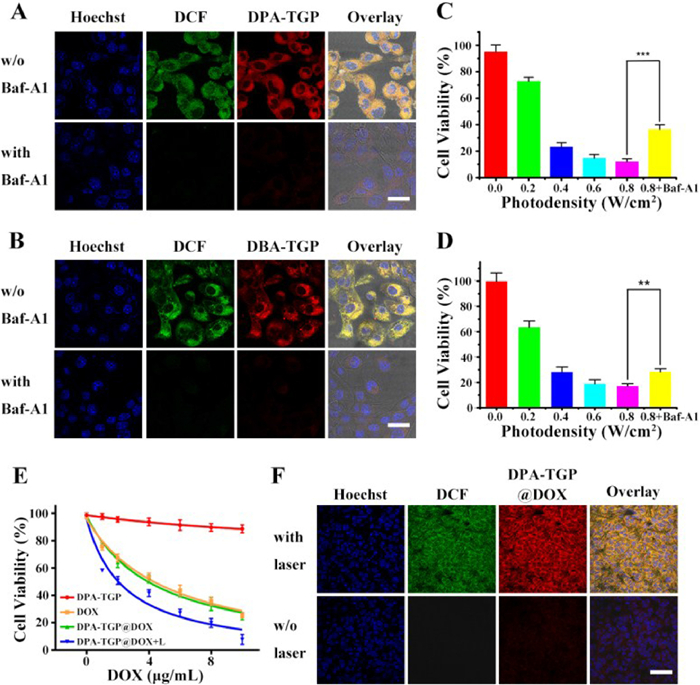
We also examined the ROS generation property of DPA/DBA-TGP micelles in vitro upon 655 nm laser illumination at a photodensity of 0.5 W/cm2 using the fluorescent ROS indicator 2′, 7′-dichlorofluorescein-diacetate (DCFH-DA). A strong green fluorescence signal assigned to DCF appeared in the 4T1 cells incubated with micelles and irradiated with laser for 2 min (Figs. 4A and B). In contrast, the green fluorescence was notably quenched in cells pretreated with Baf-A1. Such acid-triggered ROS generation in vitro could be explained by DPA/DBA protonation-induced dissociation of the micelles in the acidic environment.
Figure 4
Figure 4.
Acidic-responsive ROS generation of DPA/DBA-TGP nanoparticles in vitro. (A, B) Fluorescence images of 4T1 cells incubated with (A) DPA-TGP (B) DBA-TGP micelles and the ROS detector DCFH-DA. The fluorescence was quenched when Baf-A1 was added for preincubation with the cells (scale bar: 25 µm). (Blue channel: λex=405 nm, λem = 433–494 nm; green channel: λex = 488 nm, λem = 501–579 nm; and red channel: λex = 552 nm, λem = 596–734 nm). (C, D) Determination of the phototoxicity of (C) DPA-TGP and (D) DBA-TGP micelles by MTT assay. Statistical significance: t-test, n = 6, ***P < 0.001, **P < 0.01. (E) MTT assay of DPA-TGP@DOX micelles in combinatorial therapy. (F) CLSM examination of laser-triggered ROS generation in vivo (scale bar: 55 µm). (Blue channel: λex = 405 nm, λem = 433–494 nm; green channel: λex = 488 nm, λem = 501–579 nm; and red channel: λex = 552 nm, λem = 560–600 nm).
To evaluate the phototoxicity of the DPA/DBA-TGP micelles, 4T1 TNBC tumor cells were incubated with micelles for 24 h, then irradiated for 2 min with different photodensities and an additional 24 h of incubation. DPA/DBA-TGP micelles incubated with cells but without laser irradiation were used as controls. As shown in Figs. 4C and D, gradual phototoxicity was caused by the micelles in a photodensity-dependent manner. Notably, the DPA-TGP micelles induced 87.9% cell death when illuminated at a photodensity of 0.8 W/cm2. However, the death rate of the cells decreased significantly to 36.4% after Baf-A1 preincubation. Moreover, 83.0% of the 4T1 cells died when treated with DBA-TGP micelles together with laser irradiation at 0.8 W/cm2, but this ratio recovered to 71.7% when the cells were pretreated with Baf-A1. These results proved the acid-triggered phototoxicity induced by the DPA/DBA-TGP micelles.
To exploit the potential of the micelles for TNBC combinatorial therapy, the anticancer drug DOX was loaded into the hydrophobic core of the micelles to generate DPA/DBA-TGP@DOX. With a standard curve of DOX constructed by fluorescence spectroscopy measurements, the loading content (LC) of DOX in the DPA/DBA-TGP@DOX micelles was approximately 7 wt% (Fig. S11 in Supporting information). The toxicity of the DOX-loaded micelles to cancer cells was studied by MTT assay. DPA/DBA-TGP micelles without DOX encapsulation or laser irradiation were used as the controls. The death rate of the 4T1 cells treated with DOX-loaded micelles was almost the same as that of the hydrophilic DOX-treated cells at the same DOX dosage, indicating successful loading and release of hydrophobic DOX. In addition to DOX-loaded micelles, when laser irradiation was applied, the cell death rate reached 88.2%–91.6%, which was more than the death rate of the cells treated with only DOX-loaded micelles, proving the success of combinatorial therapy. Moreover, the micelles without loaded DOX produced a marginal effect on cell viability, as the relative cell survival in the DPA/DBA-TGP group was 88.6% and that in the DPA/DBA-TGP group was 81.2% (Fig. 4E, Fig. S12 in Supporting information), validating the good biocompatibility of the acid-responsive nanoparticles.
We next explored the acid-responsive PDT effect by measuring ROS generation in vivo. Female BALB/c mice (5–6 weeks, 18 ± 2 g) were ordered from Shanghai Experimental Animal Center (Shanghai, China). All animal procedures were carried out under the guidelines approved by the Institutional Animal Care and Use Committee of East China Normal University. Each BALB/c mouse was implanted with two tumors on their back. After being injected with DPA-TGP@DOX micelles, the tumors were injected with the ROS probe DCFH-DA, and then one of the tumors was irradiated with a 655 nm laser for 5 min at a photodensity of 1 W/cm2. Immunofluorescence staining of the tumor sections post treatment revealed dramatic ROS generation in the tumor tissue irradiated with the laser (Fig. 4F). CLSM imaging showed that irradiation promoted the dispersion and spread of DOX molecules in the tumor tissue, which might be due to the ablation effect of PDT on tumors. Therefore, PDT could improve the effectiveness of chemotherapy. In conclusion, these micelles are efficient drug delivery systems for combinatorial cancer therapy.
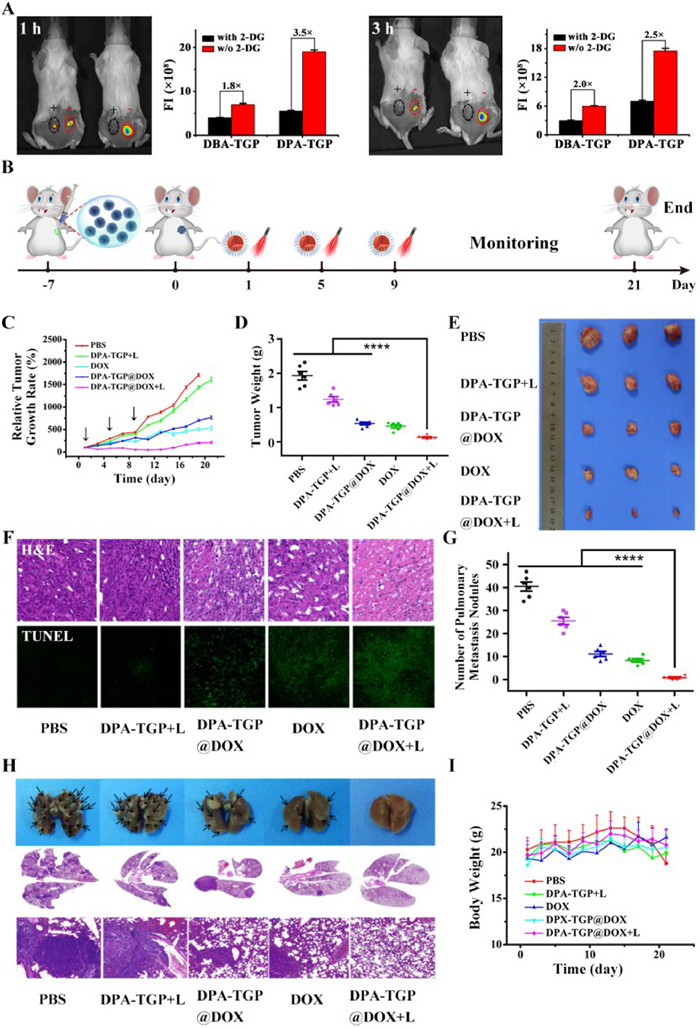
Fluorescence imaging of the acid-activatable micelles was next investigated in a 4T1 tumor-bearing BALB/c mouse model in vivo. Each BALB/c mouse was implanted with two tumors on their back. The tumors on the left side were injected with 2-deoxy-D-glucose (2-DG) 12 h before injection of the micelles to inhibit the production of glucose-6-phosphate from glucose to suppress the acidic tumor environment. As shown in Fig. 5A, the fluorescence intensity in the right tumors was greater than that in the left tumors. Specifically, 1 h after administration of the micelles, the fluorescence intensity of the DPA micelles in the normal tumor environment was 3.5 times brighter than that in the acid inhibited tumor environment, while the DBA micelles produced fluorescence that was 1.8 times brighter. After 3 h, the fluorescence intensity of the micelles in the tumor showed little difference from that at 1 h after administration. Moreover, the fluorescence intensity of DPA micelles in the right tumors were 2.5 times brighter than that in the left tumors, and that of the DBA micelles was 2-fold greater. The above results suggested that the micelles were also acid-activated in vivo, and they emitted fluorescence in a slightly acidic TME. Consequently, precise image-guided PDT could be achieved. Interestingly, at different time intervals after administration, the DPA-TGP micelles displayed approximately 3-fold brighter fluorescence than the DBA-TGP micelles because they could be activated at the tumor ECM as well as the early endosomes, while the DBA-TGP micelles could be triggered at only the lysosomes of the tumor cells. Furthermore, intracellular and extracellular PSs work via different mechanisms to induce tumor apoptosis, which maximizes PDT efficacy [51]. As DPA-TGP can be activated both intracellularly and extracellularly, DPA-TGP was chosen as a practical model for the following therapy experiments.
Figure 5
Figure 5.
FL imaging and drug effecacy of DPA/DBA-TGP nanoparticles in vivo. (A) FL imaging of acid-triggered fluorescence in vivo (left mouse: DBA-TGP, right mouse: DPA-TGP). (B) Photodynamic therapy and chemotherapy treatment schedule. (C) Tumor growth inhibition profiles after treatment with different formulations; the arrows indicate the time points of micelle administration and laser illumination. (D) Tumor weights from the mice receiving different treatments at the end of the antitumor study. Statistical significance: t-test, n = 6, ****P < 0.0001. (E) Photograph of the tumors after the mice were sacrificed. (F) H&E staining and TUNEL staining of tumors at the end of the antitumor study (40× magnification for all images). (G) Number of pulmonary metastatic nodules counted. Statistical significance: t-test, n = 6, ****P < 0.0001. (H) Photographs of the pulmonary metastatic nodules and H&E staining of lung sections (40× magnification). (I) Changes in mouse body weight during treatment.
Given the satisfying combinatorial PDT and chemotherapy in vitro, the antitumor efficacy of the micelles was next evaluated in vivo in a 4T1 tumor-bearing BALB/c mouse model. The tumor-bearing mice were randomly divided into 5 groups (phosphate buffer saline (PBS), DPA-TGP + laser, DOX, DPA-TGP@DOX and DPA-TGP@DOX + laser; n = 6) when the tumor volume reached 200 mm3. The mice were intratumorally injected with different formulations at identical TCPP and DOX doses of 14 mg/kg and 5 mg/kg for three times as shown in Fig. 5B, respectively. The therapeutic efficacy was evaluated by monitoring the tumor volume every 3 days. The DPA-TGP + laser group moderately inhibited tumor growth, indicating that PDT itself was not effective enough for tumor regression. DPA-TGP@DOX significantly inhibited tumor growth in comparison with the PBS group and DPA-TGP + laser group, producing inhibition similar to that of hydrophilic DOX. DPA-TGP@DOX + laser treatment completely eradicated the tumors due to the combinatorial effect of PDT combined with chemotherapy (Fig. 5C). Moreover, the tumors of the mice in the DPA-TGP@DOX + laser group were the smallest among all the groups, while the tumors treated with PBS were the largest. Additionally, the tumor weights in the DOX and DPA-TGP@DOX groups were similar (Figs. 5D and E). Hematoxylin and eosin (H&E) and terminal deoxynucleotidyl transferase uridine triphosphate nick end labeling (TUNEL) staining of the tumor sections displayed obvious necrosis and apoptosis of the tumor cells as nuclear shrinkage and vacuoles appeared in the combinatorial therapy group (Fig. 5F). Furthermore, the PDT group inhibited approximately 50% of lung metastases, while the chemotherapy group inhibited metastasis up to 80%. The combinatorial therapy group inhibited nearly 95% of lung metastases (Figs. 5G and H). Notably, combinatorial therapy caused a negligible change in body weight, indicating the good biosafety of these micelles (Fig. 5I). Furthermore, H&E staining of the normal tissues, including the heart, liver, spleen, lungs and kidneys, further demonstrated that the micellar nanoparticles produced negligible adverse effects on normal tissues (Fig. S13 in Supporting information).
In this study, we constructed four acid-activatable TCPP derivatives (pH-TCPPs) with tunable pKa values. Using these derivatives, acid/enzyme-responsive micelles with different pKa values and dual-modal image-guided combinatorial therapy were fabricated. Substituting the carboxylic groups of the TCPP molecules with amines groups reversed the pH-responsive property. The amine structure could precisely tune the pKa of each pH-TCPP, which could be activated at the ECM or in different acidic tumor organelles. Furthermore, pH-TCPPs and micelles with the same amine modification, and subsequently, the same pKa, shared similar acid-responsive fluorescence, photodynamic and MRI properties. These compounds showed good antitumor behavior toward metastatic TNBC in vitro and in vivo. Overall, the acid-responsive property of the pH-TCPPs and micelles reduced the dark toxicity of conventional photosensitizers due to its "always-on" photoactivity and had a better specificity toward a broad spectrum of tumors. These multifunctional micelles with tunable pKa values pave the way for precise PDT in different tumor cell organelles.
Declaration of competing interest
The authors declare that they have no known competing financial interests or personal relationships that could have appeared to influence the work reported in this paper.
Acknowledgments
This work was supported by the National Natural Science Foundation of China (Nos. 82102915, 22074043 and U22A20328), Lingang Laboratory (No. LG-QS-202206-04), China Postdoctoral Science Foundation (No. 2021M700157) and Shanghai Post-Doctoral Excellence Program (No. 2021424).
Supplementary materials
Supplementary material associated with this article can be found, in the online version, at doi:10.1016/j.cclet.2023.108332.
[1]
H.C. Bishop, M. Tefft, A.E. Evans, G.J. D'Angio, J. Pediatr. Surg. 12 (1977) 631–638. doi: 10.1016/0022-3468(77)90385-2
Scheme 1
(A) Chemical structures of the tertiary amine-modified TCPP derivatives. The PEG chain was further coupled with the TCPP derivatives via a GPLGLAG peptide spacer. (B) Self-assembly and acid-activatable FI/MRI profiles of Mn-DXA-TGP@DOX nanoparticles. (C) Schematic illustration of the Mn-DXA-TGP@DOX nanoparticles for fluorescence and magnetic resonance dual-modal image-guided combinatorial PDT/chemotherapy against cancer.
Figure 1
Acid-activated property of pH-TCPPs. (A) The molecular structures of the four pH-TCPPs. (B) pH-responsive fluorescence spectra of the acid-activated pH-TCPPs in BR buffer at a series of different pH values. (C) FL imaging of TCPP and different pH-TCPPs. (D) Acid-activated fluorescence property of pH-TCPPs. (E) Acid-activated ROS generation property of pH-TCPPs. (F) Mechanism of the acid-activated property of pH-TCPPs.
Figure 2
Physiochemical characterization of DPA/DBA-TGP. (A) Dissociation of the DPA-TGP and DBA-TGP micelles. (B) DLS and TEM images of the DPA-TGP micelles at pH 7.4 (scale bar: 200 nm). (C) DLS and TEM images of the DPA-TGP micelles at pH 6.0 (scale bar: 200 nm). (D) Acid-activated fluorescence property of the DPA/DBA-TGP micelles. (E) Fluorescence imaging of DPA/DBA-TGP micelles in BR buffer at different pH values. (F) Acid-activated ROS generation property of the DPA/DBA-TGP micelles. (G) Curves of Mn-DBA-TGP fluorescence at different pH values. (H) Acid-activated fluorescence property of the Mn-DBA-TGP micelles. (I) Fluorescence imaging of the Mn-DBA-TGP micelles at different pH values. (J) r1 values of Mn-DBA-TGP at pH 7.4 and pH 5.0. (K) r1 values of Mn-TGP at pH 7.4 and pH 5.0. (L) MRI of Mn-DBA-TGP at pH 7.4 and pH 5.0 at different Mn2+ concentrations.
Figure 3
Cellular uptake and colocalization of DPA/DBA-TGP nanopaticles in 4T1 cells. (A, B) CLSM images taken at different time intervals after the administration of (A) DPA-TGP and (B) DBA-TGP micelles to 4T1 cells (scale bar: 25 µm). (C) DPA-TGP and (D) DBA-TGP colocalized with BacMam-labeled early endosomes and BacMam-labeled lysosomes (scale bar: 25 µm). (Blue channel: λex = 405 nm, λem = 433–494 nm; green channel: λex = 488 nm, λem = 501–579 nm; red channel: λex = 552 nm, λem = 596–734 nm). (E) Schematic illustration of how Baf-A1 influences the behavior of DPA/DBA-TGP micelles after cellular uptake. (F) Colocalization plots of DPA-TGP micelles (yellow line in C). (G) Colocalization plots of DBA-TGP micelles (yellow line in D).
Figure 4
Acidic-responsive ROS generation of DPA/DBA-TGP nanoparticles in vitro. (A, B) Fluorescence images of 4T1 cells incubated with (A) DPA-TGP (B) DBA-TGP micelles and the ROS detector DCFH-DA. The fluorescence was quenched when Baf-A1 was added for preincubation with the cells (scale bar: 25 µm). (Blue channel: λex=405 nm, λem = 433–494 nm; green channel: λex = 488 nm, λem = 501–579 nm; and red channel: λex = 552 nm, λem = 596–734 nm). (C, D) Determination of the phototoxicity of (C) DPA-TGP and (D) DBA-TGP micelles by MTT assay. Statistical significance: t-test, n = 6, ***P < 0.001, **P < 0.01. (E) MTT assay of DPA-TGP@DOX micelles in combinatorial therapy. (F) CLSM examination of laser-triggered ROS generation in vivo (scale bar: 55 µm). (Blue channel: λex = 405 nm, λem = 433–494 nm; green channel: λex = 488 nm, λem = 501–579 nm; and red channel: λex = 552 nm, λem = 560–600 nm).
Figure 5
FL imaging and drug effecacy of DPA/DBA-TGP nanoparticles in vivo. (A) FL imaging of acid-triggered fluorescence in vivo (left mouse: DBA-TGP, right mouse: DPA-TGP). (B) Photodynamic therapy and chemotherapy treatment schedule. (C) Tumor growth inhibition profiles after treatment with different formulations; the arrows indicate the time points of micelle administration and laser illumination. (D) Tumor weights from the mice receiving different treatments at the end of the antitumor study. Statistical significance: t-test, n = 6, ****P < 0.0001. (E) Photograph of the tumors after the mice were sacrificed. (F) H&E staining and TUNEL staining of tumors at the end of the antitumor study (40× magnification for all images). (G) Number of pulmonary metastatic nodules counted. Statistical significance: t-test, n = 6, ****P < 0.0001. (H) Photographs of the pulmonary metastatic nodules and H&E staining of lung sections (40× magnification). (I) Changes in mouse body weight during treatment.

 DownLoad:

 下载:
下载:


