Figure 1.
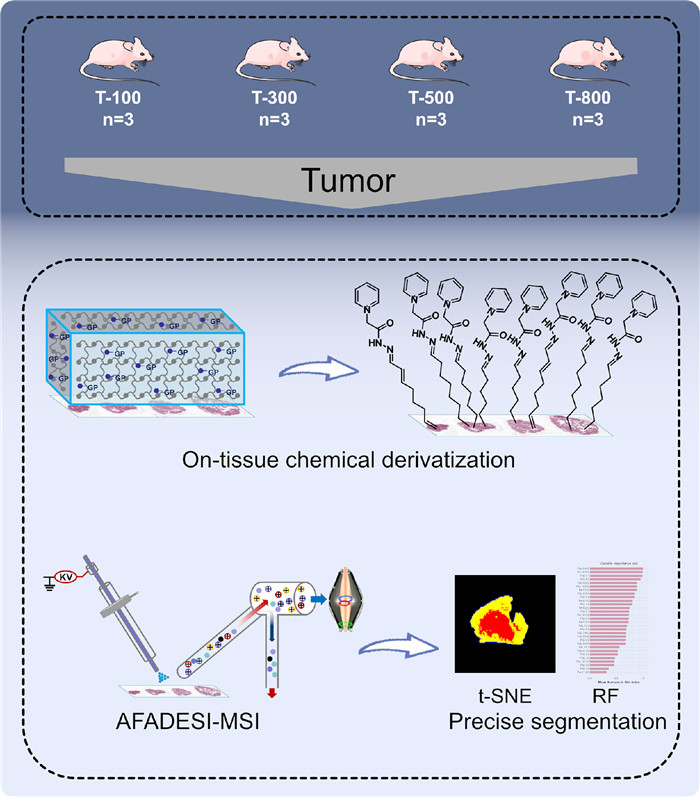
Overview of this study consisting of sample collection, OTCD, MSI and machine learning.
On-tissue chemical derivatization enables spatiotemporal heterogeneity visualization of oxylipins in esophageal cancer xenograft via ambient mass spectrometry imaging
Jialin Liu , Qingce Zang , Xinzhu Li , Xinyi Tu , Ying Zhu , Lingzhi Wang , Zitong Zhao , Yongmei Song , Ruiping Zhang , Zeper Abliz

Mass spectrometry imaging (MSI) can detect and locate thousands of molecules in biological tissue with high-sensitivity and high-coverage [1]. However, spatial mapping a wealth of low-abundance functional molecules with MSI remains challenging due to the poor ionization efficiency, matrix effect, and background interferences. On-tissue chemical derivatization (OTCD) has been demonstrated as an effective way to improve detection sensitivity of MSI by in situ chemical reactions on tissue surface [2,3]. Through selecting different derivatization reagents, isomer of complex molecular [4,5] and several types of previously inaccessible molecules, such as cholesterol [6], steroid hormones [7], neurotransmitters [8], bile acids [9] and fatty aldehydes (FALs) [10], have been successfully detected and imaged with MSI in tissue.
Recently, MSI has been increasingly applied to investigate tumor metabolic heterogeneity. For example, matrix-assisted laser desorption ionization (MALDI)-MSI was utilized to discover the core region (CR) and the edge region of the glioblastoma from patient-derived xenograft models undergo different fatty acid metabolism [11], and analyze metabolic gradients in multicellular tumor spheroids (MCTS) [12,13]. Desorption electrospray ionization (DESI)-MSI was applied to visualize the acidic tumor microenvironment [14]. Additionally, a series of studies are devoted to effectively extracting chemical and spatial information from complex MSI data to precisely reveal metabolic heterogeneity in tumor by combining MSI and machine learning methods. Both random forest (RF) and cluster large applications could efficiently classify the MS images into different regions in MCTS [15]. T-distributed stochastic neighbor embedding (t-SNE) [16], uniform manifold approximation and projection [17] and artificial neural networks [18,19] have also been gradually employed to accurately visualize MSI data.
Oxylipins are important signal molecules produced by oxidative stress in tumor progression [20]. Owing to the low abundance and difficult-to-ionize characters, they are difficult to be directly analyzed by MSI. To enhance the detection coverage of MSI for oxylipins, Harkin et al. [21] applied Girard's reagent T and MSI to conduct the localization and semiquantitative analysis of 4-hydroxynonenal (4-HNE), 4-hydroxyhexenal and 4-oxo-2-nonenal in kidney tissues from diabetic mice and illustrated their utility as potential biomarkers for disease diagnosis and progression. We recently developed a hydrogel-assisted chemical derivatization method targeting carbonyl metabolites to spatially map FALs and oxo fatty acids (FAs) in rat brain, kidney and liver tissues by airflow-assisted desorption electrospray ionization (AFADESI)-MSI [10]. However, the metabolic heterogeneity of oxylipins in tumor remains unclear. Except that the low abundance and difficult-to-ionize characters, the highly complex tumor microenvironment, as well as the challenge of direct precise segment of microregions have limited to visualize the metabolic heterogeneity of these molecules in tumor tissue.
Herein, we concentrated on-tissue chemical derivatization (OTCD) to enhance the detectability of AFADESI-MSI targeting oxylipins in tumor tissue. t-SNE and RF were then effectively integrated to precisely define the boundary of tumor with heterogeneous oxylipin profiles and further to explore spatiotemporal heterogeneity of oxylipins during tumor progression. The research workflow is shown in Fig. 1.
Twelve male BALB/c nude mice, aged 4 weeks, were obtained from Vital River Laboratory Animal Technology Co., Ltd. All manipulations were handled in accordance with the requirements of the Animal Care and Welfare Committee, Institute of Materia Medica, Chinese Academy of Medical Sciences and Peking Union Medical College. The human esophageal squamous cell carcinoma cell line KYSE-150 was acquired from the Cancer Institute and Cancer Hospital, Chinese Academy of Medical Sciences and Peking Union Medical College. The KYSE-150 xenograft tumor mice model was established with subcutaneous injection of 1 × 10⁶ cells. To mimic tumor progression, mice were randomly divided equally into four groups (n = 3): T-100, T-300, T-500 and T-800 groups, and sacrificed on days 8, 12, 17 and 18 until their tumor volumes reached 100 mm3, 300 mm3, 500 mm3 and 800 mm3, respectively. Tumors were immediately collected and flash-frozen using liquid nitrogen, and then stored at −80 ℃.
After obtaining tumor slices, OTCD was carried out using a hydrogel-assisted method, and the detailed process was described in our previous study [10]. In brief, gelatin was thoroughly dissolved in distilled water at 60 ℃ to prepare a 15% (w/v, g/100 mL) hydrogel solution. Girard's P (GP) reagent and formic acid were then added to form a hydrogel solution containing GP reagent at a concentration of 50 mg/mL with 1% formic acid (v/v). This solution was transferred into a mold to shape at 4 ℃ for 4 h. The solid derivatization hydrogel was cut into small blocks to cover and derivatize tumor slices for 2 h at room temperature. Details of experimental methods and data processing methods were presented in Supporting information.
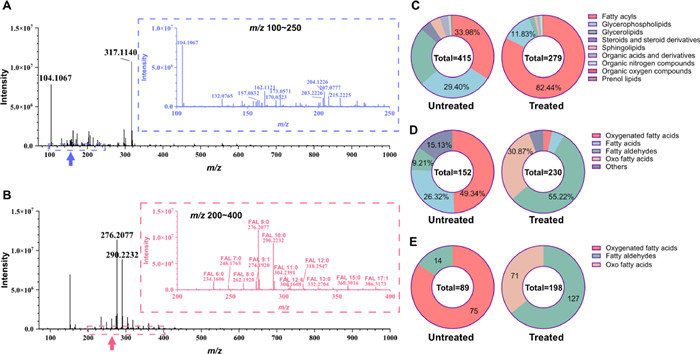
The OTCD conditions, including hydrogel, derivatization reagent concentration, the concentration of acid as a catalyst, derivatization temperature and time were systematically optimized [10]. To evaluate the detectability of AFADESI-MSI targeting oxylipins, AFADESI-MSI was performed on both underivatized and derivatized tumor sections. As shown in Figs. 2A and B, the representative mass spectra displayed that the intensities of oxylipins at the range of m/z 200–400 were obviously enhanced after derivatization compared with the underivatized samples ranging from m/z 100 to m/z 250 of which oxylipins were difficult to detect. Meanwhile, some polar metabolites disappeared after the derivatization treatment, because hydrogels removed most polar metabolites, quaternary ammonium and inorganic salts to reduce ion suppression and improve ion intensity [10,22,23]. The number of detected lipids and oxylipins were further counted. Compared with underivatized method, although the number of detected lipids in derivatized tumor sections was lower, the percentage and number of fatty acyls were obviously higher (Figs. 2C and D). In underivatized tumor sections, these fatty acyls consisted of 75 oxygenated FAs, 40 FAs, 14 FALs and 23 others (Figs. 2D and E). We were unable to distinguish carbonyl FAs and hydroxyl FAs among 75 oxygenated FAs because they are isomers. After derivatization, 71 oxo FAs and 127 FALs, accounting for approximately 86% of fatty acyls, were detected (Figs. 2D and E, Table S1 in Supporting information), which indicated that derivatization successfully increased the detectable number of oxylipins in tumor. In addition, chemical derivatization with GP reagent as a derivatization reagent targeting carbonyl metabolites assisted in identifying carbonyl FAs. These results suggest that the OTCD is able to enhance the detectability of AFADESI-MSI targeting oxylipins in tumor.
Since H & E staining did not exhibit heterogeneous partitions in these tumors (Fig. 3A), a representative metabolite needed to be screened to directly represent the boundary between different microregions in AFADESI-MS images. t-SNE was initially exploited to realize spatial mapping of metabolites. K-means clustering of the t-SNE data was then used to separate the whole tumor into distinct regions relying on the distribution and intensity of metabolites. The optimum number of clusters was 3 or 2, hinging on whether the tumor was with cavities or not, thereby the pixels formed intimate and scattered sets of clusters to attribute to corresponding metabolic features (Fig. 3B). According to t-SNE plots, we unexpectedly noted a regular distribution of oxylipins with higher intensity in the CR than in the peripheral region (PR) of tumor.

Further, a RF model, an ensemble learning method based on decision tree [24], was applied to rank oxylipins according to their contribution to group separation. We randomly re-sampled samples with a proportion of 75% as the training sets and the remaining samples as validation sets and adopted 500 trees. As shown in Figs. S1A and B (Supporting information), the area under the curve (AUC) of receiver operating characteristic (ROC) curves in training sets and validation sets were both equal to 1, demonstrating that detected oxylipins were able to faultlessly separate the tumor into the CR and the PR. The top 30 important variables mainly composed of FALs were presented in Fig. 3C and showcased similar distribution tendency (Fig. 3D). Meanwhile, their fold changes are greater than 1.5 and P < 0.05 (Table S2 in Supporting information). FAL 8:4;O (m/z 270.1246) was selected as a metabolite characterizing different regions in tumor. To clearly visualize the boundary between the CR and the PR in AFADESI-MS images using FAL 8:4;O, suitable ion intensity thresholds needed to be set via overlaying t-SNE plots to AFADESI-MS images. Thus, combining t-SNE and RF effectively achieved accurate segmentation of the metabolic heterogeneous tumor in AFADESI-MS images.
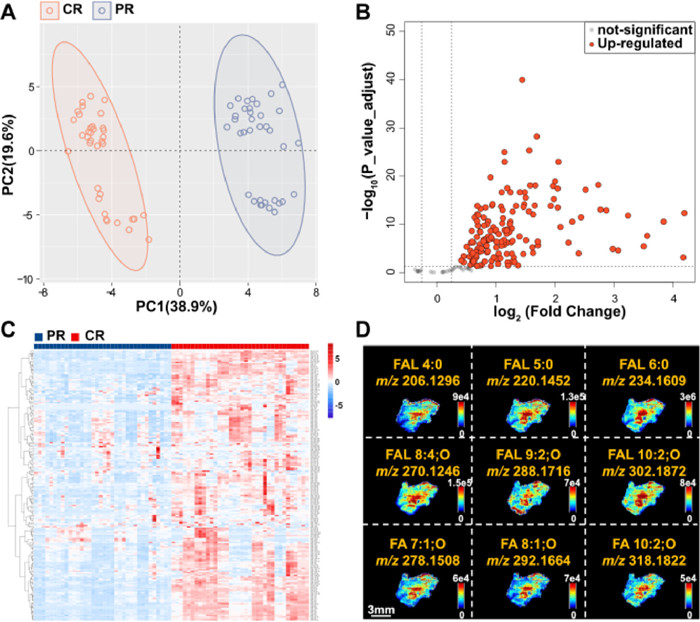
When yielding the t-SNE plots by the distribution and intensity of metabolites, clear regional differences became apparent. To screen the metabolic differences of detected oxylipins between the CR and the PR, a principal component analysis (PCA) model was established. As shown in Fig. 4A, the data of oxylipins between the CR and the PR were clearly scattered, explaining 58.5% of the total variance in the first two principal components. A comparison of oxylipins in the CR and the PR captured 162 oxylipins enriched in the CR and no down-regulated oxylipin on the basis of |log2 fold change| > 0.25 and false discovery rate (FDR) P < 0.05 (Fig. 4B). A heatmap of all oxylipins was constructed to distinctly display their intratumoral heterogeneous expression and to highlight the majority of detected oxylipins owning higher intensities in the CR (Fig. 4C).
Cancer is commonly associated with oxidative stress which refers to an imbalance state between the oxidative and anti-oxidative systems of the cells and tissues [25,26]. Oxidative stress is incurred by a variety of environmental factors represented by hypoxia and is able to expedite lipid peroxidation of polyunsaturated fatty acids (PUFAs), resulting in the overproduction of FALs, such as the representative 4-HNE (FAL 9:1;O) and malondialdehyde (MDA) (FAL 3:1;O) [27,28]. 4-HNE and MDA have been recognized as indicators of oxidative stress. In addition, hypoxia is also an essential hallmark of solid cancers and forms intratumoral oxygen gradients, conducing to the plasticity and heterogeneity of tumors [29]. In our study, oxylipins, especially short- and medium-chain FALs (C3-C10) generally considered as lipid peroxidation intermediates, provided more contributions to separate the CR and the PR (Fig. 3C) and showed the high distribution of oxylipins (Fig. 4D) in the core of tumors, which is probably related to hypoxia-induced oxidative stress. Thus, these oxylipins may serve as potential biomarkers of oxidative stress. More interestingly, Antonowicz et al. [30] reported that loss of aldehyde detoxification resulted in short-chain and medium-chain alkanals accumulation in esophageal adenocarcinoma, and scavenging aldehydes could be a potential treatment method to modulate aldehyde genotoxicity. Our results provide further evidence that scavenging aldehydes may be a therapeutic target for esophageal cancer.
To investigate the temporal trends of detected oxylipins during tumor progression, we compared oxylipin profiles of the initial and the final tumors. As shown in Fig. S2A (Supporting information), T-100 and the T-800 were separated in the PCA score plot, suggesting that oxylipins were differential between these two groups. The volcano plot displayed 11 remarkably increased oxylipins, consisting of 8 FALs and 3 oxo FAs, impacted by tumor growth (|log2 fold change| > 0.25, P < 0.05) (Fig. S2B in Supporting information). Meanwhile, these oxylipins showed increasing trends over time (Figs. S2C and S3 in Supporting information). Increased concentration of FALs with tumor progression has also been found in other cancers. For example, the increase in production of 4-HNE has been confirmed to associate with the progression of colon cancer [31]. The AFADESI-MS image of FAL 9:1;O not merely exhibited higher intensity in the CR, but also showed a tendency to increase during tumor growth (Fig. S4A in Supporting information).
To obtain the regularity of the spatial distribution heterogeneity for oxylipins over time, the above method containing t-SNE and RF was applied to define the boundary for precisely segmenting the CR and the PR. The percentage of the core area to the total tumor area was calculated. Interestingly, the ratio increased progressively over time and had significant differences either between the T-100 and the T-500 or between the T-100 and the T-800 (Fig. S4B in Supporting information), indicating that the impact of oxylipins on tumor was extended along with tumor progression. In view of the rapid proliferation of tumor cells, the influence of hypoxia on tumor gradually expanded and was possibly reflected in the increased ratio from the core area to the total tumor area over time.
In conclusion, a high-sensitive and high-coverage MSI analysis of oxylipins was achieved in tumor tissue with assistance of OTCD. A total of 71 oxo FAs and 127 FALs were successfully detected and clearly imaged with AFADESI-MSI after GP derivatization. The distribution of these oxylipins was precisely segmented in heterogeneous tumor by combining t-SNE and RF. The results clearly demonstrated that an elaborate temporal and spatial dimension analysis to uncover the heterogenous metabolic characteristics of oxylipins, and thus provided novel potential biomarkers for the progression of esophageal cancer.
The authors declare that they have no known competing financial interests or personal relationships that could have appeared to influence the work reported in this paper.
This research was supported by the National Natural Science Foundation of China (No. 21927808), the Chinese Academy of Medical Science (CAMS) Innovation Fund for Medical Sciences (CIFMS, Nos. 2022-I2M-2-002 and 2021-1-I2M-028).
Supplementary material associated with this article can be found, in the online version, at doi:
J. He, C. Sun, T. Li, et al., Adv. Sci. 5 (2018) 1800250. doi: 10.1002/advs.201800250
C. Harkin, K.W. Smith, F.L. Cruickshank, et al., Mass Spectrom. Rev. 41 (2022) 662–694. doi: 10.1002/mas.21680
Q. Zhou, A. Fülöp, C. Hopf, Anal. Bioanal. Chem. 413 (2021) 2599–2617. doi: 10.1007/s00216-020-03023-7
Y. Chen, C. Xie, X. Wang, et al., Anal. Chem. 94 (2022) 15367–15376. doi: 10.1021/acs.analchem.2c03089
C. Sun, C. Ma, L. Li, et al., Chin. Chem. Lett. 33 (2022) 2073–2076. doi: 10.1016/j.cclet.2021.08.034
R. Angelini, E. Yutuc, M.F. Wyatt, et al., Anal. Chem. 93 (2021) 4932–4943. doi: 10.1021/acs.analchem.0c05399
D.F. Cobice, D.E. Livingstone, C.L. Mackay, et al., Anal. Chem. 88 (2016) 10362–10367. doi: 10.1021/acs.analchem.6b02242
R. Shariatgorji, A. Nilsson, E. Fridjonsdottir, et al., Nat. Protoc. 16 (2021) 3298–3321. doi: 10.1038/s41596-021-00538-w
C. Sun, W. Liu, Y. Geng, X. Wang, Anal. Chem. 92 (2020) 12126–12131. doi: 10.1021/acs.analchem.0c02303
Q. Zang, M. Wang, Y. Zhu, et al., Anal. Chem. 93 (2021) 15373–15380. doi: 10.1021/acs.analchem.1c03118
E.C. Randall, B.G.C. Lopez, S. Peng, et al., Cancer Res. 80 (2020) 1258–1267. doi: 10.1158/0008-5472.can-19-0638
Q. Zang, C. Sun, X. Chu, et al., Anal. Chim. Acta. 1155 (2021) 338342. doi: 10.1016/j.aca.2021.338342
P. Xie, X. Liang, Y. Song, Z. Cai, Anal. Chem. 92 (2020) 11341–11348. doi: 10.1021/acs.analchem.0c02025
X. Song, Q. Zang, R.N. Zare, Anal. Chem. 93 (2021) 10411–10417. doi: 10.1021/acs.analchem.1c02026
X. Tian, G. Zhang, Z. Zou, Z. Yang, Anal. Chem. 91 (2019) 5802–5809. doi: 10.1021/acs.analchem.9b00026
J.M. Fonville, C.L. Carter, L. Pizarro, et al., Anal. Chem. 85 (2013) 1415–1423. doi: 10.1021/ac302330a
T. Smets, N. Verbeeck, M. Claesen, et al., Anal. Chem. 91 (2019) 5706–5714. doi: 10.1021/acs.analchem.8b05827
W. Gardner, R. Maliki, S.M. Cutts, et al., Anal. Chem. 92 (2020) 10450–10459. doi: 10.1021/acs.analchem.0c00986
W.M. Abdelmoula, B.G. Lopez, E.C. Randall, et al., Nat. Commun. 12 (2021) 5544. doi: 10.1038/s41467-021-25744-8
S. Chikara, L.D. Nagaprashantha, J. Singhal, et al., Cancer Lett. 413 (2018) 122–134. doi: 10.1016/j.canlet.2017.11.002
C. Harkin, K.W. Smith, C.L. MacKay, et al., Anal. Bioanal. Chem. 414 (2022) 6657–6670. doi: 10.1007/s00216-022-04229-7
X. Song, Z. Luo, X. Li, et al., Anal. Chem. 89 (2017) 6318–6323. doi: 10.1021/acs.analchem.7b00091
V. Gradinaru, J. Treweek, K. Overton, K. Deisseroth, Annu. Rev. Biophys. 47 (2018) 355–376. doi: 10.1146/annurev-biophys-070317-032905
E. Kawakami, J. Tabata, N. Yanaihara, et al., Clin. Cancer Res. 25 (2019) 3006–3015. doi: 10.1158/1078-0432.ccr-18-3378
V. Rani, G. Deep, R.K. Singh, K. Palle, U.C. Yadav, Life Sci. 148 (2016) 183–193. doi: 10.1016/j.lfs.2016.02.002
A. Das, H. Ganesan, S. Sriramulu, et al., Mol. Cell. Biochem. 476 (2021) 4117–4131. doi: 10.1007/s11010-021-04228-9
O. Blokhina, E. Virolainen, K.V. Fagerstedt, Ann. Bot. 91 (2003) 179–194. doi: 10.1093/aob/mcf118
Y. Li, T. Zhao, J. Li, et al., J. Immunol. Res. 2022 (2022) 2233906.
S. Terry, A.S.T. Engelsen, S. Buart, et al., Cancer Lett. 492 (2020) 1–10. doi: 10.1016/j.canlet.2020.07.004
S. Antonowicz, Z. Bodai, T. Wiggins, et al., Nat. Commun. 12 (2021) 1454. doi: 10.1038/s41467-021-21800-5
L. Lei, J. Zhang, E.A. Decker, G. Zhang, Front. Cell Dev. Biol. 9 (2021) 665591. doi: 10.3389/fcell.2021.665591

Figure 1 Overview of this study consisting of sample collection, OTCD, MSI and machine learning.

Figure 2 Assessment on the detectability of AFADESI-MSI for oxylipins. The representative mass spectra for (A) underivatized and (B) derivatized methods on two consecutive tumor sections. (C) The classification of annotated lipids in the underivatized and derivatized tumor sections. (D) The classification of annotated fatty acyls in the underivatized and derivatized tumor sections. (E) Comparing the number of oxylipins detected from underivatized and derivatized tumor sections.

Figure 3 Accurate segmentation the heterogeneous tumor according to oxylipin profiles. (A) H & E staining and (B) t-SNE plots. (C) Variable importance plot of top 30 oxylipins ranked by contribution to mean decrease in Gini index in the RF model for separating groups. (D) AFADESI-MS images of representative oxylipins to characterize the boundary between the CR and the PR in tumors.

Figure 4 Heterogeneous spatial distribution of oxylipins in the tumor from xenograft models of esophageal cancer. (A) PCA score plot focused on oxylipins to compare the CR and the PR (n = 36). (B) Volcano plot of changed oxylipins. (C) Heatmap displaying metabolites related to all detected oxylipins. (D) AFADESI-MS images of representative oxylipins in the tumor.

 扫一扫看文章

扫一扫关注我们
 DownLoad:
 下载:
下载: