Citation:
Haoyu Li, Wei Pei, Xiaowei Yang, Si Zhou, Jijun Zhao. Pt overlayer for direct oxidation of CH4 to CH3OH[J]. Chinese Chemical Letters,
2023, 34(11): 108292.
doi:
10.1016/j.cclet.2023.108292
Key Laboratory of Materials Modification by Laser, Ion and Electron Beams (Dalian University of Technology), Ministry of Education, Dalian 116024, China
b.
College of Physics Science and Technology, Yangzhou University, Yangzhou 225009, China
Received Date:
06 August 2022 Accepted Date:
02 March 2023 Revised Date:
04 February 2023 Available Online:
15 November 2023
Abstract:
Highly selective conversion of methane (CH4) to methanol (CH3OH) is an emerging attractive but challenging process for future development of hydrogen economy, which requires efficient catalysts. Herein, we systematically explore the catalytic properties of Pt(111) overlayer on transition metal oxides (TMOs) for CH4 conversion by first principles calculations. The Pt(111) monolayer supported by Ce-terminated CeO2(111) substrate exhibits high activity and selectivity for CH4 conversion to CH3OH, with the kinetic barrier of rate-limiting step of 1.05 eV. Intriguingly, the surface activity of Pt overlayer is governed by its d-band center relative to the energy of bonding states of adsorbed molecules, which in turn depends on the number of charge transfer between Pt(111) monolayer and underlying TMOs substrates. These results provide useful insights in the design of metal overlayers as catalysts with high-ultra performance and atomic utilization.
Natural gas has been widely used as a clean energy source in industrial manufactures and daily routine [1,2]. Methane (CH4) is the main ingredient of natural gas and has harmful effects on the environment due to its strong greenhouse effect [3–5]. Therefore, there is an urgent need for conversion of CH4 to high-value products or liquid fuels, which is crucial for storage and transportation of CH4. At present, the catalytic CH4 conversion is mainly based on thermocatalysis [6,7], photocatalysis [8,9], electrocatalysis and enzymecatalysis [10–15]. Among them, the thermocatalysis approach has been widely used in industry because of its relatively low cost and high efficiency [6,7]. The dissociation of CH4 molecule is a key step for CH4 conversion, and one of the most suitable catalysts are group-VIIIB transition metals, especially Pt-based nanoparticles, nanoshells, and single atoms [16,17].
The previous studies have reported that platinum has decent catalytic performances for CH4 conversion to produce hydrogen [18,19]. Rategarpanah et al. demonstrated that the addition of a small amount of Pt to the Ni-Cu nanoalloys supported on MgO·Al2O3 powders can considerably promote the CH4 activation, in which the CH4 conversion rate increases from 70% to 80%, and the H2 formation rate increases from ~1.35 mol g−1 min−1 to ~1.55 mol g−1 min−1 [19]. Moreover, Hosseini et al. [20] reported that the Fe2O3@CeO2 core-shell structure loaded with Pt nanoparticles achieves about 80% conversion rate in the dry reforming of methane (DRM), leading to the production of COx-free (< 2 ppm) H2 in the oxidation step by steam with a cyclically stable yield (10.8 mmol/g catalyst-oxygen carrier). Comparing with nanoparticles, dispersed Pt single atom or few atoms exhibits outstanding capabilities for CH4 conversion [21–26]. For instance, Yan et al. [22] reported that Pt single atoms supported on Mn2O3 owns excellent catalytic activity for CH4 oxidation with 90% conversion rate at 603 ℃. Gao et al. [26] showed that Pt single atoms supported on La2O3 precursor with carbon species (Pt1/LP) have improved activity for CH4 conversion with regard to Pt nanoparticles. When Pt1/LP was supported on CeO2 surface obtained by using precipitation method, the CH4 conversion rate can be further enhanced to 82%.
It is known that single-atom catalysis faces the problem of low density of active sites (< 1 wt%) on the substrate, which limits the catalysis of complicated or multi-electron reactions [27]. Atomically thin layers of transition metals combine the advantages of nanoparticle and single-atom catalysts, providing a large number of active sites as well as maximizing the atomic utilization [28]. Furthermore, the synergistic effect between metal overlayers and the underlying substrates can boost the surficial activities [29–32]. So far, Pt overlayers supported on various transition metal oxides (TiO2, ZrO2, CeO2 and so on) have been synthesized in laboratory [33–41]. Yang et al. predicted that Pt monolayer on V2C MXene exhibits high activity for oxygen reduction reaction owing to the strong metal-support interaction [30]. Later, Li et al. successfully synthesized Pt nanolayers with a single or double atomic layer thickness on Mo2TiC2Tx MXene, which can catalyze non-oxidative coupling of CH4 to ethane/ethylene [42]. These results shed light in the extraordinary catalytic properties of atomically thin Pt overlayers. However, the principles for tuning the activity of Pt overlayers and the role of different substrates await being understood.
Herein we explore the catalytic behavior of Pt monolayer on transition metal oxides TiO2, ZrO2 and CeO2 for CH4 conversion by first principles calculations. Among them, Pt monolayer supported on metal-terminated CeO2 enables direct conversion of CH4 to methanol (CH3OH) and suppresses coke formation. The surficial activities of Pt monolayer sensitively depend on the type of substrate, which regulates the d-band center of Pt monolayer. The kinetic barrier of reaction is linearly correlated with the energy difference between d-band center of Pt monolayer and bonding states of adsorbed molecules, which serves as a key descriptor for precise design of novel catalysts for liquid fuel storage.
Density functional theory (DFT) calculations were performed by using the Vienna ab initio simulation package (VASP) [43], with the projector augmented wave potentials [44], and the generalized gradient approximation parameterized by Perdew, Burke and Ernzerhof (GGA-PBE) for the exchange and correlation functional [45]. The plane wave basis set with an energy cutoff 500 eV was used. The Brillouin zone was sampled by a 3 × 3 × 1 Monkhorst-Pack k-point mesh. All structures were optimized using a convergence criterion of 10−4 eV and 0.02 eV/Å for total energy and force thresholds, respectively. The DFT-D3 dispersion correction scheme of Grimme was adopted to describe the van der Waals interactions in these layered systems [46]. Kinetic barriers and transition states for CH4 conversion were simulated using the climbing-image nudged elastic band (CI-NEB) method implemented in VASP [47]. An effective Hubbard parameter Ueff = U − J = 5 eV was used for Ce atoms to consider the strong on-site Coulombic interaction of the Ce 4f orbital [48]. The number of charge transfer between Pt monolayer and underlying substrates was evaluated using the Bader charge analysis [49]. The electronic structures were calculated by DS-PAW program [50].
For the growth of Pt nanofilms in the experiment, transition metal oxides have been widely utilized as substrates [34–42]. Here we considered Pt monolayer on the O-terminated rutile TiO2(110) and metal-terminated cubic ZrO2(100) surfaces, which have been synthesized in laboratory [35–40]. For the model of Pt on TiO2 (hereafter noted as Pt/TiO2), the supercell consists of 4 × 2 unit cells of rutile TiO2(110), with lattice vectors of u = 5a1 − a2 and v = 2a1 − 5a2 for Pt(111) monolayer. For Pt/ZrO2, we adopted the supercell comprising Pt(111) monolayer (u = 2a1 + a2 and v = a2) on 3 × 4 unit cells of cubic ZrO2(110). We also considered cubic CeO2 as a possible substrate, which has been widely used to support nanofilms, nanoparticles and single atoms for catalysis [51,52]. According to the previous experimental characterization, the surface of CeO2 sensitively depends on the growth condition [53,54]. In the oxidative atmosphere, CeO2 tends to form the O-terminated surface, while Ce-termination or a mixture of O- and Ce-termination may occur for CeO2 prepared in the reductive atmosphere [54,55]. Moreover, the CeO2(111) surface is non-polar perpendicular to the surface, exhibiting outstanding stability and well-defined geometrical structures compared with the other low-index surfaces [55,56]. Therefore, we constructed Pt(111) monolayer on the O-terminated and Ce-terminated CeO2(111) to explore the substrate effect. The supercell of Pt/CeO2 includes 3 × 3 unit cells of Pt(111) monolayer and 4 × 4 unit cells of CeO2(111) substrate. The lattice of Pt overlayer is stretched or compressed to match that of the substrate, resulting in lattice mismatch of 0.54%−3.21%. To elucidate the strain effect on the electronic structure and catalytic property of Pt overlayer, we perform test calculations on Pt(111) monolayer by applying a biaxial stretch strain ranging from 0% to 3.5%. The d-band center is lifted by 0.24 eV toward Fermi level and the adsorption energy of CH3* species is weakened by 0.08 eV. Therefore, the strain on Pt overlayer induced by substrates may have a minor effect on the catalytic properties.
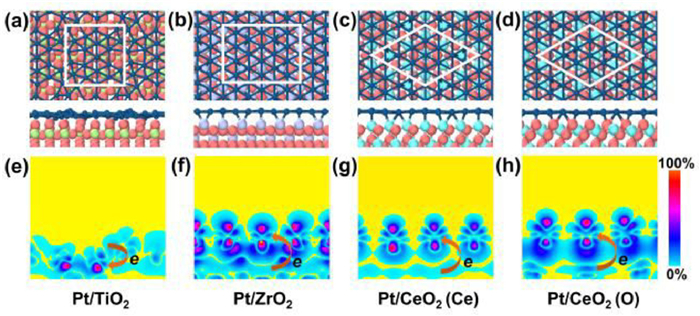
The structures of Pt overlayer on cubic ZrO2(100), cubic CeO2(111) and rutile TiO2(110) are shown in Fig. 1. The detailed structure parameters are presented in Table 1. The interlayer distance ranges from 1.73 Å to 2.35 Å, which shows the typical covalent interaction between Pt(111) monolayer and underlying TMOs substrates. These interfacial covalent interactions can also be characterized by the differential charge densities, showing the electron accumulation at the interfacial region (Figs. 1e-h). It is worth noting that Pt monolayer grown on TiO2 exhibits a relatively large deformation with a vertical buckling of 1.51 Å for the Pt monolayer. On the other three substrates, Pt monolayer undergoes slight deformation with small vertical buckling of 0.27~0.42 Å. The optimized Pt-Pt bond lengths of Pt/TiO2, Pt/ZrO2, Pt/CeO2 (Ce) and Pt/CeO2 (O) are in the range of 2.47–2.78, 2.64–2.78, 2.78–2.98 and 2.71–2.90 Å, respectively, comparable with that of Pt(111) surface (2.78 Å).
Figure 1
Figure 1.
Geometrical structures of Pt/TMOs hybrid systems. Atomic structures of Pt/TMOs (a-d) and corresponding differential charge density distributions (e-h). White lines labeled the lattice. The Pt, O, Ti, Zr, and Ce atoms are shown by dark blue, pink, green, purple and blue balls, respectively.
Table 1.
The key parameters of Pt/TMOs hybrid systems including lattice mismatch (δ), interlayer distance (d), vertical buckling of Pt monolayer (ΔdPt), Pt-Pt bond length (hPt-Pt), formation energy per Pt atom in Pt monolayer (Eform), charge transfer between Pt monolayer and the substrate (CT), the d-band center of Pt monolayer (εd).
To characterize the thermostabilities of Pt/TMOs hybrid systems, we calculated their formation energy per Pt atom (Eform), as follows (Eq. 1):
(1)
where Etotal, EPtML, and Esub denote the total energy of the Pt/TMOs system, Pt monolayer and TMOs substrate, respectively; NPt is the number of Pt atoms. As a result, the formation energy of these Pt/TMOs hydride systems range from −0.66 eV/atom to −2.76 eV/atom, signifying the strong bonding interaction between Pt monolayer and underlying TMOs substrates. It is worth noting that the Eform of Pt/CeO2(Ce) is −2.04 eV, which was competitive to or much lower than that of experiment-prepared Pt/TiO2 (Eform = −1.24 eV) and Pt/ZrO2 (Eform = −2.76 eV). According the Bader charge analysis [49], charge transfer is from Pt monolayer to TiO2 substrate (0.17 e per Pt atom), whereas Pt monolayer gain electrons from the other substrates (0.02–0.34 e per Pt atom) (Table 1). Figs. 1e-h depicts the two-dimensional charge distribution between Pt monolayer and substrates. The interfacial charge transfer is correlated to the electronegativity of atoms. The electronegativities of Ti, Zr, Ce, O and Pt are 1.54, 1.33, 1.12, 3.34 and 2.28, respectively. For Pt/ZrO2 and Pt/CeO2 (Ce) systems, due to the high electronegativity of Pt compared with Zr and Ce, Pt atoms of Pt/ZrO2 and Pt/CeO2 (Ce) gains some electrons (0.34 and 0.33 e per Pt atom) from the underlying Zr and Ce, respectively. For Pt/TiO2, the electronegativity of O exceeds electronegativity of Pt, and hence each Pt atom loses electrons of 0.17 e. In the Pt/CeO2 (O) system, due to the electronegativity of Ce is less than electronegativity of Ti, Ce atoms affords more electrons to O atoms, which leads to the charge transfer from O to Pt atoms.
A lot of experimental and theoretical studies have indicated that the Pt-based nanomaterials can achieve a decent chemical activity for CH4 activation and unique selectivity for yielding CH3OH product [57,58]. We investigate the catalytic process of CH4 activation and conversion with H2O on the Pt/TMOs hybrid systems as well as the bulk-phase Pt(111) surface for reference. According to the previous studies [59], the pathway of CH4 reaction with H2O to yield CH3OH mainly includes three relevant processes (Eqs. 2 and 3):
(2)
(3)
(4)
where * represents an adsorption site on the catalyst surface. Alternatively, the CH3* intermediate can be further dehydrogenated via Eq. 5:
(5)
which provides the opportunity to form olefin.
Fig. 2 shows the reaction energy (ΔH) for each reaction step, where positive (negative) numbers represent endothermic (exothermic) reaction. For Eq. 2, Pt/TiO2, Pt/CeO2 (Ce) and Pt/CeO2 (O) have reaction energies of −1.26 eV, −0.61 eV and −1.54 eV, respectively. In contrast, CH4 dehydrogenation is unfavorable on Pt/ZrO2 with a reaction energy of 1.11 eV. The reaction energies for Eqs. 4 and 5 determine the tendency of CH3* to combine with OH* to form CH3OH or to be further dehydrogenated. The results show that CH3* prefers to react with OH* to yield CH3OH product on Pt/TiO2, Pt/ZrO2 as well as Pt(111) surface, while Pt/CeO2 with strong chemical activity can dehydrogenate CH3* to CH2* intermediate. In contrast to other systems, the reaction energies of two Eqs. 4 and 5 on the Pt/CeO2 (Ce) system are both close to 0. The kinetic barrier dominates selectivity, as will be discussed later. We examined the reaction Eq. 3 to check whether OH* can be produced by dissociation of H2O on these systems.
Figure 2
Figure 2.
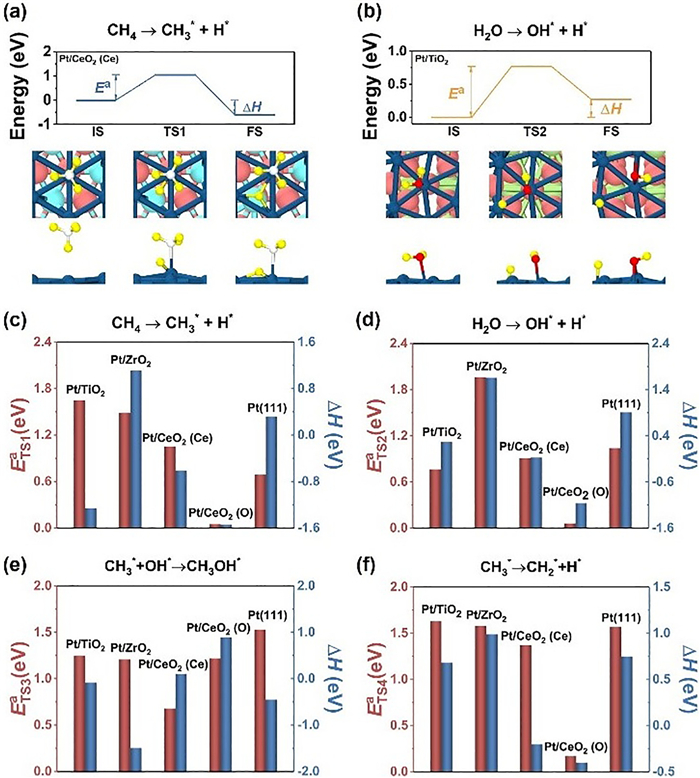
Kinetic process of CH4 conversion and H2O dissociation. Energy diagrams of (a) CH4 activation and (b) H2O dissociation on Pt/TMOs. The reaction heat (ΔH), kinetic barriers (Ea), and the corresponding structure configurations are given in insets. Histogram of reaction energies and kinetic barriers for (c) CH4 → CH3* + H*, (d) H2O → OH* + H*, (e) CH3* + OH* → CH3OH and (f) CH3*→ CH2* + H* processes on various Pt/TMOs systems and bulk-phase Pt(111).
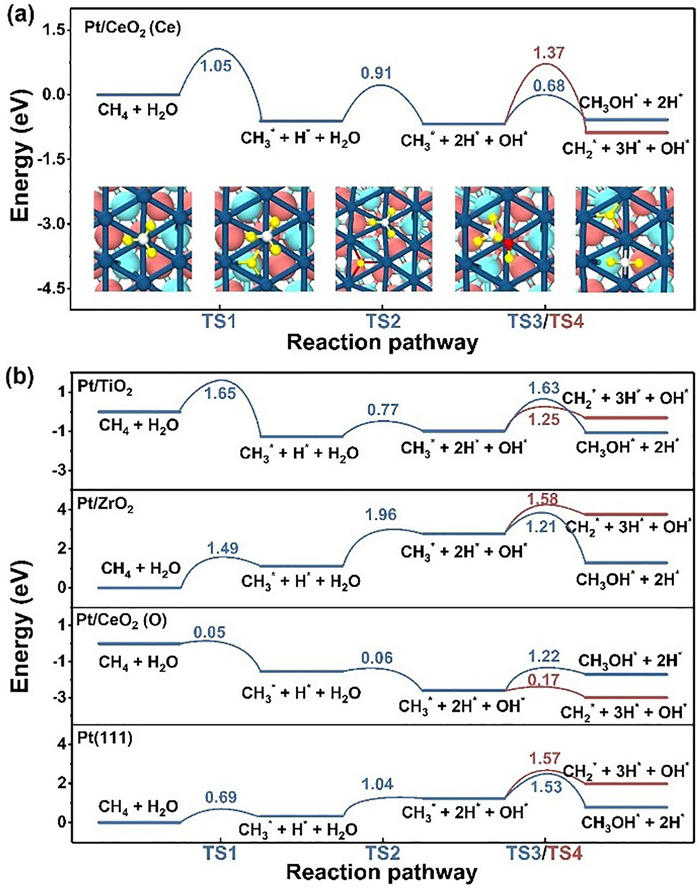
To further evaluate the catalytic performance of each system, we calculated the kinetic barriers for Eqs. 2–5. Figs. 2a and b show the schematic diagrams of CH4 dehydrogenation and H2O dissociation on Pt/CeO2 (Ce) and Pt/TiO2, respectively. The values of kinetic barriers are represented by bars in Figs. 2c-f. Fig. 3a shows the complete reaction pathways of Pt/CeO2 (Ce) and the corresponding adsorption conformation. The detailed information of other systems is shown in Fig. 3b. The transition states of Eqs. 2–5 were represented as TS1, TS2, TS3 and TS4, respectively. The kinetic barriers of Pt/TiO2 are 1.65, 0.77, 1.63 and 1.25 eV for TS1, TS2, TS3 and TS4, respectively. TS2 has a much smaller kinetic barrier than those of other reactive steps. Too easy decomposition of H2O may occupy the active sites and leads to inactivation of catalyst. The kinetic barriers of Pt/ZrO2 are 1.49, 1.96, 1.21 and 1.58 eV for TS1, TS2, TS3 and TS4, respectively. The high kinetic barrier of H2O dissociation results in low activity for Pt/ZrO2, due to the deficiency of OH* for CH3OH production. The kinetic barriers of the Pt/CeO2 (Ce) system are 1.05, 0.91, 0.68 and 1.37 eV for TS1, TS2, TS3 and TS4, respectively. The rate-determining step (RDS) of Pt/CeO2 (Ce) system is TS1 with kinetic barrier of 1.05 eV, while the RDS of bulk-phase Pt(111) is TS3 with larger kinetic barrier of 1.53 eV. Therefore, the CH4 to CH3OH conversion is easier to achieve on Pt/CeO2 (Ce) than that on bulk Pt. On the other hand, the kinetic TS2, TS3 and TS4, respectively, which indicates that CH3 dehydrogenation to CH2* is more favorable than the formation of CH3OH. To gain a clear understanding of the product selectivity of Pt/CeO2 (O), we further consider the following dehydrogenation processes (Eqs. 6 and 7):
(6)
(7)
(8)
Figure 3
Figure 3.
The reaction pathway of CH4 conversion. (a) The reaction pathway of CH4 conversion on Pt/CeO2 (Ce), and the corresponding structure configurations are given in insets. (b) The reaction pathway of CH4 conversion on other Pt/TMOs systems and bulk-phase Pt(111) surface. The color number is the kinetic barrier for each reaction step.
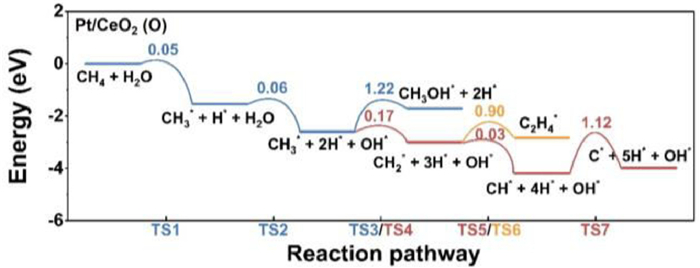
The transition states of Eqs. 6–8 were represented as TS5, TS6 and TS7. As shown in Fig. 4, the kinetic barriers of the above processes on Pt/CeO2 (O) are 0.03, 0.90 and 1.12 eV for TS5, TS6 and TS7, respectively. The CH2* intermediate prefers further dehydrogenation to generate CH*, rather than the coupling with another CH2* to form C2H4*. The CH* species may be further dehydrogenated to produce C*, which would occupy the active site and poison the catalysts [60]. Therefore, Pt monolayers on various substrates exhibit different catalytic behavior. Pt/CeO2 (Ce) has higher activity for CH4 conversion to CH3OH, while Pt/CeO2 (O) may be over-reactive and suffer from coke and deactivation.
Figure 4
Figure 4.
The further dehydrogenation processes on Pt/CeO2 (O). The colored number is the kinetic barrier for each reaction step.
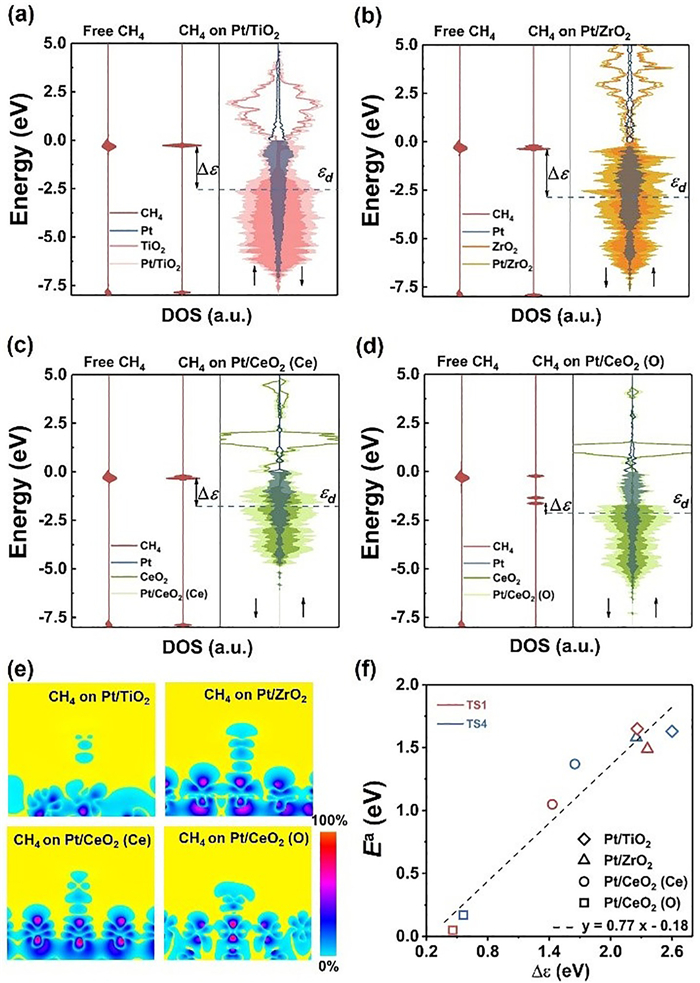
To further elucidate the substrate effects, we examined the electronic structures of Pt monolayer on various substrates. We calculated the density of states (DOS) for each system after CH4 adsorption and compared it with the DOS of free gas phase CH4. Figs. 5a-d show the DOS of Pt/TMOs. The d-band center of the Pt monolayer is calculated using the following equation (Eq. 9) [61]:
(9)
Figure 5
Figure 5.
The orbital interaction of CH4 adsorbed on Pt/TMOs. (a-d) Local density of states (DOS) of (from left to right) gas-phase and adsorbed CH4 molecule, and Pt/TMOs. (e) Differential charge density between Pt overlayer and CH4. (f) The relationship between the kinetic barriers (Ea) and Δε.
where D(E) is the DOS of the d-band of the Pt monolayer at a given energy E, the integral is taken up to the Fermi level (shifted to zero). The d-band center of the Pt monolayer is indicated by the blue dashed line in Figs. 5a-d. Due to the interfacial charge transfer, the Pt monolayers grown on different substrates have different d-band centers. It is worth noting that the variation of d-band center of Pt monolayer is not only related to the amount of charge transfer, but also depends on the DOS distribution of the substrate. Specifically, the DOS of ZrO2 is mainly distributed at −2~−7 eV, which leads to the d-band center of Pt monolayer far away from the Fermi level (Fig. 5b). The DOS of CeO2 (O) is mainly distributed at −1.5~−5 eV, which leads to the d-band center of Pt monolayer closer to the Fermi level (Fig. 5d).
The activity of Pt overlayer is closely related to its d-band center modulated by the presence of substrate. Figs. 5a-d show the energy level of CH4 upon adsorbing on the Pt overlayer. For Pt/CeO2 (O), the anti-bonding (σ*) orbital level of CH4 exhibits a notable shift to the Fermi level owing to the charge transfer from Pt overlayer to CH4. The Bader charge analysis shows that CH4 gains 0.23 e from d orbital of Pt/CeO2 (O), while only about 0.02 e charge transfer occurred for the other three systems. The injection of electrons increases the polarization of CH4 molecule, elongating the C-H bond length to 1.09~1.18 Å and weakening the C-H bond. Fig. 5e depicts the two-dimensional charge distribution between Pt monolayer and CH4. Fig. 5f displays a linear relationship between the activation energy of C-H bond and the d-band center of Pt overlayer relative to σ* of CH4* (Δε). Roughly speaking, a lower Δε value indicates more charge transfer from d-band center of Pt overlayer to the anti-bonding orbital of adsorbate, thus resulting in a lower activation energy for C-H bond cleavage in both CH4 and CH3* species. Therefore, the energy difference between d-band center of Pt overlayer and the anti-bonding orbital of adsorbate is a possible descriptor to predict the activation energy of C-H bond, which guides the rational selection of proper substrates to tune the catalytic performance of metal overlayers for certain reactions.
In summary, we investigate the geometrical and electronic structures of Pt monolayer supported on various metal oxide surfaces and exploit them for CH4 conversion based on first principles calculations. Monolayer Pt on Ce-terminated CeO2(111) surface is a potential catalyst for CH4 conversion to CH3OH with high activity and selectivity. The relationship between chemical activity and electronic structure was established for supported Pt monolayer hybrid systems. The reaction occurs more readily with smaller Δε. Moreover, the substrate with more density of states distributed near the Fermi level induces larger changes of the d-band center of Pt monolayer. These computational results provide useful insights for the design of high-efficiency metal overlayers for direct and selective CH4 conversion.
Declaration of competing interest
The authors declare that they have no known competing financial interests or personal relationships that could have appeared to influence the work reported in this paper.
Acknowledgments
This work was supported by the National Natural Science Foundation of China (Nos. 11974068, 91961204, and 12004065), the Fundamental Research Funds for the Central Universities of China (No. DUT20LAB110), the Liaoning Provincial Natural Science Foundation of China (No. 2019JH3/30100002), and Key Research and Development Project of Liaoning Province (No. 2020JH2/10500003). The authors gratefully acknowledge the computer resources provided by the Supercomputing Center of Dalian University of Technology and Shanghai Supercomputer Center. We gratefully acknowledge HZWTECH for providing computation facilities.
[1]
Z.R. Chong, S.H.B. Yang, P. Babu, P. Linga, X.S. Li, Appl. Energy 162 (2016) 1633–1652. doi: 10.1016/j.apenergy.2014.12.061
Figure 1
Geometrical structures of Pt/TMOs hybrid systems. Atomic structures of Pt/TMOs (a-d) and corresponding differential charge density distributions (e-h). White lines labeled the lattice. The Pt, O, Ti, Zr, and Ce atoms are shown by dark blue, pink, green, purple and blue balls, respectively.
Figure 2
Kinetic process of CH4 conversion and H2O dissociation. Energy diagrams of (a) CH4 activation and (b) H2O dissociation on Pt/TMOs. The reaction heat (ΔH), kinetic barriers (Ea), and the corresponding structure configurations are given in insets. Histogram of reaction energies and kinetic barriers for (c) CH4 → CH3* + H*, (d) H2O → OH* + H*, (e) CH3* + OH* → CH3OH and (f) CH3*→ CH2* + H* processes on various Pt/TMOs systems and bulk-phase Pt(111).
Figure 3
The reaction pathway of CH4 conversion. (a) The reaction pathway of CH4 conversion on Pt/CeO2 (Ce), and the corresponding structure configurations are given in insets. (b) The reaction pathway of CH4 conversion on other Pt/TMOs systems and bulk-phase Pt(111) surface. The color number is the kinetic barrier for each reaction step.
Figure 5
The orbital interaction of CH4 adsorbed on Pt/TMOs. (a-d) Local density of states (DOS) of (from left to right) gas-phase and adsorbed CH4 molecule, and Pt/TMOs. (e) Differential charge density between Pt overlayer and CH4. (f) The relationship between the kinetic barriers (Ea) and Δε.
Table 1.
The key parameters of Pt/TMOs hybrid systems including lattice mismatch (δ), interlayer distance (d), vertical buckling of Pt monolayer (ΔdPt), Pt-Pt bond length (hPt-Pt), formation energy per Pt atom in Pt monolayer (Eform), charge transfer between Pt monolayer and the substrate (CT), the d-band center of Pt monolayer (εd).

 DownLoad:


 下载:
下载:


