Figure 1.
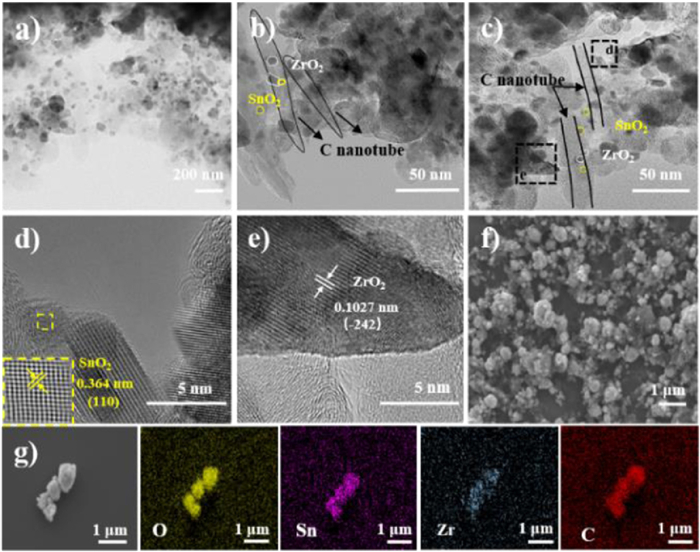
(a–c) TEM images of SnO2/C/ZrO2. (d, e) High-resolution TEM images of SnO2/C/ZrO2. (f) SEM images, (g) SEM images and element mapping images of SnO2/C/ZrO2.
Hybrid coating SnO2 for enhanced Li ions storage
Yanan Gao , Jie Liu , Chenjie Lou , Hailiang Geng , Jipeng Fu , Chengyu Li , Yongjin Chen , Cong Wang , Wenda Zhang , Xiaojun Kuang , Yifan Liu , Xiang Gao , Mingxue Tang

Lithium-ion batteries (LIBs) have been widely employed as large-scale energy storage and rechargeable electrical devices with merits of lightweight, high energy density, large operating voltage window, and long-term cycling [1]. Among all anode materials, graphite is primarily used as an anode in commercial LIBs because of its long-term cycling durability and low cost. However, it is still suffered from the low theoretical specific capacity (372 mAh/g) and inferior rate capability [2,3]. Tremendous efforts have been devoted to developing suitable anode materials with satisfied electrochemical performances. Tin(Sn)-based oxide materials have been demonstrated as potential anodes to substitute for graphite due to their appealing features, such as low cost and large theoretical specific capacity (993 mAh/g) [4,5]. The direct use of SnO2 as anode material in the process of dis-/charge for LIBs suffers from volume expansion and poor electronic conductivity [6,7]. A reliable method is reducing material size to nanoscale, which can reduce mechanical stress of each particle and inhibit the tendency of cracks. Recently, metal-organic frameworks (MOFs) could be a promising template to fabricate nanomaterials for LIBs [8,9], and Sn-based oxide materials (e.g., SnO2) derived from MOFs exhibit tangible reversible capacities and rate capabilities [10,11]. Even then, many issues of such materials are still unsolved: (1) The capacity decays quickly because of agglomeration during the process of dis-/charge; (2) The poor electron and ion migration kinetics caused by the attribute of oxide. To address the above problems, compositing the electrode material with carbon is a typical method to buffer volume variation and prevent agglomeration of the SnO2 [12,13]. At the same time, carbon or carbon nanotubes (CNTs) can also work as conductive channels between the SnO2 and the fluid collector, resulting in stabilized structure and increased electronic conductivity. Li et al. anchored SnO2 to CNTs to deliver high reversible capacity for LIBs. However, the CNTs tend to stack on each other during electrochemical cycling [14,15]. Of all metal oxides, ZrO2 is a widely investigated material in energy field due to its excellent mechanical strength and stability at a variety of temperatures. But it is prohibited from large-scale use due to poor electronic conductivity alone [16]. Therefore, an effective and feasible strategy is to carefully combine merits of each part to work together [17,18].
Herein, we demonstrate an anode with a hybrid structure, in which ultrasmall SnO2 and ZrO2 nanoparticles are uniformly anchored onto carbon nanotubes (denoted as SnO2/C/ZrO2). The nanosized SnO2 structures with large surface areas derived from MOFs can not only relax the volume change for electrodes but also provide abundant sites to store lithium and sufficient electrode-electrolyte contact area for electrochemical reactions. At the same time, it could shorten the diffusion length of Li ions/electrons to accelerate electrochemical kinetics. ZrO2 nanoparticles are suitable for ion circulation, electron transport improvement, and auxiliary agents. Moreover, the interaction of the two materials and CNTs inhibits the agglomeration and fragmentation of SnO2, thereby slowing the volume expansion during cycling. The SnO2 and ZrO2 nanoparticles inhibit the accumulation of CNTs. Thus, the composite material exhibits excellent electrochemical performance.
Figs. S1 and S2 (Supporting information) show the structural characterization of the material. After the subsequent annealing of Sn-MOF, the pure SnO2 (PDF #77-0447) is successfully obtained with decreased particle size deduced from the wider diffraction peak (Fig. S1a) [16]. Then after ball milling, the final product contains SnO2 and ZrO2 (PDF #72-1669). The diffraction peak is broader than that of pure SnO2. Three characteristic XRD peaks at 26.6°, 33.9° and 51.7° could be well assigned to (110), (101) and (211) planes of SnO2, the residual peaks at 28.17°, 40.71°, 44.85°, 50.14° and 31.42° reign from the (111), (211), (112), (220) and (111) planes of ZrO2, respectively [19,20]. XRD pattern (Fig. S1) indicates that the high purity of the product and the particle size of the SnO2 became smaller after ball milling with ZrO2. In addition, all the diffraction peaks of Sn-MOF match well with the standard patterns from previously reported literature (Fig. S2) [21,22].
X-ray photoelectron spectroscopy (XPS) reveals the elemental composition and surface chemical state. The XPS survey spectrum (Fig. S2) confirms the coexistence of Sn, C, Zr and O elements in SnO2/C/ZrO2 composite. As shown in Fig. S1b, the two intensive peaks at 495.5 and 486.4 eV associated with Sn4+ of SnO2 are assigned to Sn 3d3/2 and Sn 3d5/2, respectively [23,24]. For C 1s spectrum (Fig. S1c), the peak at 284.8 eV is corresponding to sp2-hydridized C-C/C=C, other two peaks at 285.7 and 290.3 eV are attributed to C-O and O-C=O, respectively [9,25]. The C-C bond is attributed to CNTs. The Zr 3d spectrum (Fig. S1d) shows two strong peaks with binding energy values of 182.98 and 185.31 eV, which are attributed to Zr 3d5/2 and Zr 3d3/2 of Zr4+ in composite [16,26]. According to Fig. S1e, the O 1s XPS spectrum shows two peaks, located at 530.8 and 532.4 eV, indicating the existence of O-M (M is metal) and C-O bond.
Thermogravimetric (TG) analysis under air is performed to check the stability and to determine the weight ratio of CNTs in SnO2/C/ZrO2. As the temperature increases to 400 ℃, the mass of the composite begins to decrease (Fig. S1f) and keeps constant when the temperature reaches 670 ℃ or even higher, yielding about 15 wt% of CNTs in SnO2/C/ZrO2 [27]. This result agrees well with the ratio of the precursor mixture. TG under air is also conducted to ascertain the weight ratio of SnO2, which is obtained by annealing Sn-MOF under air. As shown in Fig. S2, the slight decrease in weight is probably due to the moisture absorbed on the surface and a small amount of C layer from the Sn-MOF. Furthermore, the C in the composite was tested by using Raman spectroscopy. As displayed in Fig. S2, the characteristic carbon peak at 1340.22 cm−1 is indexed as D band from sp2 carbons with defects, and 1573.93 cm−1 of G band corresponds to the vibration of planar sp2 configured carbon atoms. The signal intensity ratio (ID/IG) was found to be 0.85 for the SnO2/C/ZrO2 composite, which is higher than that for the SnO2/C composite (ID/IG ≈ 0.60). This difference in ID/IG is attributed to the presence of the defects induced by ball milling with ZrO2 and C, accompanied by the electronic interaction between nanoparticles and CNTs [14].
High-resolution transmission electron microscopy (HRTEM) images confirm the well-defined nanostructure of the SnO2/C/ZrO2. Figs. 1a–c reveal that SnO2 shows circular morphology with narrow distribution for particle size. The morphology of ZrO2 is relatively irregular and uniformly distributed on the surface of carbon nanotubes without agglomeration. The magnified TEM images (Figs. 1b and c) further clearly show that SnO2 and ZrO2 are randomly anchored on the CNTs. More detail can be referred to in Fig. S3 (Supporting information), from which the size of SnO2 in the SnO2/C composite is much larger than that of SnO2/C/ZrO2. This is possibly attributed to two reasons: (1) The nanosized ZrO2 could improve the refinement of SnO2 particles for smaller size during ball milling; (2) The carbon nanotube, ZrO2 and SnO2 nanoparticles are mixed uniformly to prevent SnO2 from agglomeration. In addition, the introduction of ZrO2 also keeps the C nanotube from the stack for structural stability. HRTEM images of SnO2/C/ZrO2 exhibit visible lattice fringes with the distinct d-spacing of 0.364 nm identified as (110) planes of SnO2, and 0.103 nm indexed to the (242) plane of ZrO2 (Figs. 1d and e) [16,28]. The results here are consistent with the XRD results, and corresponding to the cause of diffraction peak width. Sn-MOF, which was synthesised at 50 ℃, followed by annealing to obtain the product SnO2. Their morphologies and structures are tracked by XRD (Figs. S2a and b) and SEM (Figs. S4a–d in Supporting information). SnO2 precursor exhibits uniform cubic morphology and smooth surface. SnO2 presents a cube made of a frame of coarse particles structure with an average size of ~100 nm, Energy-dispersive X-ray spectroscopy (EDS) shows that SnO2 contains elements of Sn, O (Figs. S4e–h in Supporting information). After the ball milling with ZrO2 and CNTs, field emission scanning electron microscopy (FESEM) images (Figs. 1f and g) display that SnO2/C/ZrO2 exhibits irregular morphology with a size of ~1 µm. EDS elemental mapping images of SnO2/C/ZrO2 show the distribution of Sn, O, C and Zr elements.
As shown in Fig. 2a, typical cycle voltammetry (CV) curves at a scan rate of 0.1 mV/s show the lithium storage behavior of the SnO2/C/ZrO2 electrode. In the first cathodic cycling, a small reduction peak at around 1.08 V is assigned to the conversion of SnO2 to Sn and Li2O (reaction 1) [29,30], the subsequent small peak at 0.24 V corresponds to the alloying reaction between Li and Sn (reaction 2) [31]. An irreversible peak at 0.74 V is ascribed to the formation of a solid electrolyte interface (SEI) layer on the active material surface [32], and the peak at 0.01 V is assigned to the intercalation of Li+ into CNTs [33-35]. During the anodic scan, a set of peaks around 0.14 V related to the deintercalation process of Li+ from C, an oxidation peak at 0.56 V is deemed to de-alloy from LixSn to Sn, and the other broad oxidation peaks at 1.29 and 1.82 V confirm the reverse evolution of Sn into SnO2 [29]. The above results are similar to the mechanism of SnO2/C and SnO2 electrodes (Fig. S5 in Supporting information). From the second and third cathodic scans onward, two peaks at around 1.2 and 0.26 V are detected, which are assigned to the formation of Li2O and LixSn, respectively. Two small peaks at 0.76 and 0.57 V correspond to the formation of Sn. The following oxidation peak at 0.54 V is supposed to de-alloy reaction, and the broad oxidation peaks at 1.31 and 1.82 V are attributed to the oxidation of Sn to SnO2 [36,37]. Meanwhile, the second and the third CV curves nearly overlap with each other, which indicate a good electrochemical reaction during repeated Li+ insertion-extraction. The related reactions can be described as follows:
|
|
(1) |
|
|
(2) |
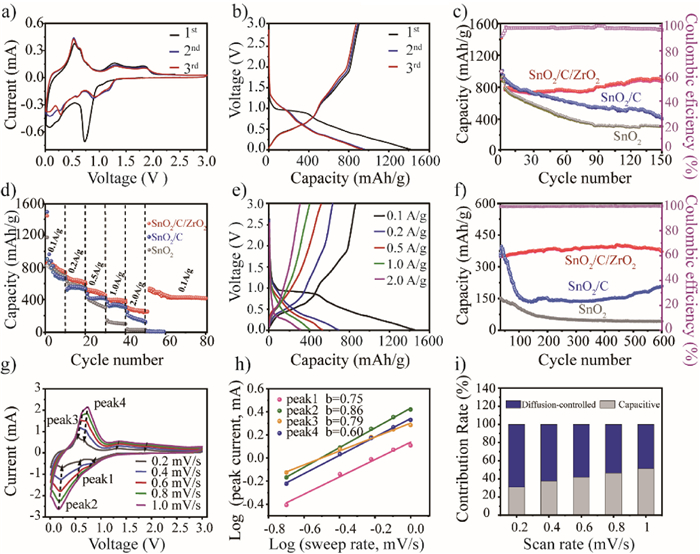
Fig. 2b shows the representative dis-/charge profiles of the SnO2/C/ZrO2 electrode at a current density of 0.1 A/g. The SnO2/C/ZrO2 electrode delivers initial discharge and charge capacities of 1416.3 and 901.6 mAh/g, respectively, yielding an initial Coulombic efficiency (CE) of 63.65%. The relatively low initial CE is mainly due to the decomposition of electrolytes and the formation of SEI film [27,31]. Fig. 2c further investigates the cycling stability of the composites electrodes at a current density of 0.1 A/g with a voltage range of 0.01-3.0 V. A high specific capacity of 901.1 mAh/g of SnO2/C/ZrO2 is obtained over 150 cycles without obvious capacity fading, in the meantime, the composites demonstrate high Coulombic efficiency (> 99%) after the initial cycles. With the cycle continues, the slight rise of capacity may be attributed to the activation process of electrodes and the better contact between electrolyte and electrode [3,27]. For comparison, the SnO2/C and SnO2 electrodes were electrochemically cycled as well, smaller capacities are obtained for SnO2/C (412.8 mAh/g) and un-confined SnO2 nanoparticles (311.1 mAh/g) after 150 cycles, manifesting poor performance with substantial capacity attenuation. Electrochemical impedance spectra (EIS) indicate that the charge-transfer resistance of the SnO2/C/ZrO2 is much smaller than that of the SnO2/C and SnO2 electrode (Fig. S6 in Supporting information). Turns to SnO2/C/ZrO2 (Fig. 2d), capacities of 1450.7, 690, 535.5, 407.6, 313.6 and 260.5 mAh/g are obtained under cycling current densities of 0.1, 0.2, 0.5, 1 and 2 A/g, respectively. Notably, the performance of the SnO2/C/ZrO2 electrode is distinctly better than those of the SnO2/C and SnO2 electrodes. Importantly, when the current density recalls to the initial value of 0.1 A/g, a capacity of 558.8 mAh/g is recovered. The initial dis-/charge diagrams of different currents are shown in Fig. 2e. The TEM images of the cycled SnO2/C/ZrO2 electrode show no serious agglomeration, and the lattice of SnO2 became disordered due to the insertion and ejection of Li+ (Fig. S3). As presented in Fig. 2f, the SnO2/C/ZrO2 electrode delivers a capacity of 371.1 mAh/g over 600 cycles at a current density of 1 A/g. For comparison, the capacities of the SnO2/C and SnO2 electrodes drop rapidly upon deep cycling (Fig. 2f).
To further reveal the electrochemical reaction kinetics of the SnO2/C/ZrO2 electrode, CV curves were performed by varied scan rates from 0.2 mV/s to 1 mV/s. From Fig. 2g, multiple peaks are detected in the CV curves, and the peak current acts as the indicator of the electrochemical behavior, indicating smaller polarization and better electrochemical reaction kinetics. In addition, the kinetic analysis of SnO2/C and SnO2 electrodes with lithium storage were also carried out in Fig. S5. As known from Dunn, the effect of pseudo-capacitance could be calculated by confirming the relationship of peak current (i) and scan rate (ν) on the basis of the following Eqs. 3 and 4:
|
|
(3) |
|
|
(4) |
In the above equations, a is constant, and b value is determined by log(i) and log(ν). Generally, when b value is close to 1, the capacitive behavior is the charge storage process, whereas as it approaches 0.5, the diffusion-controlled process plays the key role. Herein, the b values are 0.75, 0.86, 0.79 and 0.60, respectively, indicating both diffusion-controlled and capacitive behaviors are involved. The proportion of pseudo-capacitance and diffusion mechanisms can be further quantified according to the following equations:
|
|
(5) |
|
|
(6) |
where k1 and k2 are constants at a given potential. In Eq. 5, k1ν represents the capacitive contribution and k2ν1/2 is controlled by diffusion. Eq. 6 is derived from Eq. 5, and k1 the value corresponds to the slope of and i/ν1/2 and ν1/2, k2 represents the intercept. Fig. 2i shows pseudocapacitive contributions at different scan rates, the contributions are 32.6%, 39.6%, 40.8%, 43.2% and 45.6% at the scan rates of 0.2, 0.4, 0.6, 0.8 and 1.0 mV/s, respectively [38]. Thus, the diffusion-controlled process contributes major capacity at low current density, and with the increase in the scan rates, the proportions of pseudo-capacitance increase. The pseudo-capacitance contribution for SnO2/C and SnO2 electrodes at various scan rates were shown in Fig. S5. The results turn out that the capacity contribution offers the primary reversible capacity. Subsequently, the pseudocapacitive fractions at the rate of 0.2, 0.4, 0.6, 0.8 and 1.0 mV/s (Fig. S5), which are consistent with the b values. The result is an analogy to the behavior of metal oxides and metal chalcogenides.
All the above results demonstrate that the rational structural and compositional design can effectively improve lithium storage properties. More specifically, uniformly anchored nanostructures possess a large specific surface area, which efficiently facilitates the diffusion of electrons and Li+ ions and electrochemical activity. Both nanostructures and CNTs could effectively accommodate the enormous volume change during the insertion and extraction of Li+ ions hence improving the stability of the electron material. CNTs not only effectively improve the electronic conductivity and observably accelerate the ion/charge transfer process of the SnO2/C/ZrO2 composite but also conveniently restrict the growth of the SEI layer [25]. ZrO2 prevents the aggregation and stacking of the other two nanomaterials during the cycle to improve cycling performance.
Nuclear magnetic resonance (NMR) spectroscopy is proven a suitable approach to detect local structures and chemical environments [39]. 6Li and 7Li NMR experiments clearly show the electrochemistry mechanism upon the first cycling of the SnO2/C/ZrO2 electrode. As shown in Fig. 3a, solid-state 7Li NMR spectra of various cycled SnO2/C/ZrO2 electrodes show multiple spinning sidebands (SSBs) with low resolution. All signals cover up to ~800 ppm due to intensive anisotropy in the hybrid solids. To get better spectral resolution, a detailed analysis is made for 6Li NMR spectra with small quadropolar interaction as plotted in Fig. 3b, with all SnO2/C/ZrO2 electrodes showing an isotropic signal centered at 0 ppm. When the electrode is discharged to 1 V, two peaks are analyzed at 0.2 ppm and 3.5 ppm [40]. The one located at 0.2 ppm is attributed to irreversible Li and SEI components, such as LiF and Li2CO3 [27,41,42]. Another peak at 3.5 ppm is related to the formation of Li2O. When the electrode is discharged to 0.6 V, the peak at 0.2 ppm grows, reflecting successive generations of SEI. When the electrode is further discharged to 0.01 V, two extra peaks at 8.5 ppm and 12.5 ppm are present, corresponding to the formation of LixSn [41].
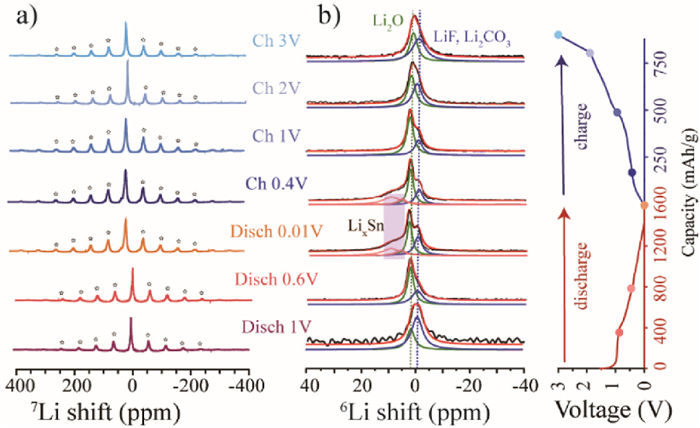
During the subsequent charge process, the peaks of LixSn reside till 0.4 V and disappear completely in high voltage range. LiF and Li2CO3 are observed in the end due to the incomplete reversibility, being consist with electrochemical curves [43]. The NMR results provided coincide with the mechanism reflected by the afore-mentioned CV analysis (Fig. 2a). In addition, 119Sn spectra (Fig. S7 in Supporting information) prove that the introduction of ZrO2 does not change the structure of SnO2. Furthermore, XRD measurements on the electrodes at different states of charge (Fig. S8 in Supporting information), the electrode exhibits Sn peak when discharged to 1 V and recovery of SnO2 diffraction peak upon charge to 3 V [44].
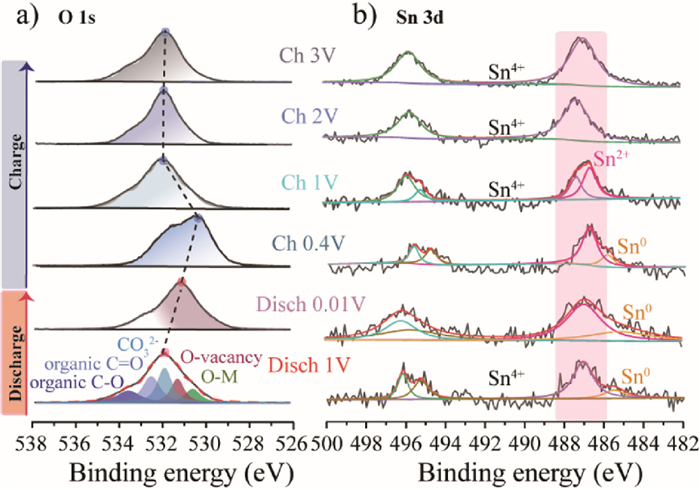
Furthermore, the O 1s from ex-situ XPS (Fig. 4a) indicates that C-O, C=O, CO32− and O-M appeared in the electrode upon discharge to 1 V [39]. The peak at ~531.6 eV is possibly from oxygen vacancy. The peak of O 1s with binding energy decreases slightly during the discharge process [45]. This phenomenon is possibly attributed to the outer electrons having a shielding effect on the inner electrons, when the density of the outer electrons increases, the shielding effect is enhanced, resulting in a decrease in the binding energy. Reverse evolution of peak is observed in the subsequent charge process. The presence of oxygen vacancies could promote ion diffusion kinetics, improve electronic conductivity, and provide additional active sites involved in Li+ storage [46]. XPS of Sn 3d is plotted in Fig. 4b for the cycled anodes. The detailed information of Sn in pristine SnO2/C/ZrO2 could refer to Fig. S1. When the anode is discharged to 1 V, the binding energy of Sn slightly moves to a lower value, which means a small number of Sn ion is reduced due to the injection of electrons from the outer circuit. The binding energy of Sn shows a much more obvious shift upon further discharge from 1 V to 0.01 V. Nevertheless, metal Sn0 (~485.8 eV) is observed upon charge to 0.4 V [47], revealing the formation of alloying. When the anode is further charged to 3.0 V, intense oxidation occurs to form more Sn4+ [48].
EPR is preliminarily carried out on these materials. Fig. S9a (Supporting information) shows that SnO2 and ZrO2 are EPR silent, and CNTs show a broad signal at g ≈ 1.999 due to the delocalized electrons. Meanwhile, the pristine SnO2/C/ZrO2 powder displays a very weak narrow symmetric signal at g ≈ 1.999, which could be attributed to the oxygen vacancy [49,50]. This may be due to the mechanical shear forces and pressures exerted on the powder during ball milling, resulting in lattice distortion and introducing oxygen vacancies. Compared with the pristine sample, the EPR signal changes (Fig. S9b in Supporting information) during cycling, which may be due to fine particles of Sn or LixSn alloys [51,52]. For the electrodes at 0.01, 0.4 and 1 V, there is an additional weak broad peak formation, estimated for large particles of the alloy. Detailed investigation will be conducted in the coming work.
In this work, an effective synthetic strategy, using nanosized ZrO2 and C nanotubes as a stabilizer and conductive layer, is proposed to hybrid with SnO2 nanoparticles by calcinating Sn-MOF. Meanwhile, the ultrasmall and high-content ZrO2 were homogeneously dispersed into CNTs, avoiding the agglomeration of SnO2 and CNTs during de/lithiation. As a result, the optimized SnO2/C/ZrO2 composite displays satisfactory lithium-storage properties. High-resolution 6, 7Li NMR analysis clarifies conversion and LixSn alloying mechanisms for SnO2/C/ZrO2 composites. This controllability of the structure and lithium storage performance entitled by the hybrid engineering technique could be extended to other conversation and alloying-type materials that suffered from a dramatic volume change during operation.
The authors report no declarations of interest.
The authors thank to the support from the National Natural Science Foundation of China (Nos. 21974007 and 22090043).
Supplementary material associated with this article can be found, in the online version, at doi:
S. Zhang, R. Li, N. Hu, et al., Nat. Commun. 13 (2022) 5431. doi: 10.1038/s41467-022-33151-w
B. Li, M.T. Sougrati, G. Rousse, et al., Nat. Chem. 13 (2021) 1070. doi: 10.1038/s41557-021-00775-2
Q. Li, L. Li, P. Wu, et al., Adv. Energy Mater. 9 (2019) 1901153. doi: 10.1002/aenm.201901153
J. Liang, Y. Zhao, L. Guo, L. Li, ACS Appl. Mater. Interfaces 4 (2012) 5742. doi: 10.1021/am301962d
M.S. Park, G.X. Wang, Y.M. Kang, et al., Angew. Chem. Int. Ed. 46 (2007) 750–753. doi: 10.1002/anie.200603309
Y. Cheng, S. Wang, L. Zhou, et al., Small 16 (2020) 2000681. doi: 10.1002/smll.202000681
X. Zhou, L. Wan, Y. Guo, Adv. Mater. 25 (2013) 2152–2157. doi: 10.1002/adma.201300071
F. Liu, L. Wang, F. Ling, et al., Adv. Funct. Mater. 32 (2022) 2210166. doi: 10.1002/adfm.202210166
Z. Cao, B. Li, S. Yang, Adv. Mater. 31 (2019) 1901310. doi: 10.1002/adma.201901310
K. Liu, S. Zhu, X. Dong, H. Huang, M. Qi, Adv. Mater. Interfaces 10 (2020) 1901916.
Q. Mou, X. Wang, Z Xu, et al., Chin. Chem. Lett. 33 (2022) 562–566. doi: 10.1016/j.cclet.2021.08.028
K. Hui, J. Fu, J. Liu, et al., Carbon Energy 10 (2021) 709–720.
L. Shi, D. Li, P. Yao, et al., Small 14 (2018) 1802716. doi: 10.1002/smll.201802716
X. Deng, M. Zhu, J. Ke, et al., Ceram. Int. 47 (2021) 14310–15301.
Y. Li, J. Song, X. Hong, J. Colloid Interface Sci. 602 (2021) 789–798. doi: 10.1016/j.jcis.2021.06.076
X. Dong, Q. Han, Y. Kang, et al., Chin. Chem. Lett. 33 (2022) 567–572. doi: 10.1016/j.cclet.2021.06.022
C. Hu, L. Chen, Y. Hu, et al., Adv. Mater. 33 (2021) 2103558. doi: 10.1002/adma.202103558
K. Gong, Y. Ma, T. Zhang, et al., Adv. Energy Mater. 23 (2021) 2100064.
Y. Du, Y. Zhang, L. Li, N. Wang, Y. Chai, Appl. Surf. Sci. 543 (2021) 148870. doi: 10.1016/j.apsusc.2020.148870
R. Li, C. Miao, L. Yu, M. Zhang, W. Xiao, Mater. Lett. 272 (2020) 127851. doi: 10.1016/j.matlet.2020.127851
B. Lu, X. Liu, Y. Gan, S. Zhang, S. Shi, Adv. Funct. Mater. 31 (2021) 2101999. doi: 10.1002/adfm.202101999
D. McNulty, H. Geaney, Q. Ramasse, C. Dwyer, Adv. Funct. Mater. 30 (2020) 2005073. doi: 10.1002/adfm.202005073
L. Shi, D. Li, P. Yao, et al., Small 14 (2018) 1802716. doi: 10.1002/smll.201802716
J. Ru, T. He, B. Chen, et al., Angew. Chem. Int. Ed. 59 (2020) 14621–14627. doi: 10.1002/anie.202005840
H. Zhang, X. Zhang, H. Jing, et al., Chem. Eng. J. 360 (2019) 974–981. doi: 10.1016/j.cej.2018.07.054
S.H. Song, J. Wei, X. He, et al., RSC Adv. 11 (2021) 35361–35374. doi: 10.1039/D1RA07060F
J. Liu, C. Lou, J. Fu, et al., J. Energy. Chem. 70 (2022) 604–613. doi: 10.1016/j.jechem.2022.02.053
Y. Feng, K. Wu, J. Ke, et al., J. Power Sources 467 (2020) 228357. doi: 10.1016/j.jpowsour.2020.228357
Y. Zhang, Z. Cao, S. Liu, Adv. Energy. Mater. 12 (2022) 2103979. doi: 10.1002/aenm.202103979
B. Jang, C. Liu, Neff, et al., Nano Lett. 11 (2011) 3785–3791. doi: 10.1021/nl2018492
T. Gao, K. Wong, K. Ng, Energy Storage Mater. 25 (2020) 210–216. doi: 10.1016/j.ensm.2019.10.013
S. Wang, Y. Fang, X. Wang, X.W.D. Lou, Angew. Chem. 131 (2019) 770–773. doi: 10.1002/ange.201810729
J. Read, D. Foster, J. Wolfenstine, W. Behl, J. Power. Sources 15 (2001) 277–281.
T. Yuan, J. Ruan, C. Peng, et al., Energy Storage Mater. 13 (2018) 267–273. doi: 10.1016/j.ensm.2018.01.014
D. Cui, Z. Zheng, X. Peng, et al., J. Power Sources 362 (2017) 0378–7753.
Q. Kang, Y. Li, Z. Zhang, et al., J. Energy Chem. 69 (2022) 194–204. doi: 10.1016/j.jechem.2022.01.008
C. Hu, L. Chen, Y. Hu, et al., Adv. Mater. 33 (2021) 2103558. doi: 10.1002/adma.202103558
Y. Fang, D. Luan, Y. Chen, S. Gao, X.W. Lou, Angew. Chem. Int. Ed. 59 (2020) 7178–7183. doi: 10.1002/anie.201915917
J. Hu, N. Jaegers, M. Hu, K. Mueller, J. Phys. Condens. Mat. 30 (2018) 463001. doi: 10.1088/1361-648X/aae5b8
B. Emilie, R. Florent, Lippens. P. Emmanuel, M. Michel, J. Phys. Chem. C 114 (2011) 6749–6754.
J.E. Frerichs, J. Koppe, S. Engelbert, Chem. Mater. 33 (2021) 3499–3514. doi: 10.1021/acs.chemmater.0c04392
119Sn NMR spectrum, ScienceDirect Topics.
I. Akimisu, N. Takaaki, U. Keisuke, et al., J. Phys. Chem. C 123 (2019) 18150–18159. doi: 10.1021/acs.jpcc.9b02393
W. Müller, Z. Naturforsch. B 29 (2014) 101515.
Y. Zhang, P. Chen, Q. Wang, et al., Adv. Funct. Mater. 11 (2021) 454–460.
H. Kim, J. Cook, H. Lin, Nat. Mater. 16 (2017) 454–460. doi: 10.1038/nmat4810
D. Kurzbach, S. Yao, D. Hinderberger, K. Klinkhammer, Dalton Trans. 39 (2010) 6449–6459. doi: 10.1039/c001144d
J. Li, X. Xu, X. Liu, et al., J. Alloys Compd. 679 (2016) 454–462. doi: 10.1016/j.jallcom.2016.04.080
K.N. Wood, G. Teeter, ACS Appl. Energy Mater. 1 (2018) 4493–4504. doi: 10.1021/acsaem.8b00406
R. Schlem, A. Banik, S. Ohno, E. Suard, W.G. Zeier, Chem. Mater. 33 (2021) 327–337. doi: 10.1021/acs.chemmater.0c04352
M. Tang, A. Dalzini, X. Li, J. Phys. Chem. Lett. 8 (2017) 4009–4016. doi: 10.1021/acs.jpclett.7b01425
M. Sathiya, J. Leriche, E. Salager, et al., Nat. Commun. 6 (2015) 6276. doi: 10.1038/ncomms7276

Figure 1 (a–c) TEM images of SnO2/C/ZrO2. (d, e) High-resolution TEM images of SnO2/C/ZrO2. (f) SEM images, (g) SEM images and element mapping images of SnO2/C/ZrO2.

Figure 2 Electrochemical performance of SnO2/C/ZrO2 electrode for lithium storage. (a) CV curves at a scan rate of 0.1 mV/s. (b) Dis-/charge in the voltage range of 0.01-3.0 V at a current density of 0.1 A/g. (c) Cycling performance of SnO2/C/ZrO2, SnO2/C and SnO2 electrodes at the current density of 0.1 A/g. (d) Rate capacity at various current densities. (e) Initial dis-/charge cycle at 0.1, 0.2, 0.5, 1 and 2 A/g, respectively. (f) Long-term cycling performance at a current density of 1 A/g and the corresponding Coulombic efficiency of SnO2/C/ZrO2 electrode. (g) CV curves at different scan rates. (h) The corresponding plots log(i) versus log(ν) at each redox peak. (i) Contribution ratio of capacitive at various scan rates.

Figure 3 Solid-state (a) 7Li NMR and (b) 6Li NMR spectra for SnO2/C/ZrO2 electrodes at various electrochemical cycling states. Spinning sidebands (SSBs) are noted as asterisks. The cycling curve is plotted to the right.

 扫一扫看文章

扫一扫关注我们
 DownLoad:
 下载:
下载:
