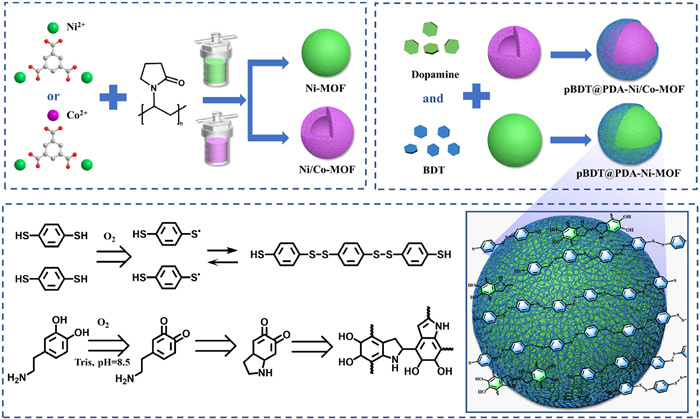
Scheme 1.
Preparation of spherical Ni-MOF, hollow Ni/Co-MOF and copolymer modification.
Synthesis and modification of spherical/hollow metal-organic frameworks for efficient extraction of sulfonamides in aqueous environments
Yongxing Sun , Kaijun Quan , Jia Chen , Hui Li , Xin Li , Zuguang Li , Hongdeng Qiu

High speed development and operation of modern industry and agriculture could not be achieved without the use of synthetic drugs [1-3]. Sulfonamides (SAs) are widely used in livestock and aquaculture due to its stable nature, good antibacterial effect and low price as an antibiotic [4,5]. However, the knowledge of the toxicological nature of SAs, as well as the large-scale contamination that occurred in the past due to long-term abuse, has led to the recognition of their non-negligible negative effects [6,7]. Despite the fact that various countries and regions have established relevant laws and regulations to limit them over time, rigorous monitoring still requires effective detection methods to guarantee it [8].
Several innovative analytical strategies have been reported for the detection of SAs, such as immunoassays, chemosensing, etc. [9-14]. Nevertheless, due to the lack of broad generalizability, high performance liquid chromatography (HPLC) continues to be the primary method of detection in conventional laboratories/analytical institutions [15]. Because of the complexity of the actual sample matrix and the low SAs concentration, appropriate pre-treatment procedures are required to eliminate interferences and enrich trace analytes [16,17]. Compared to the conventional liquid-liquid extraction with tedious steps [18-20], dispersive solid phase extraction, magnetic solid phase extraction and other solid phase extraction derivative techniques are highly sought after owing to their efficiency, simplicity and reliability [21-23].
Excellent sorbent performance was essential in solid phase extraction [24,25]. Metal organic frameworks (MOFs) as crystalline porous materials consisting of metal ions or metal clusters self-assembled with organic complexes via strong coordination interaction, have unique advantages and great potential in adsorption and separation fields due to their extreme structural diversity and designability [26,27]. Over the years, many types of MOFs have been used for the adsorptive extraction of organic pollutants [28-31]. Among them, many MOFs existed adverse adsorption selectivity, slow adsorption rate and poor chemical stability thus limiting their use in pretreatments [32-35].
How can one promote the application of MOFs adsorbents in relative fields? Further modulation to synthesize, and select suitable new MOFs or appropriate functional modifications to enhance existing MOFs are worth considering [36-38]. The morphology and structure of MOFs are affected by many factors. Even when the same metal ions and organic ligands are used, the conditions such as the ratio, reaction solvent and synthesis temperature are changed to synthesize framework materials with different topologies, pore sizes and morphologies [39-42], and their properties are different. Using chemical modifications to increase the functional groups for enhancing the adsorption performance of MOFs is a great strategy, but some previous work indicated this is actually difficult [43]. Chemical modification could destroy the crystalline structure of MOFs very easily, even if the modification successful, the functional group content remains little. In contrast, using polymeric monomers to undergo in-situ polymerization to produce autopolymers is a simple but quite effective modification strategy. Polymer coatings have good stability and resistance to acids and bases, giving materials rich functional groups while also providing some protection [44,45].
In this work, we used nickel ions and trimesic acid as raw materials for preparing MOFs, by adding the surfactant polyvinylpyrrolidone (PvP) in reaction solvent, modulated and synthesized the unique morphological spherical Ni-MOF. By doping cobalt ions in the metal ions, the hollow structure of Ni/Co-MOFs were synthesized. Then, via a mild non-covalent modification strategy, using dopamine and 1, 4-benzenedithiol (BDT) as polymeric monomers, accomplished the functional modification of the above MOFs. The preparation and modification process of spherical/hollow MOFs were shown as Scheme 1. To prove the materials successful preparation, SEM was used to observe the microscopic morphology. The addition of surfactant PvP resulted in the synthesized Ni-MOF have regular spherical shape (Fig. S1a in Supporting information), and were solid, possessed homogeneous size at around 2 µm. Subsequently, the synthesized Ni/Co-MOFs doped with different ratios of cobalt ions were also characterized. As presented in Figs. S1b-f (Supporting information), doping the cobalt ions produced hollow structures, and the outer wall thickness of Ni/Co-MOFs showed a decreasing trend when addition amount increased. When adding too much Co2+, the products obtained are broken and irregularly shaped. And the morphology of the modified pBDT@PDA-Ni-MOF and pBDT@PDA-Ni-MOF was also observed. As shown in SEM (Figs. 1a and b) and TEM (Figs. 1c and d), it can be seen that the obvious polymer coating. The copolymers formed by the self-polymerization of dopamine and BDT uniformly cover the surface of MOFs, indicating that the modification strategy is feasible.
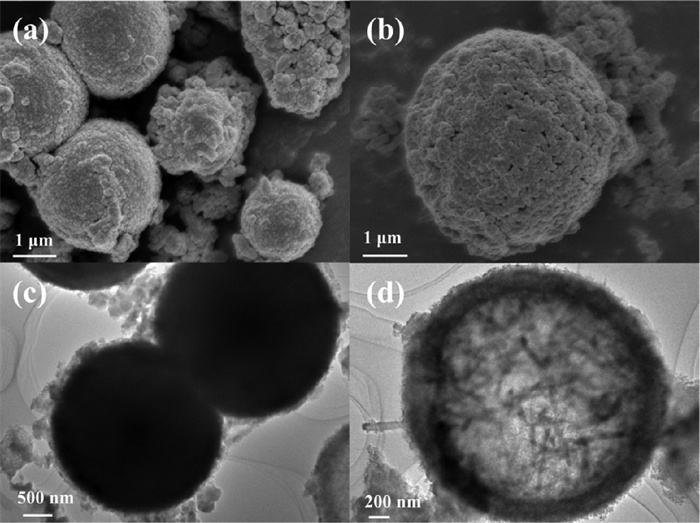
Fig. 2a exhibits the actual images of prepared MOFs, and the color changes significantly comparing before and after modification, but both present fluffy powder-like and with strong electrostatic force. Then, their crystalline phases were analyzed by XRD diffractometer (Fig. 2b). The spherical Ni-MOF possesses distinct diffraction peaks at 9.15°, 12.60°, 16.11°, 25.38°, 28.50°, 32.25°, 36.82° and 42.18°, which have a similar XRD result to other Ni-MOFs formed as described in the literature by nickel ions and trimesic acid [46]. Interestingly, the hollow spherical Ni/Co-MOF also has the same crystal diffraction peak position. And after surface modification of the pBDT@PDA-Ni-MOF and pBDT@PDA-Ni/Co-MOF, they maintain the position of characteristic peaks, but the peak intensity is slightly decreased. It indicates that the polymer modification process indeed did not disrupt the crystalline and structure.

The pBDT@PDA-Ni/Co-MOF was selected for elemental mapping (Fig. S2c in Supporting information) and EDS analysis (Fig. S2e in Supporting information) which shows the characteristic elements of C, N, O, S, Ni, and Co. It indicates that the composite polymers were successfully modified on the surface. Selected area electron diffraction (SAED) analysis was performed for pBDT@PDA-Ni/Co-MOF (Fig. S2d in Supporting information), but the results showed a disk-like scattering circle. Therefore, the unmodified Ni/Co-MOF was characterized by high resolution transmission electron microscopy (HRTEM) and SEAD (Figs. S2a and b in Supporting information) where it can be seen that Ni/Co-MOF possesses clearly delineated lattice stripes. The electron diffraction pattern at this point has spots and ring-like circles, indicating that the synthesized MOFs have regular crystal shapes. This corresponds to the XRD characterization results. The difference in electron diffraction results probably caused by polymer surface modifications.
Fig. 2c showed the FTIR spectra of the four MOFs materials. The absorption peaks at 1715.8 cm−1 and 1375.2 cm−1 are from the C=O, C—O stretching vibrations of the organic ligand (carboxylic acid), 1633.8 cm−1 and 1579.9 cm−1 from the stretching vibrations of the benzene ring backbone, respectively [47,48]. In addition, the modified pBDT@PDA-Ni-MOF and pBDT@PDA-Ni/Co-MOF have distinct C-S vibrational peaks at 1024 cm−1, and characteristic peaks of N—H and weak S-S disulfide bonds were also observed at 3604.8 cm−1 and 532.3 cm−1, respectively. X-ray photoelectron spectra (XPS) was used to further analyze the chemical bonding states, and detailed explanations follow in Supporting information. In particular, the detailed spectrum of nitrogen is shown in Fig. S3f (Supporting information), where the peak at 399.9 eV comes from the formation of pyrrole nitrogen following the polymerization of dopamine. In Fig. S3g (Supporting information), 163.9 eV belongs to the characteristic peak of the thiol/disulfide benzene series, while 165.7 and 167.3 eV belong to the characteristic peaks of partial thiol oxide. The detailed spectra of nitrogen and sulfur reveal that oxidative autopolymerisation of dopamine and BDT occurs indeed.
The surface area, pore volume and pore size are the important parameters of adsorbents, therefore the prepared materials were tested by the Brunauer-Emmet-Teller (BET) method. The N2 adsorption-desorption isotherms are shown in Fig. 2d, and the SBET collected for Ni-MOF was 167.63 m2/g (Table S1 in Supporting information), compared to that of Ni/Co-MOF which was 199.52 m2/g. And their pore volumes were 0.401 cm3/g and 0.449 cm3/g, respectively. The pore size was 9.61 nm and 15.24 nm (Fig. S9 in Supporting information), respectively. The N2 adsorption-desorption curves of Ni-MOF and Ni/Co-MOF can be classified as IV-type isotherms and have H2b-type hysteresis loops, which indicates that the prepared MOFs belong to mesoporous materials and possess wide mesopore distribution. After polymerization modification, the surface area of the MOFs decreased obviously. The SBET of pBDT@PDA-Ni-MOF and pBDT@PDA-Ni/Co-MOF were 68.65 m2/g and 61.35 m2/g, respectively, while the pore volumes were declined to 0.173 cm3/g and 0.244 cm3/g, respectively.
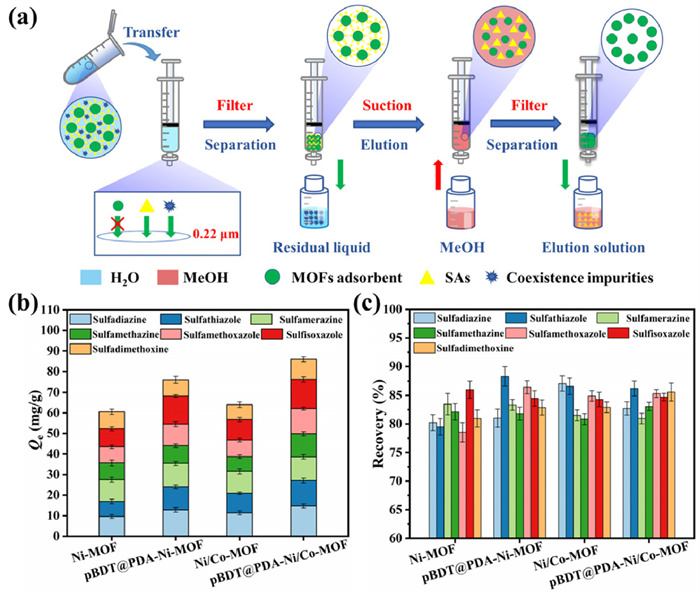
The four synthesized MOFs were investigated for adsorption experiments. First, the adsorption isotherm experiments were performed at different initial concentrations. The equilibrium adsorption amount of SAs in mixed mode are shown in Fig. 3b, the total adsorption is 60.57 mg/g for Ni-MOF, 76.11 mg/g for pBDT@PDA-Ni-MOF, 64.01 mg/g for Ni/Co-MOF and 83.48 mg/g for pBDT@PDA-Ni/Co-MOF, respectively. Compared to unmodified, the modified MOFs both have a greater improvement in adsorption performance on SAs, despite the decrease in their surface area and pore capacity. In particular, pBDT@PDA-Ni/Co-MOF possess the maximum adsorption capacity, and the adsorption amounts of sulfadiazine, sulfathiazole, sulfamerazine, sulfamethazine, sulfamethoxazole, sulfisoxazole and sulfadimethoxine were 14.64, 11.96, 11.15, 10.33, 11.94, 13.35 and 9.79 mg/g, respectively.
The Langmuir and Freundlich models were used to analyze the experimental results for possible adsorption mechanisms. The equations are presented in Supporting information, and the detailed parameters of four MOFs adsorbents are given in Table S3 (Supporting information). Taking pBDT@PDA-Ni/Co-MOF as an example, Fig. S4a (Supporting information) shows the equilibrium adsorption of seven sulfonamide mixes at concentrations of 1, 2.5, 5, 10, 20, 25, 50, 75 and 100 mg/L. Figs. S4b and c (Supporting information) show the linear Langmuir and Freundlich fitting results, respectively. In Table S3, n values for all seven SAs in Freundlich are above 2, indicating that pBDT@PDA-Ni/Co-MOF is prone to adsorption of SAs. The theoretical saturation maximum adsorption capacities Qm (mg/g) for sulfadiazine, sulfathiazole, sulfamerazine, sulfamethazine, sulfamethoxazole, sulfisoxazole and sulfadimethoxine were calculated according to the Langmuir model as 15.01, 12.49, 11.60, 11.44, 12.17, 14.24 and 10.03 mg/g, which is close to the experimental values. Compared the correlation linearity of the two models, the Freundlich correlation coefficient R2 ranged from 0.884 to 0.950, while the langmuir correlation coefficient R2 was 0.982–0.998. In comparison, the latter matched the equilibrium adsorption results better. It means that the adsorption process conforms to the monolayer adsorption hypothesis more.
In order to further explore the mechanism and possible steps of rate control in the adsorption process, pBDT@PDA-Ni/Co-MOF was selected to investigate the adsorption kinetics of mixed samples of SAs at 50 mg/L initial concentration. Fig. S4d (Supporting information) shows the SAs adsorption capacity Qt (mg/g) in relation to time, where the seven SAs were rapidly adsorbed in the shortest time, and the adsorption equilibrium started to be gradually satiated around 15 min. Figs. S4e and f (Supporting information) shows fit results for the linear pseudo-first-order and pseudo-second-order kinetic models respectively, with the relevant parameters pooled in Table S4 (Supporting information). The pseudo-first order linear R2 for sulfadiazine, sulfathiazole, sulfamerazine, sulfamethazine, sulfamethoxazole, sulfisoxazole and sulfadime-thoxine were 0.750, 0.960, 0.876, 0.905, 0.925, 0.972, and 0.945, respectively, and the calculated equilibrium adsorption capacity Qe (cal) deviated significantly from the experimental value Qe (exp). The pseudo-secondary kinetics R2 were 0.995, 0.998, 0.999, 0.998, 0.998, 0.996, and 0.998, respectively, Qe (cal) with Qe (exp) essentially matching. It means that the adsorption rate is influenced by chemisorption, and the adsorption process is influenced by two or more factors together. In addition, using the in-particle diffusion model to explore SAs diffusion processes in adsorption kinetics (Fig. S5 in Supporting information). It was seen that the adsorption process exhibits three-stage rates and the intercept did not pass through the origin, which indicates that other adsorption mechanisms are accompanying the process except for internal diffusion [49].
The adsorption performance of the materials shown in the adsorption tests indicates that they can be employed as sorbents for extracting SAs. Benefiting from the regular morphology and large micron-sized particle size of the prepared MOFs materials, they can be used for the extraction of SAs contaminants by building simple filtration devices without the need for a tedious centrifugation step. The syringe-assisted dispersive solid phase extraction (S-DSPE) procedure shown as Fig. 3a, and the details can be obtained in Supporting information. The extraction performance of the prepared MOFs was investigated at 50 µg/L of SAs mixed sample. Fig. 3c demonstrates that Ni-MOF, Ni/Co-MOF, pBDT@PDA-Ni-MOF, and pBDT@PDA-Ni/Co-MOF all showed comparable extraction recoveries for low concentration of SAs. Considering the pBDT@PDA-Ni/Co-MOF possesses the largest sorption capacity, which was used for the subsequent extraction experiments.
The extraction recoveries are affected by many factors. In order to obtain optimal extraction results, a series of parameters need to be further optimized. At a fixed solution volume of 5 mL, the series optimization is as shown in Figs. S6a-f (Supporting information). The optimum extraction conditions were 5 mg of sorbent, 15 min of extraction time, pH 6, zero salt concentration, methanol as desorbent and 5 min desorption time. In addition, the recyclability of the used adsorbents was examined. Fig. S7 (Supporting information) shows the repeat recovery efficiency of pBDT@PDA-Ni/Co-MOF for 50 µg/L of SAs. It was noted that the recovery of SAs after the third use showed a relatively significant decline, which was probably caused by insufficient desorption of the SAs during frequent use. Yet, the recovery rate of around 75% was still maintained at five cycles, indicating that the prepared material is moderately reusable.
The performance of the method was evaluated by examining the methodological parameters such as limit of detection (LOD), limit of quantification (LOQ) and linear range of S-DSPE method after condition optimization. The results are shown in Table S5 (Supporting information). A good linearity of S-DSPE method was obtained for SAs in the concentration range of 1.4–200 µg/L with the correlation linear squared value R2 > 0.9993. The LOD was 0.4–0.5 µg/L and the LOQ was 1.0–1.4 µg/L, which could satisfy the detection of trace SAs. In addition, the enrichment factor (EF) values between 19.3 and 23.6 (the theoretical maximum EF of 25 in the case of fixed solution volume), the enrichment recovery (ER) ranged from 77.3% to 92.6%, the relative standard deviations (RSD) of intraday ranged from 0.83% to 4.79% and interday are ranged from 2.64% to 9.55%.
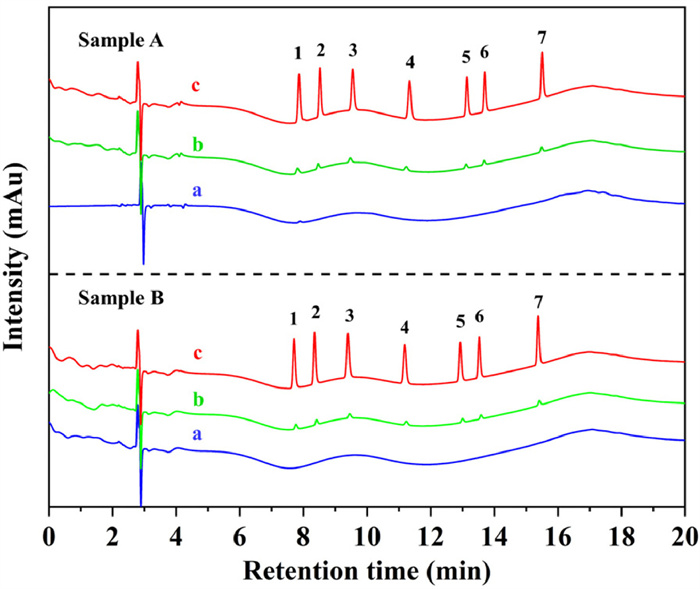
In order to verify the applicability of S-DSPE method, we collected the river shrimp rearing water from local aquatic market and supermarket to analyze the potential existence of SAs, and the chromatograms are shown in Fig. 4. After adsorption extraction with pBDT@PDA-Ni/Co-MOF, sulfadiazine was detected in water sample A, but too low to be quantified, while no SAs were detected in water sample B. To ensure accuracy, the water samples were further spiked with 5, 20 and 50 µg/L SAs. The results are shown in Table S6 (Supporting information). The enrichment extraction recovery ranged from 79.4% to 91.3%, and the RSD < 5.3%, which indicated that the developed S-DSPE method is capable of monitoring trace SAs in real samples. Comparing with some reported methods (Table S7 in Supporting information), the established S-SDPE extraction method is simple and efficient. The quantitative detection of SAs at low concentrations can be satisfied with a tiny amount of MOFs sorbent. Except for LC-MS/MS, compared to other HPLC-UV/DAD methods, the S-DSPE showed a satisfactory LOD and LOQ.
In this study, the adsorption experiments and extraction condition optimization experiments indicated that several adsorption interactions existed between the prepared MOFs sorbents and sulfonamides. The strong electron-donating group amino is directly linked to the benzene ring in the seven SAs structures, which cause the lone-pair electrons of N in -NH2 to have strong conjugation effects with π-electrons on aromatic rings, making them strong electron donors. FTIR, XPS characterization results indicated that the synthesized Ni-MOF and Ni/Co-MOF continued the carbonyl and benzene ring structures of the organic ligands. The carbonyl group of the strong electron-withdrawing group is directly linked to the benzene ring, exhibiting an electron-withdrawing conjugation effect. It is indicated that there can exist π-π electron donor-acceptor interactions (π-π EDA) between SAs and MOFs. And the similar electron-withdrawing conjugation effect between the sulfur and the benzene ring exists in the composite copolymers, making the modified MOFs materials show enhanced adsorption properties for SAs.
During the extraction optimization, SAs showed the optimal recovery results at pH 6. The SAs' physicochemical properties are listed in Table S2 (Supporting information), and they possess two ionization equilibrium constants (i.e., pKa value) in the range of pH 1.39–2.79 and pH 6.2–8.81. At pH 6, Most of the SAs in solution are still mainly in the form of neutral molecules. After polymer modification, MOFs have additional amino and hydroxyl functional groups on the surface as hydrogen bond donors or acceptors, which can further enhance the adsorption effect by hydrogen bonding with SAs. At this time, a portion of the SAs are also ionized and exist as cations in solution. As shown in Fig. S8 (Supporting information), the surface zeta potential of the adsorbents including pBDT@PDA-Ni/Co-MOF were tested at different pHs. At pH < 3, the adsorbents have positive zeta potential, and as the solution pH increases, the adsorbent surface turns to negative charge. Polymer modification can slow down the change in surface zeta, but the general trend remains the same. Hence, at pH 6, the MOFs materials are all negatively charged and can interact electrostatically with SAs to promote adsorption.
In summary, we synthesized spherical Ni-MOF and hollow Ni/Co-MOF with unique morphology by adding surfactants and additional doped cobalt ions, which are capable of efficient and rapid adsorption of SAs based on π-π EDA, electrostatic interactions etc. In addition, based on the non-covalent surface polymerization modification strategy, dopamine and BDT were used as self-polymerizing monomers to introduce abundant functional groups, which further enhanced the adsorption ability of MOFs to SAs. And finally, benefited the MOFs regular morphology and size, they can be used as sorbents to develop a simple and efficient S-DSPE extraction method, the optimized method parameters satisfy the detection of potential trace SAs in water environment.
The authors report no declarations of interest.
The work was supported by the National Key R&D Program of China (No. 2019YFC1905501), the National Natural Science Foundation of China (Nos. 22104145 and 22174129), Nature Science Foundation of Zhejiang Province (No. LZY21E030001), Natural Science Foundation of Gansu Province (No. 21JR7RA078), Youth Collaborative Innovation Alliance Fund of LICP (No. HZJJ21–06) and the "Light of West China" Program from Chinese Academy of Science.
Supplementary material associated with this article can be found, in the online version, at doi:
L. Chen, C. Guo, Z. Sun, et al., Environ. Res. 200 (2021) 111362. doi: 10.1016/j.envres.2021.111362
Y. Zhao, Q.E. Yang, X. Zhou, et al., Crit. Rev. Env. Sci. Tec. 51 (2020) 2159–2196.
P. Kovalakova, L. Cizmas, T.J. McDonald, et al., Chemosphere 251 (2020) 126351. doi: 10.1016/j.chemosphere.2020.126351
W. Duan, H. Cui, X. Jia, et al., Sci. Total. Environ. 820 (2022) 153178. doi: 10.1016/j.scitotenv.2022.153178
W. Jansomboon, S.K. Boontanon, N. Boontanon, et al., Food Chem. 212 (2016) 635–640. doi: 10.1016/j.foodchem.2016.06.026
J.L. Martinez, Environ. Pollut. 157 (2009) 2893–2902. doi: 10.1016/j.envpol.2009.05.051
Z. Li, M. Li, Z. Zhang, et al., Ecotox. Environ. Safe. 199 (2020) 110668. doi: 10.1016/j.ecoenv.2020.110668
S. Charitonos, V.F. Samanidou, I. Papadoyannis, Food Anal. Method 10 (2016) 2011–2017.
B. Fang, S. Hu, C. Wang, et al., Food Control 98 (2019) 268–273. doi: 10.1016/j.foodcont.2018.11.039
Z. Liu, Y. Zhang, J. Feng, et al., Sensors Actuat. B: Chem. 287 (2019) 551–556. doi: 10.1016/j.snb.2019.02.079
Z. Yu, L. Huang, Z. Zhang, et al., Chin. Chem. Lett. 33 (2022) 3853–3858. doi: 10.1016/j.cclet.2021.10.045
N. Orachorn, O. Bunkoed, Talanta 228 (2021) 122237. doi: 10.1016/j.talanta.2021.122237
A.G. Ayankojo, A. Tretjakov, J. Reut, et al., Anal. Chem. 88 (2016) 1476–1484. doi: 10.1021/acs.analchem.5b04735
M. Yang, X. Wu, X. Hu, et al., Biosens. Bioelectron. 144 (2019) 111643. doi: 10.1016/j.bios.2019.111643
Y. Wang, J. Chen, M. Guan, et al., Langmuir 37 (2021) 12242–12253. doi: 10.1021/acs.langmuir.1c02275
J. Ma, Y. Cui, A. Li, et al., Sep. Purif. Technol. 279 (2021) 119599. doi: 10.1016/j.seppur.2021.119599
Y. Zhang, G. Li, D. Wu, et al., TrAC Trends Anal. Chem. 121 (2019) 115669. doi: 10.1016/j.trac.2019.115669
M.C. Ali, J. Chen, H. Zhang, et al., Talanta 203 (2019) 16–22. doi: 10.1016/j.talanta.2019.05.012
W. Yu, K. Li, Z. Liu, et al., Microchem. J. 136 (2018) 263–269. doi: 10.1016/j.microc.2017.03.053
X. Li, Q. Li, A. Xue, et al., Anal. Methods 8 (2016) 517–525. doi: 10.1039/C5AY02619A
Y. Wang, J. Wang, M. Guan, et al., Anal. Chim. Acta 1203 (2022) 339698. doi: 10.1016/j.aca.2022.339698
X. Zhang, Y. Yang, P. Qin, et al., Chin. Chem. Lett. 33 (2022) 903–906. doi: 10.1016/j.cclet.2021.07.003
X. Han, J. Chen, Z. Li, et al., Anal. Chim. Acta 1078 (2019) 78–89. doi: 10.1016/j.aca.2019.06.022
T. Zhou, G. Che, L. Ding, et al., TrAC Trends Anal. Chem. 121 (2019) 115678. doi: 10.1016/j.trac.2019.115678
Y. Wang, J. Chen, H. Ihara, et al., TrAC Trends Anal. Chem. 143 (2021) 116421. doi: 10.1016/j.trac.2021.116421
M. Bazargan, F. Ghaemi, A. Amiri, et al., Coordin. Chem. Rev. 445 (2021) 214107. doi: 10.1016/j.ccr.2021.214107
A. Kirchon, L. Feng, H.F. Drake, et al., Chem. Soc. Rev. 47 (2018) 8611–8638. doi: 10.1039/c8cs00688a
Y. Sun, H.C. Zhou, Sci. Technol. Adv. Mater. 16 (2015) 054202. doi: 10.1088/1468-6996/16/5/054202
X.D. Du, C.C. Wang, J.G. Liu, et al., J. Colloid Interface Sci. 506 (2017) 437–441. doi: 10.1016/j.jcis.2017.07.073
L. Han, X. Liu, X. Zhang, et al., J. Hazard. Mater. 424 (2022) 127559. doi: 10.1016/j.jhazmat.2021.127559
Y. Peng, Y. Zhang, H. Huang, et al., Chem. Eng. J. 333 (2018) 678–685. doi: 10.1016/j.cej.2017.09.138
B. Hashemi, P. Zohrabi, N. Raza, et al., TrAC Trends Anal. Chem. 97 (2017) 65–82. doi: 10.1016/j.trac.2017.08.015
R.E. Morris, L. Brammer, Chem. Soc. Rev. 46 (2017) 5444–5462. doi: 10.1039/C7CS00187H
F.M. Zhang, H. Dong, X. Zhang, et al., ACS Appl. Mater. Interfaces 9 (2017) 27332–27337. doi: 10.1021/acsami.7b08451
K. Suresh, A.J. Matzger, Angew. Chem. Int. Ed. 58 (2019) 16790–16794. doi: 10.1002/anie.201907652
Q. Yao, A. Bermejo Gómez, J. Su, et al., Chem. Mater. 27 (2015) 5332–5339. doi: 10.1021/acs.chemmater.5b01711
M. Kalaj, K.C. Bentz, S. Ayala, Jr., et al., Chem. Rev. 120 (2020) 8267–8302. doi: 10.1021/acs.chemrev.9b00575
M. Ding, X. Cai, H.L. Jiang, Chem. Sci. 10 (2019) 10209–10230. doi: 10.1039/c9sc03916c
X.M. Cheng, X.Y. Dao, S.Q. Wang, et al., ACS Catal. 11 (2020) 650–658.
X.M. Cheng, X.Y. Zhang, X.Y. Dao, et al., Chem. Eng. J. 431 (2022) 134125. doi: 10.1016/j.cej.2021.134125
Y. Yu, A. Qiao, A.M. Bumstead, et al., Cryst. Growth. Des. 20 (2020) 6528–6534. doi: 10.1021/acs.cgd.0c00740
F. Guo, J.H. Guo, P. Wang, et al., Chem. Sci. 10 (2019) 4834–4838. doi: 10.1039/c8sc05060k
C. Liu, K. Quan, H. Li, et al., Chem. Commun. 58 (2022) 13111. doi: 10.1039/d2cc05149d
C. Fan, K. Quan, J. Chen, et al., J. Chromatogr. A 1661 (2022) 462690. doi: 10.1016/j.chroma.2021.462690
C. Fan, J. Chen, H. Li, et al., J. Chromatogr. A 1667 (2022) 462912. doi: 10.1016/j.chroma.2022.462912
X. Zhang, N. Qu, S. Yang, et al., Mater. Chem. Front. 5 (2021) 482–491. doi: 10.1039/D0QM00597E
L. Liang, J. Chen, X. Chen, et al., Environ. Sci. : Nano 9 (2022) 554–567. doi: 10.1039/d1en01015h
Y. Zhou, M.Z. Cai, X.J. Shu, et al., Chem. Eng. J. 435 (2022) 134876. doi: 10.1016/j.cej.2022.134876
M. Danish, K.B. Ansari, M. Danish, et al., Sep. Purif. Technol. 292 (2022) 120996. doi: 10.1016/j.seppur.2022.120996

Scheme 1 Preparation of spherical Ni-MOF, hollow Ni/Co-MOF and copolymer modification.

Figure 1 SEM of (a) pBDT@PDA-Ni-MOF and (b) pBDT@ PDA-Ni/Co-MOF. TEM of (c) pBDT@PDA-Ni-MOF and (d) pBDT@ PDA-Ni/Co-MOF.

Figure 2 (a) Actual images of synthetic materials. (b) XRD patterns, (c) FT-IR spectra, and (d) N2 adsorption-desorption isotherms of Ni-MOF, Ni/Co-MOF, pBDT@PDA-Ni-MOF and pBDT@PDA-Ni/Co-MOF.

Figure 3 (a) S-DSPE procedures. (b) The total sorption of four MOFs in mixed sorption experiment, and (c) the enrichment recoveries of 50 µg/L SAs mixed samples in extraction of four MOFs.

Figure 4 Determinations of seven sulfonamides in river shrimp rearing water from (A) aquatic market and (B) supermarket. a: not spiked, b: spiked 20 µg/L, c: 20 µg/L chromatogram after enrichment. Peaks: (1) sulfadiazine, (2) sulfathiazole, (3) sulfamerazine, (4) sulfamthazine, (5) sulfamethoxazole, (6) sulfisoxazole, and (7) sulfadimethoxine.

 扫一扫看文章

扫一扫关注我们
 DownLoad:
 下载:
下载: