Citation:
Jiaying Wang, Jiejie Wang, Sijin Zuo, Jianchuan Pei, Weiping Liu, Juan Wang. Cooperative coupling of photocatalytic production of H2O2 and oxidation of organic pollutants over gadolinium ion doped WO3 nanocomposite[J]. Chinese Chemical Letters,
2023, 34(9): 108157.
doi:
10.1016/j.cclet.2023.108157
Cooperative coupling of photocatalytic production of H2O2 and oxidation of organic pollutants over gadolinium ion doped WO3 nanocomposite
English
Cooperative coupling of photocatalytic production of H2O2 and oxidation of organic pollutants over gadolinium ion doped WO3 nanocomposite
Institute of Environmental Health, MOE Key Laboratory of Environmental Remediation and Ecosystem Health, College of Environment and Resources Science, Zhejiang University, Hangzhou 310058, China
b.
College of Environment and Resources, Zhejiang A&F University, Hangzhou 311300, China
wjuan@zju.edu.cn (J. Wang). 1 These authors contributed equally to this work.
Received Date:
11 September 2022 Accepted Date:
19 January 2023 Revised Date:
07 January 2023 Available Online:
15 September 2023
Abstract:
This work reported the lanthanide ion (Gd3+) doped tungsten trioxide (Gd-WO3) nanocrystal for remarkable promoted photocatalytic degradation of organic pollutants and simultaneous in-situ H2O2 production. With doped lanthanide ion (Gd3+), Gd-WO3 showed a much broad and enhanced solar light absorption, which not only promoted the photocatalytic degradation efficiency of organic compounds, but also provided a suitable bandgap for direct reduction of oxygen to H2O2. Additionally, the isolated Gd3+ on WO3 surface can efficiently weaken the *OOH binding energy, increasing the activity and selectivity of direct reduction of oxygen to H2O2, with a rate of 0.58 mmol L−1 g−1 h−1. The in-situ generated H2O2 can be subsequently converted to •OH based on Fenton reaction, further contributed to the overall removal of organic pollutants. Our results demonstrate a cascade photocatalytic oxidation-Fenton reaction which can efficiently utilize photo-generated electrons and holes for organic pollutants treatment.
Photocatalytic oxidation of organic pollutants has been widely explored for organic pollutants remediation, due to its sustainable and environmental benign property driven by solar energy. Up till now, there have been tremendous reports on raising the photocatalytic efficiency, e.g., broadening the solar absorption range, suppressing the photogenerated electron-hole (e−-h+) recombination rate, as well as boosting charge carrier mobility [1-4]. During a typical photocatalytic oxidation reaction, the photogenerated holes with oxidation capability can either directly oxidize organic compounds or react with water to produce other oxidative active substances (e.g., hydroxyl radicals, •OH) [1,5], while the photogenerated electrons with reduction capability cannot be used to oxidize pollutants directly, unless via reacting with dissolved oxygen to produce oxidative superoxide anion radicals (O2•−) [6]. However, as •OH normally owns a relative higher redox potential (E0(•OH/H2O) = 2.38 V vs. NHE, pH 0) than O2•− (E0(O2•−/H2O2) = 1.72 V vs. NHE, pH 0) [7,8], therefore, utilizing electrons to produce more •OH instead of O2•− may present a higher oxidation capability for removal of organic pollutants.
Hydrogen peroxide (H2O2) based Fenton reaction has demonstrated its excellent efficiency in various applications as well as organic pollutants treatment, benefiting from the efficient activation of H2O2 to •OH [9-11]. However, for the traditional H2O2 based Fenton reaction, the required regular supplement of H2O2 demands additional cost for fabrication, transport and storage of the liquid dangerous concentrated H2O2 [12,13]. Recently, photocatalytic generation of H2O2 has been developed as a sustainably alternative fabrication technique for H2O2 [14-17], in comparison with the traditional anthraquinone method [18,19]. Based on above consideration, a photocatalytic process whose photogenerated holes can be fully used to oxidize organic pollutants, and the corresponding electrons can reduce oxygen to form H2O2in situ, may be desirable for efficient use of photogenerated electrons and holes for the photocatalytic degradation of organic pollutants.
Here in this work, we reported a Gd3+ doped WO3 composite photocatalyst (Gd-WO3), which exhibited not only excellent photocatalytic oxidation activity towards organic pollutants, but also simultaneously efficient photogeneration efficiency of H2O2in situ. The Gd-WO3 possessed a broader absorption spectrum (towards near-infrared range) of solar light and an increased photocurrent intensity up to six folds higher than pure WO3. The band gap structure analysis of Gd-WO3 unveiled its suitable band structure for direct reduction of oxygen to H2O2, instead of generating O2•−, which was also supported by electron spin resonance (ESR) analysis. Density functional theory (DFT) calculation confirmed that the dispersed Gd atoms on WO3 could weaken the *OOH binding energy on the surface, favoring the two electrons reduction of oxygen to H2O2, with an efficient H2O2 production rate of 0.58 mmol L−1 g−1 h−1 in tetracycline solution without other sacrificial agents. The in-situ generated H2O2 could be subsequently converted to •OH, further contributed to the overall removal of tetracycline. Therefore, the Gd-WO3 photocatalyst demonstrates a design strategy for fully utilization of photogenerated electrons and holes for photocatalytic oxidation of organic pollutants.
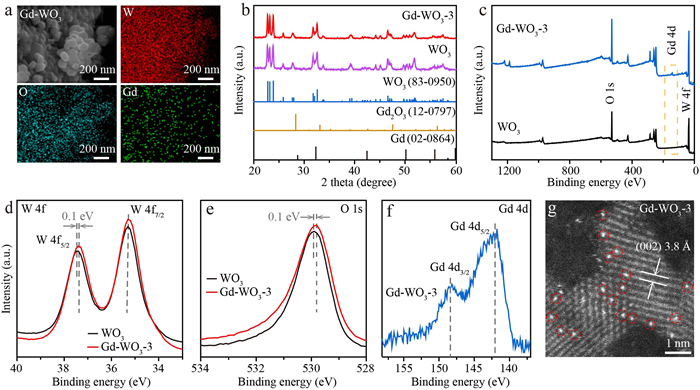
The Gd3+ doped WO3 (Gd-WO3) composite photocatalyst was prepared via simply mixing commercial WO3 nanocrystals with GdCl3 in ethanol solution and stirring the mixture at 70 ℃ for 2 h The Gd ions doping ratio was tuned via adding controlled GdCl3 amount into the precursor mixture, the obtained composites were named as Gd-WO3–1 to 4 (see Supporting information for experiment details). Low-resolution transmission electron microscopy (TEM) images of the as-prepared composites in Fig. S2 (Supporting information) unveiled the similar morphologies of composites Gd-WO3–1 to 4, while additional small particles could be observed in Gd-WO3–4, suggesting a crystal phase separation in Gd-WO3–4. The low-resolution scanning electron microscopy (SEM) image and corresponding element mappings in Fig. 1a clearly presented the uniform dispersed W, O and Gd elements, which suggested the homogeneous doping of Gd ions on WO3 substrate. X-ray diffraction (XRD) analysis results were presented in Fig. 1b and Fig. S3 (Supporting information), which indicated that with the Gd ions amount increased, there were only diffraction peaks related to monoclinic WO3 appeared (JCPDS #83–0950) for samples Gd-WO3–1 to 3, while Gd-WO3–4 presented additional existence of Gd crystals (JCPDS #02–0864), supporting the observed phase separation from low-resolution TEM images in Fig. S2.
Figure 1
Figure 1.
(a) Low-resolution SEM image and the corresponding element mappings of Gd-WO3–3. (b) The XRD patterns of WO3 and Gd-WO3. (c) The total survey XPS spectra of WO3 and Gd-WO3–3. (d-f) The respective W 4f, O 1s and Gd 4d XPS spectra of WO3 and Gd-WO3–3. (g) The HAADF-STEM image of Gd-WO3–3.
Composite Gd-WO3–3 was used for further experiment. Inductively coupled plasma mass spectrometry (ICP-MS) measurement confirmed the Gd content of Gd-WO3–3 was approximately 5.1 wt% (Table S1 in Supporting information). In order to obtain the surface chemical states of Gd, W and O elements, X-ray photoelectron spectra (XPS) characterization was performed on pure WO3 and Gd-WO3–3. The wide survey scan of the two samples in Fig. 1c clearly indicated the existence of W and O in both composites, while Gd-WO3 also presented the existence of Gd element, further confirming the successful doping of Gd ions. The narrow scan of W 4f towards both samples exhibited the first doublet peaks at 35.3 and 37.5 eV (Fig. 1d, Figs. S4 and S5 in Supporting information) assigned to W6+ W 4f7/2 and 4f5/2, and the second doublet peaks at 34.2 and 36.4 eV correspond to W5+ 4f7/2 and 4f5/2, respectively [20]. The similar fitting results for WO3 and Gd-WO3 declared that the valence state of W was not altered by Gd element doping. For the O 1s peak (Fig. 1e), both samples showed strong peaks at binding energy near 530 eV, corresponding with the oxygen binding energy in WO3 [21,22]. The slight shift in W 4f and O 1s binding energy upon doping of Gd ions may be attributable to the strong electronic interaction [22,23]. Furthermore, the Gd 4d spectrum presented on Fig. 1f showed peaks near 148 and 142 eV, matching well with the 4d3/2 and 4d5/2 binding energies for Gd3+ in Gd2O3 respectively, implicating that Gd atom in Gd-WO3 might exist as Gd-O bond [24]. Observation of the Gd-O bond also helped to prove the successful doping of Gd ions in WO3 lattice under mild preparation process.
High-angle annular dark-field scanning transmission electron microscopy (HAADF-STEM) image of Gd-WO3–3 was taken and presented in Fig. 1g. The interplanar distance of 3.8 Å was well-indexed with the (002) plane of monoclinic WO3. Additionally, many separate and brighter dots could be observed (as highlighted by red circles), which were attributed to Gd atoms. Moreover, it clearly revealed that the Gd atoms were exactly immobilized at position of W, implying that Gd atoms perfectly anchored on W vacancies by substitution rather than interstitial doping [21].
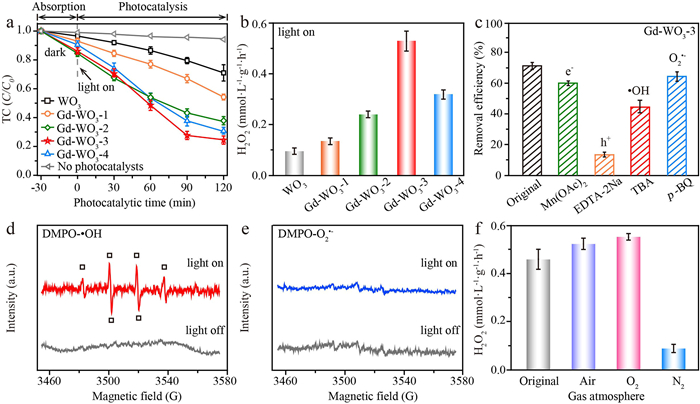
The photocatalytic activities of the WO3 and series Gd-WO3 photocatalysts were next investigated via measuring their degradation efficiency of tetracycline under simulated solar light (1 kW/m2). Tetracycline (TC) was selected as the target compound since it was one of the representative antibiotics, which could be widely detected and hardly degraded under natural force [25]. As presented by Fig. 2a, without the addition of any catalysts, tetracycline concentration did not show obvious change under irradiation. With the presence of Gd-WO3–1 to 4, the tetracycline degradation rate constants (k) were 5.2 × 10⁻³, 8.7 × 10⁻³, 12.3 × 10⁻³ and 9.7 × 10⁻³ min−1, respectively (Fig. 2a and Table S5 in Supporting information). The tetracycline degradation efficiency enhanced from Gd-WO3–1 to 3, but decreased at the presence of Gd-WO3–4. The decreased catalytic efficiency of Gd-WO3–4 might due to the formation of separated Gd particles in Gd-WO3–4, as we mentioned above in Figs. S2 and S3.
Figure 2
Figure 2.
(a) Photocatalytic degradation curves of tetracycline over WO3 and series Gd-WO3 photocatalysts under dark adsorption equilibrium and simulated solar light irradiation (1 kW/m2). (b) The detected photocatalytic production of H2O2 in the presence of tetracycline under simulated solar light irradiation (1 kW/m2). (c) Effects of various quenching agents on tetracycline degradation with Gd-WO3–3. (d) ESR spectra of DMPO-•OH adduct and (e) DMPO-O2•− adduct with Gd-WO3–3 under irradiation. (f) The detected photocatalytic production of H2O2 with Gd-WO3, under purging the solution with different gas bubbles.
Apart from the photocatalytic degradation of tetracycline, simultaneous photocatalytic generation of H2O2 was also detected in our system (Fig. 2b and Fig. S8 in Supporting information). As shown in Fig. 2b, the series photocatalysts showed similar activity trend towards H2O2 generation in comparison with tetracycline removal, and Gd-WO3–3 presented the highest H2O2 production yield at 0.58 mmol L−1 g−1 h−1 under simulated solar irradiation (1 kW/m2) just using tetracycline as the sacrificial agent. Therefore, based on above phenomenon, we can find out that Gd-WO3–3 presents the highest photocatalytic activity for both degradation of tetracycline and production of H2O2.
To investigate mechanism for the photocatalytic reactions, the active species involved in the reactions were first analyzed with Gd-WO3–3. Tertiary butanol (TBA), p-benzoquinone (p-BQ), Mn(OAc)2 and ethylene diamine tetra-acetic acid (EDTA-2Na), which were widely used as scavengers for •OH, O2•−, e− and h+, were added into the reactions respectively [23,26,27]. As shown by Fig. 2c, EDTA-2Na significantly inhibited the degradation of tetracycline, suggesting that oxidation of tetracycline by h+ might contribute dominantly to the removal of tetracycline. Quenching of •OH with TBA supressed the reaction in a certain degree, which indicated that •OH also participated in the reaction. In contrast, Mn(OAc)2 and p-BQ didn't cause any obvious change on the degradation efficiency, which indicated that e− and O2•− might not contribute obviously to the photocatalytic oxidation reaction. A further ESR analysis (Figs. 2d and e) unveiled the presence of •OH but the absence of O2•− in the photocatalytic reaction, which matched well with the above analysis. Therefore, we can propose that there are two main routes for the photocatalytic degradation of tetracycline. One is the direct oxidation of tetracycline by h+, and the other is the oxidation of H2O by h+ to produce •OH, followed by the oxidation of tetracycline by •OH [1].
To identify the generation route of H2O2, we bubbled the reaction system with different gasses (Fig. 2f). Obviously, bubbling of compressed air or O2 into the reaction solution both resulted in an increased H2O2 concentration, while replacing the dissolved O2 with N2 supressed the generation of H2O2 greatly. This phenomenon demonstrates that H2O2 may mainly form from the electron reduction of oxygen [28,29].
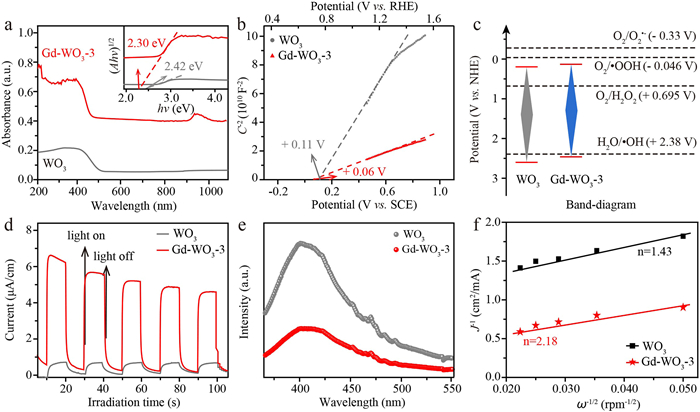
Optical and electrochemical characterizations of WO3 and Gd-WO3–3 were conducted next. As shown by the diffuse reflection spectra in Fig. 3a, Gd-WO3 presented a much-enhanced light absorption capability towards light range of 200~1100 nm, which suggested a narrower band gap around 2.30 eV in comparison with WO3 (2.42 eV), calculating from the plot of the Kubelka-Munk function [30]. Taking together with the Mott-Schottky plots in Fig. 3b, that the respective calculated flat potentials of Gd-WO3 and WO3 were roughly +0.06 and +0.11 V, versus the saturated calomel electrode (SCE), which were equivalent to +0.71, +0.76 V versus the reversible hydrogen electron (RHE) [31]. Generally, the flat potentials of n type semiconductors are about 0.1 V lower than conduction bands, which depends on the electron effective mass and carrier concentration [32,33]. Therefore, the conduction band (CB) potentials of Gd-WO3 and WO3 can be identified to be +0.61 and +0.66 V vs. RHE, respectively. The corresponding energy level diagram is plotted and presents in Fig. 3c [7]. It can be seen that, both WO3 and Gd-WO3 satisfy the reduction of O2 to H2O2 and oxidation of H2O to •OH.
Figure 3
Figure 3.
(a) UV–vis-NIR diffuse reflectance spectra of WO3 and Gd-WO3–3. The inset are plots of (Ahν)1/2versus hν. (b) Mott-Schottky plots of WO3 and Gd-WO3–3. (c) Energy level diagrams of WO3 and Gd-WO3–3. (d) The detected photocurrent response curves of WO3 and Gd-WO3–3, with or without one solar irradiation (1 kW/m2). (e) PL spectra of WO3 and Gd-WO3–3. (f) Koutecky-Levich plots of the data obtained at the constant electrode potential (−0.35 V vs. RHE) for WO3 and Gd-WO3–3.
The photocurrent measurement on Fig. 3d unveiled the greatly enhanced photocurrent intensity of Gd-WO3 than WO3, with approximately six folds. This phenomenon suggests the effectively improved separation and transfer of e−-h+ pairs on Gd-WO3 [34]. The photoluminescence emission intensity measurement of Gd-WO3 and WO3 in Fig. 3e also manifested this phenomenon. Taking together the above analysis, we can conclude that doping of Gd ions into WO3 not only can improve light absorption capacity, but also effectively enhances the separation/transfer of electron-hole pairs, which both contributes to the much-enhanced degradation efficiency of tetracycline. The significantly improved separation/transfer of electron-hole pairs might be attributed by the unique 4f half-filled orbital configuration of Gd3+ ion. As reported, the half-filled 4f orbital electronic configuration is of high stability. Once Gd3+ ions trap electrons, the trapped electrons will be transferred to the surface molecules quickly, while Gd3+ ions return to the original stable half-filled electronic structure [35,36]. Thus, the separation/transfer of e−-h+ pairs is promoted with Gd3+.
To deeper investigate the mechanism for H2O2 generation, rotating disk electrode (RDE) analysis of the two composites (Fig. S9 in Supporting information) and corresponding Koutecky-Levich plots were conducted and presented in Fig. 3f [37,38]. Obviously, the average number of electrons (n) value involved for photocatalytic H2O2 generation with WO3 as catalyst is 1.43, while system with Gd-WO3 exhibits a n value of 2.18, suggesting that one-step two-electron reduction of O2 to form H2O2 is preferred in this photocatalytic Gd-WO3–3 system. Besides, the selective electron transfer to O2 is also investigated by using a rotating ring-disk electrode (RRDE). The selectivity of H2O2 production was obtained in the O2-saturated electrolyte by measuring both the reduction current of O2 at the disk part of RRDE (ID) and the oxidation current of the produced H2O2 on the Pt ring part (IR) [39-41]. The Gd-WO3 exhibited relatively higher ring current than WO3 (Fig. S10a in Supporting information), which indicated that Gd-WO3 generated a higher yield of H2O2 (66%) than WO3 (49%) in the same potential range (Fig. S10b in Supporting information), further demonstrating that doping of Gd ions could promote photocatalytic efficiency for H2O2 production.
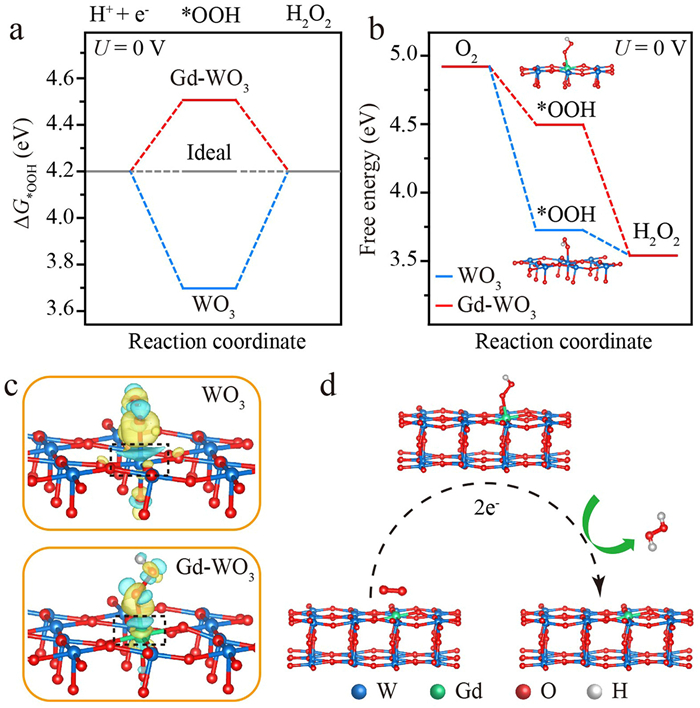
To explore the mechanism for the enhanced H2O2 generation on Gd-WO3, sets of DFT calculations via the computational hydrogen electrode method were conducted (see Supporting information for details). As modelled in Fig. S11 (Supporting information), in a stable crystal structure, Gd atoms would prefer to replace W atoms on WO3, which matched well with the above Gd 4f XPS analysis on Fig. 1f. Besides, during the reduction of oxygen to H2O2, the absorption energy of oxygen intermediate *OOH (ΔG*OOH) plays a dominant role in determining the reaction activity. The ideal catalysts for H2O2 generation prefer a ΔG*OOH ~4.2 ± 0.2 eV [42-44]. As shown in Fig. 4a, compared to ΔG*OOH of WO3 (3.73 eV), the calculated ΔG*OOH of Gd-WO3 is around 4.49 eV, which is larger than 4.2 eV and much closer to the optimal Gibbs free energy (~4.2 eV). Additionally, with Gd3+ doped, the energy barrier of rate-determining step becomes lower than pure WO3 (Fig. 4b), benefiting the generation of H2O2 on Gd-WO3. The charge density difference of WO3 and Gd-WO3 were further investigated separately to distinguish the charge transfer (Fig. 4c). In specific, the electrons will migrate to Gd central atom, which causes a significant augment of charge density on the Gd site. Moreover, Gd atom is found to have easier access to acquire electrons, thus, Gd center is more favourable to weaken the adsorption of *OOH [45,46], increasing the activity and selectivity of O2 reduction to H2O2. Additionally, ESR signal of DMPO-•OOH could be hardly observed in the Gd-WO3 system (Fig. S12 in Supporting information), also demonstrating rapid reduction of O2 on Gd-WO3 to generate H2O2via a direct one-step two-electron oxygen reduction reaction pathway, instead of following sequential two-step one-electron pathway. The two-electron reduction pathway for H2O2 production on Gd-WO3 was depicted on Fig. 4d.
Figure 4
Figure 4.
(a) Comparison of ΔG*OOH for oxygen reduction to H2O2 on WO3 and Gd-WO3. (b) Free energy diagram for the 2e− pathway for H2O2 generation on WO3 and Gd-WO3 at U = 0 V vs. RHE. Differential charge densities of (c) WO3 and Gd-WO3 after *OOH adsorption. Yellow and blue-colored isosurfaces show electrons gain and loss, respectively. (d) Schematic of the 2e− pathway for H2O2 generation on Gd-WO3.
Along with the photocatalytic degradation of tetracycline, the degradation efficiency decreased gradually and closed to end at reaction time of 120 min. However, with the addition of certain amount of FeSO4 (1.5 mmol/L), degradation of tetracycline was boosted again and reached a completed removal after half an hour, and the determined k was 61.1 × 10⁻³ min−1 with Gd-WO3 (Fig. 5a, Fig. S13 and Table S5 in Supporting information). A continued increasement of Fe2+ dosage (3.0 mmol/L) didn't result in a further increased efficiency. This phenomenon can be attributed to the activation of H2O2 by Fe2+ to generate extra •OH, followed by a subsequent oxidation of tetracycline by •OH. The ESR analysis of this step helped to confirm the existence of •OH during this step (Fig. 5b). The photocatalytic oxidation and subsequent Fenton reaction can serve together as a cascade reaction for the efficient degradation of tetracycline. And the total organic carbon (TOC) removal efficiency through the cascade reaction was around 1.65 times higher than the sole photocatalysis (Fig. S14 in Supporting information).
Figure 5
Figure 5.
(a) Photocatalysis-Fenton cascade degradation of tetracycline over Gd-WO3–3 with addition of different dosage of Fe2+. (b) ESR spectra of DMPO-•OH adduct with Gd-WO3–3 in Fenton reaction. (c) The schematic diagram of proposed mechanism for the photocatalysis-Fenton cascade reaction on Gd-WO3–3.
Besides, in contrast to similar literatures that have been reported (Table S6 in Supporting information), Gd-WO3 synthesized in this work not only exhibits efficiently synergetic photocatalytic H2O2 production and oxidation of organic pollutants without purging of oxygen gas into the solution, but also realizes photocatalysis-Fenton cascade reaction without the external addition of H2O2. The efficiency of Gd-WO3 showed a decreased efficiency after four cycled experiments, we attributed this phenomenon to the covered reaction sites due to the absorbed TC and products on the surface, since morphology and crystal structure did not show any obvious change (Fig. S17 in Supporting information).
Scheme for the overall reaction mechanism was presented in Fig. 5c. Under solar light irradiation, e−-h+ pairs are efficiently generated and separated on Gd-WO3 composite. The holes can oxidize organic pollutant directly, while the holes also can react with H2O to form •OH, followed by oxidation of organic pollutants by •OH. Simultaneously, the separated electrons will reduce oxygen to form H2O2 directly, and the in-situ generated H2O2 can be further activated to treat organic compounds. In comparison with single photocatalytic oxidation treatment of organic pollutants which mainly relies on the oxidation capability of h+, the cascade reactions can utilize both the photogenerated electrons and holes, to boost the photocatalytic efficiency greatly.
As a summary, the Gd-WO3 with well dispersed Gd sites was developed, which can directly oxidize organic pollutants, as well as produce H2O2in situ under solar irradiation. As manifested, doping Gd ions into WO3 can efficiently broaden the solar light absorption spectrum to near-infrared range (~1100 nm), as well as improve the photocurrent intensity up to six folds, resulting in much-enhanced photocatalytic oxidation capability towards organic micropollutants, including tetracycline and 2, 4-dichlorophenol. What is more, the Gd sites on WO3 can promote the charge transfer from catalyst to oxygen, favouring the photocatalytic generation of H2O2 with a rate of 0.58 mmol L−1 g−1 h−1, without the addition of any electron scavengers. The generated H2O2 can be further activated to produce •OH, contributing the oxidation of organic compounds. The cascade photocatalytic oxidation-H2O2 activation reaction provides a feasible catalyst design strategy for the fully utilization of photogenerated electrons and holes for oxidation of organic pollutants.
Declaration of competing interest
The authors declare that they have no known competing financial interests or personal relationships that could have appeared to influence the work reported in this paper.
Acknowledgments
This work was supported by Natural Science Foundation of Zhejiang Province (No. LR21B07002), National Natural Science Foundation of China (Nos. 22176170, 21976152), and the Open Research Program of Key Laboratory of 3D Micro/Nano Fabrication and Characterization of Zhejiang Province, Westlake University.
Supplementary materials
Supplementary material associated with this article can be found, in the online version, at doi:10.1016/j.cclet.2023.108157.
K. Wang, Y. Li, H. Shi, et al., Adv. Sustainable Syst. 6 (2022) 2200144. doi: 10.1002/adsu.202200144
[45]
J. Qin, H. Liu, P. Zou, et al., J. Am. Chem. Soc. 144 (2022) 2197–2207. doi: 10.1021/jacs.1c11331
[46]
J. Lee, A. Kumar, T. Yang, et al., Energy Environ. Sci. 13 (2020) 5152 doi: 10.1039/D0EE03183F
Figure 1
(a) Low-resolution SEM image and the corresponding element mappings of Gd-WO3–3. (b) The XRD patterns of WO3 and Gd-WO3. (c) The total survey XPS spectra of WO3 and Gd-WO3–3. (d-f) The respective W 4f, O 1s and Gd 4d XPS spectra of WO3 and Gd-WO3–3. (g) The HAADF-STEM image of Gd-WO3–3.
Figure 2
(a) Photocatalytic degradation curves of tetracycline over WO3 and series Gd-WO3 photocatalysts under dark adsorption equilibrium and simulated solar light irradiation (1 kW/m2). (b) The detected photocatalytic production of H2O2 in the presence of tetracycline under simulated solar light irradiation (1 kW/m2). (c) Effects of various quenching agents on tetracycline degradation with Gd-WO3–3. (d) ESR spectra of DMPO-•OH adduct and (e) DMPO-O2•− adduct with Gd-WO3–3 under irradiation. (f) The detected photocatalytic production of H2O2 with Gd-WO3, under purging the solution with different gas bubbles.
Figure 3
(a) UV–vis-NIR diffuse reflectance spectra of WO3 and Gd-WO3–3. The inset are plots of (Ahν)1/2versus hν. (b) Mott-Schottky plots of WO3 and Gd-WO3–3. (c) Energy level diagrams of WO3 and Gd-WO3–3. (d) The detected photocurrent response curves of WO3 and Gd-WO3–3, with or without one solar irradiation (1 kW/m2). (e) PL spectra of WO3 and Gd-WO3–3. (f) Koutecky-Levich plots of the data obtained at the constant electrode potential (−0.35 V vs. RHE) for WO3 and Gd-WO3–3.
Figure 4
(a) Comparison of ΔG*OOH for oxygen reduction to H2O2 on WO3 and Gd-WO3. (b) Free energy diagram for the 2e− pathway for H2O2 generation on WO3 and Gd-WO3 at U = 0 V vs. RHE. Differential charge densities of (c) WO3 and Gd-WO3 after *OOH adsorption. Yellow and blue-colored isosurfaces show electrons gain and loss, respectively. (d) Schematic of the 2e− pathway for H2O2 generation on Gd-WO3.
Figure 5
(a) Photocatalysis-Fenton cascade degradation of tetracycline over Gd-WO3–3 with addition of different dosage of Fe2+. (b) ESR spectra of DMPO-•OH adduct with Gd-WO3–3 in Fenton reaction. (c) The schematic diagram of proposed mechanism for the photocatalysis-Fenton cascade reaction on Gd-WO3–3.

 DownLoad:


 下载:
下载:


