Figure 1.
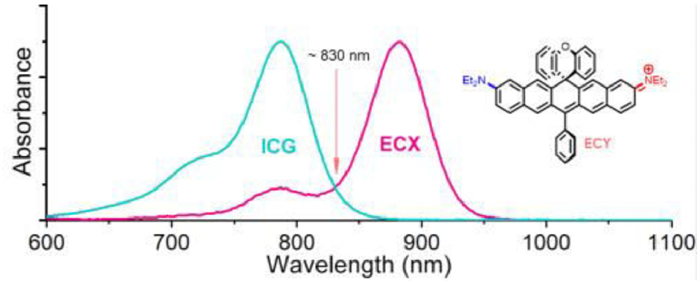
The absorption spectra of ICG and ECX showing that they do not absorb appreciably at 830 nm, and the generic structure of ECY.
Spectral and biodistributional engineering of deep near-infrared chromophore
Yan Dong , Xicun Lu , Yi Li , Weichao Chen , Lei Yin , Jie Zhao , Xinru Hu , Xinran Li , Zuhai Lei , Yuyang Wu , Hao Chen , Xiao Luo , Xuhong Qian , Youjun Yang

There is an ongoing paradigm shift of the bioimaging spectral region toward the longer-wavelength [1–4]. For small animal-based in vivo imaging or intraoperative imaging, the tissue penetration depth is the primary concern. Light beyond 650 nm is mandated to avoid the background tissue absorption by hemoglobin and the oxygenated hemoglobin [5]. The penetration depth is further restricted by tissue scattering, which is inversely proportional to the fourth power of the light wavelength [6]. The current benchmark near-infrared fluorophore is the Indocyanine Green (ICG, λabs = 780 nm) [7]. It has been widely used in clinical settings for fundus angiography, liver function assessment, and fluorescence guide surgery. Moving deeper into the long-wavelength region beyond 800 nm, i.e., the deep-NIR, is desired for in vivo imaging [8,9]. For this deep-NIR spectral region, a versatile, bright, biocompatible, and biodistribution-specific fluorophore is in need.
Near-infrared active materials are diverse and organic fluorophores are particularly welcome for their higher potentials for clinical translation [10–21]. Polymethine cyanine, to which ICG belongs, is the most notable class of long-wavelength dyes first reported in the 1930s. They exhibit narrow absorption band and high molar absorptivity in organic solvents. Yet, cyanines in particular those absorbing beyond 800 nm become increasingly prone to polarity/aggregation-induced symmetry breaking, which results in peak-shifting, band-broadening, and hypochromic shifts of their S0-S1 absorption band [22,23]. These spectral changes complicate if not prohibit their potentials for high-contrast multiplexing. The DAD/ADA-type fluorochromic scaffold is a recent addition to the family of NIR dyes. Their absorption band is usually broad (FWHM > 100 nm) and molar absorptivity is low (ε < 5 × 10⁴ L mol−1 cm−1) (Fig. S2 in Supporting information) [24,25]. In 2017, we reported a new class of NIR fluorophore, i.e. EC5, the first embodiment of which is a bright deep-NIR fluorophore (ECX) absorbing at 880 nm in CH2Cl2 [26]. Its absorption is intense (ε > 1 × 10⁵ L mol−1 cm−1) and sharp (FWHM = 665 cm−1/52 nm) and its absorption/emission maxima are minimally affected by solvatochromism. Over the years, the 808 nm laser line has become popular in NIR bioimaging, and the absorption of ECX at 808 nm is minimal (Fig. 1). To address this issue, we plan to develop an EC5 derivative readily excitable by 808 nm. Because structural/biochemical specificity of an imaging agent is the primary concern of a surgeon, its biological distribution needs systematic investigation [27,28]. Biological compatibility is another parameter of paramount importance for in vivo imaging. Ideally, it is water-soluble, readily metabolized/excreted, and minimally toxic.
In this work, we designed and synthesized ECY, which is a bright fluorophore absorbing at 836 nm in CH2Cl2. To get water soluble analogs of ECY, we further installed a varying number of sulfonate groups, i.e., ECYa with none, ECYS1 with one, ECYS2 with two, and ECYS3 with three, or a polyethyleneglycol chain with an average molecular weight of 5000 amu, i.e., ECYPEG. Their photophysical properties and excited-state dynamics, stability, acute-toxicity, metabolism, and biological distributions were evaluated. Finally, we studied their feasibility for in vivo biological imaging.
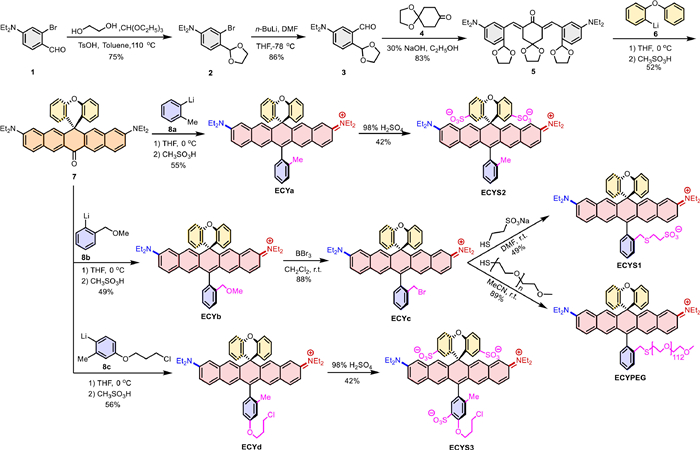
The wavelength of the rhodamine dye is blue-shifted with the decrease of the electron-donating ability of the N-substituents [29–33]. Therefore, we changed the julolidine substituent of ECX to diethylamine, so as to obtain the dye ECY with a blue-shifted wavelength. The synthesis of ECY was analogous to ECX (Scheme 1). The formyl group of 2-bromo-4-diethylaminobenzadehyde (1) was converted into a dioxolane by acid-catalyzed condensation with ethylene glycol in a 75% yield. The bromine atom of 2 was lithiated with nBuLi and quenched with anhydrous DMF to give aldehyde 3, which was subjected to base-catalyzed Aldol condensation with 1,4-dioxaspiro[4.5]decan-8-one (4) to furnish compound 5 in an 83% yield. Addition of mono-lithiated diphenyl ether (6) to the carbonyl group of 5 yielded a carbinol intermediate, the crude residue of which from work-up was treated with MeSO3H to furnish the diarylketone 7 in a 52% yield. ECYa was synthesized by reacting 7 with 2-methylphenyl lithium reagent (8a) followed by an acid workup in a 55% yield. Two sulfonate groups could be introduced onto the diphenyl ether moiety by stirring ECYa in concentrated H2SO4 at 0 ℃ to prepare ECYS2 in a 42% yield. Preparation of monosulfonated analog (ECYS1) was achieved via nucleophilic attack of 2-mercaptoethanesulfonate at the benzylic bromide of ECYc, which was synthesized via BBr3 treatment of ECYb. Alternatively, the bromo atom of ECYc could also be replaced by other sulfides, as with thiolated methoxypolyethylene glycol to obtain ECYPEG. To synthesize an ECY derivative with three sulfonate groups, we prepared ECYd by the reaction of 7 and 2-methyl-4-chloropropoxylphenyl lithium reagent (8c) in a 56% yield. By stirring with conc. H2SO4, three sulfonate groups were installed onto the ECY scaffold to give ECYS3. This way, we prepared a focused library of ECY scaffold with varying overall charges, i.e., +1 of ECYa/ECYPEG, 0 of ECYS1, −1 of ECYS2, and −2 of ECYS3, offering an opportunity to establish the correlation between the charge/solubility and the biocompatibility and in vivo distributions.
Their spectral properties were examined in different solvents (Fig. 2,Table 1 and Fig. S1 in Supporting information). The absorption spectrum of ECYa in CH2Cl2 was typical of a polymethine cyanine, with a main band at 836 nm (ε = 2.26 × 10⁵ L mol−1 cm−1) and a shoulder at 752 nm (ε = 3.41 × 10⁴ L mol−1 cm−1) (Fig. 2A). Its absorption in the entire visible range from 380 nm to 780 nm was weak with three fingertips at 556 nm, 516 nm, and 470 nm (ε < 0.7 × 10⁴ L mol−1 cm−1). Upon excitation, ECYa emitted maximally at 871 nm (Φ = 16%) with a tailing shoulder peak at 914 nm. The spectral properties of ECYa showed solvatochromism, though to an insignificant degree. Its absorption maximum blue-shifted to 822 nm in toluene and 829 nm in CH3CN, and red-shifted to 852 nm in DMSO and 846 nm in neutral phosphate buffer (PBS, 10 mmol/L, pH 7.4, with 10% DMSO). The aqueous solubility of ECYS1 was actually poorer than ECYa, while ECYS2 and ECYS3 were highly water soluble (> 10 mg/mL). Therefore, the spectra of ECYS1 in CH2Cl2, ECYS2 and ECYS3 in HEPES buffer solution (10 mmol/L, pH 7.4, with 0.1% DMSO) were acquired (Table 1). Overall, the cyanine features of their absorption spectra were maintained and largely resembled the spectra of ECYa. Minor peak-shifting of ca. 10 nm and band broadening by ca. 160 cm−1/15 nm were observed. The insignificance of solvatochromism is attributed to the fact that the sulfonates groups are installed on either the diphenyl ether or the bottom phenyl moieties, which are electronically orthogonal to the fluorochromic core. ECYPEG was highly water-soluble and absorbed at 851 nm and emitted at 890 nm in HEPES.
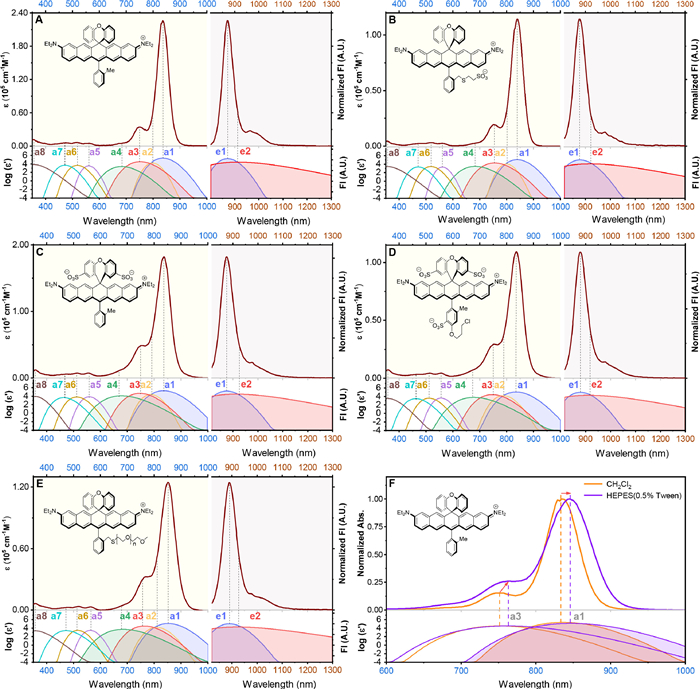
The spectrum of ECYa in CH2Cl2 was fitted to a mathematical model of eight constituting Gaussian peaks following our previous reported protocol, i.e., a1, a2, a3, a4, a5, a6, a7, and a8 of decreasing maximal wavelength (Fig. 2A) [34,35]. The peaks a1, a2, a3, and a4 in the longer-spectral region (700–900 nm) are presumably of the HOMO-LUMO transition from the lowest vibrational level of S0 to higher vibrational levels of S1 [36]. In the shorter-wavelength region of 350–700 nm, a total of another four bands, i.e., a5, a6, a7, and a8, were identified, from the transitions of the lower-lying occupied orbitals to the LUMO orbital. Cyanine dyes exhibit a sharp and intense main band and a less sharp and lower-intensity shoulder [37]. Take ECYa as an example, these two peaks are a1 (ε = 2.26 × 10⁵ L mol−1 cm−1) and a3 (ε = 3.41 × 10⁴ L mol−1 cm−1), exhibited an FWHM' of 689 cm−1 and 1022 cm−1, respectively. We suggest that the percent contribution of the oscillator strength (f) of four bands (a1:a2:a3:a4) to the entire spectrum could be harnessed as a viable quantitative index evaluating the "cyanine-ness" of a dye. As for ECYa, the cyanine-ness was 63:4:14:2. When dissolved in HEPES (10 mmol/L, pH 7.4, with 0.5% Tween-80), the cyanine spectral feature of ECYa was maintained, though peaks a1 and a3 both became slightly broadened with a FWHM of 854 cm−1 and 1247 cm−1 (Fig. 2F). The percent contribution of the four bands are largely the same at 58:5:21:4. The absorption spectra of ECYS1 in CH2Cl2, ECYS2, ECYS3 and ECYPEG in HEPES (Figs. 2B–E) were also analogously deconvoluted. The width of their band a1 are at 701 cm−1, 850 cm−1, 845 cm−1, and 858 cm−1 with a percent contribution of 62%, 54%, 55% and 58%.
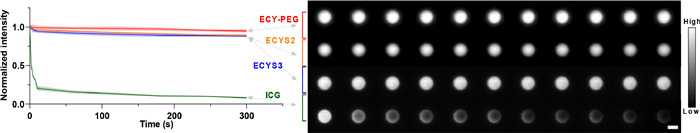
Photostability of these ECY dyes were evaluated, with a home-built epi-fluorescence microscope equipped with a CCD camera with NIR capability (Fig. 3, Figs. S3 and S4 in Supporting information). A solution of ECYS2/ECYS3/ECYPEG/ICG in PBS with 10% serum, respectively, was dropped onto a glass slide and sealed with a cover slip. Upon excitation with an 808 nm laser, the fluorescence intensity of ICG/ECYS2/ECYS3/ECYPEG was acquired with a longpass filter at 850 nm. The fluorescence intensity of ICG collapsed by ca. 79.6% in a few seconds prior to a further slower intensity decrease, while ECYPEG did not exhibit noticeable bleaching. Regardless of their headgroups and substitutions, all showed excellent photostability. Photostability of ECYS1 was not tested due to its poor aqueous solubility.
We screened the focused library of differently substituted ECY dyes for biological distribution, i.e., ECYa, ECYS2, ECYS3, at a dose of 1 mg/kg and ECYPEG, at a dose of 3 mg/kg. ICG is routinely used for vasculature imaging in surgery and used as a reference. However, its quick hepatobiliary clearance is a practical limitation. In our experiment, ICG (1 mg/kg) was injected into BALB/c mice through tail vein. The mouse was irradiated by a laser at 808 nm and the fluorescence emission was collected through a longpass filter with a cutoff at 1200 nm. In as short as 2 min, the signal intensity from liver was already 1.7 fold higher than that of submental vein, and 3.5 fold higher than right saphenous vasculature. In 1 h, emission of ICG was not obvious anymore in vasculature. In the following few hours, the small intestine and the cecum were sequentially lit up highlighting its hepatobiliary clearance pathway and excretion via feces. By monitoring the fluorescent intensity of ICG in the liver and the hindlimb vasculature, the half-lives of blood circulation and hepatobiliary clearance were calculated to be 6.4 ± 0.2 min and 144.3 ± 14.9 min, respectively. The mouse vasculature was also clearly observed upon tail-vein injection of ECYa, ECYS3 and ECYPEG, except ECYS2 because of its fast liver uptake. Compared to ICG, ECYa (1 mg/kg) exhibited an improved blood retention and this was obvious in images taken within the first two hours (Fig. 4A). The signal intensity from the spleen became strong and the bones including sternum and tibia were also lit up, presumably due to immunogenic interaction [38]. In 12 h, emission was still visible in liver, intestines, and spine. Its blood retention half-life was 35.6 ± 7.7 min. The excretion was found to be primarily via reticuloendothelial system [39], with an excretion half-life of 789.8 ± 93.5 min, the slowest of the entire series tested. The biological distribution and pharmacokinetics of ECYS2 (1 mg/kg) resemble those of ICG, i.e., a fast uptake by liver with a short blood retention half-life of 2.4 ± 0.7 min, and fast excretion. One interest discovery was that the gallbladder was stained with high contrast with surrounding tissues during the period of 2–4 h post injection. Therefore, it also showed potential for intraoperative cholangiography during liver transplantation to avoid iatrogenic injury of bile duct [40]. ECYS3 (1 mg/kg) yielded the brightest vasculature signal intensity within the first 10 min, compared to the other few dyes. Yet, it was not a good candidate for two reasons. First, its biological clearance is rapid, even more so than ICG. Second, it exhibited unexpected skin affinity, which explains the brighter signal intensity. The strong signal from the skin actually rendered the observation of deep-tissue vasculature difficult. ECYS3 exhibited a blood circulation time of 18.6 ± 1.4 min and faster excretion upon taken up by liver with an excretion half-life of 60.5 ± 10.9 min. ECYPEG (3 mg/kg) exhibited robust vasculature imaging capability. In the first 2 min, ECYPEG lit up the submental, abdominal and hindlimb vasculature, etc., and a relative lower degree of uptake by liver, the average signal in which was only 1.9 fold stronger than that of right saphenous vasculature, while for ICG, ECYa, ECYS2 and ECYS3, the ratio were 3.5, 3.3, 7.4 and 1.9. Over the next 3 h, though the signal intensity in the vasculature of cerebral and hindlimb gradually decreased, the signal-to-background ratio (SBR) of the highlighted blood vessels were remained above half of the maximum, while almost no fluorescence signal could be visualized after injection of ICG (Fig. S9 in the supporting information). A blood retention half-life of 147.5 ± 34.8 min and an excretion half-life of 244.1 ± 19.7 min were calculated.
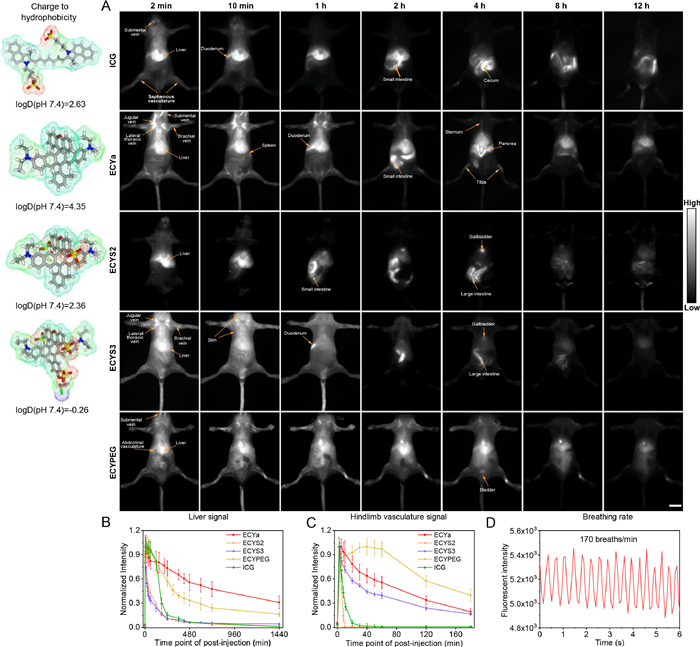
By comparing the fluorescence intensity in liver, the lipophilic ECYa was the slowest to metabolize and excrete, with ECYPEG the second slowest (Fig. 4B). All the sulfonate-derivatized analogs except for ECYS1 (Fig. S8 in Supporting information) were metabolized quicker than ICG. To compare their blood retention, the fluorescent intensity of hindlimb vasculature was extrapolated (Fig. 4C). ECYPEG was the most persistent. Its signal showed a gradual increase during the first 30 min post injection and then remained steady for ca. 30 min before a subsequent slow decrease. ECYPEG was used to monitor the mouse respiration through video-rate imaging (Fig. 4D). A respiratory rate of 170 breaths/min was calculated. The cell viability of ECY dyes were studied and all exhibited negligible cytotoxicity (Fig. S5). The most promising candidates (ECYPEG) and the next best (ECYa) were sent for an acute toxicity study with mouse (Tables S1 and S2 in Supporting information). ECYPEG was found not to exhibit acute toxicity up to the highest tested dose of 200 mg/kg, while a LD50 of 14.7 ± 1.8 mg/kg was obtained for ECYa. The biocompatibility of ECYPEG was further showcased with good liver function and organ histology (Figs. S6 and S7 in Supporting information). Based on the blood-retention half-life, hepatobiliary clearance half-life, and biocompatibility, ECYPEG was selected for further study.
We further optimized imaging parameters for higher SBR with ECYPEG and at the same time exhibited the proof-of-concept vasculature imaging of the finer blood vessels in limb and cerebral. ECYPEG was intravenously injected into the tail vain of mouse, upon the excitation of 808 nm laser line, the fluorescent signals were then collected with longpass emission filters with different cutoff wavelengths. A series of images were acquired with a longpass of 1000 nm and an exposure time of 1 ms, 1100 nm (5 ms), 1200 nm (20 ms), 1300 nm (50 ms), 1400 nm (300 ms), 1500 nm (600 ms) (Fig. 5A). A general trend was that a longer cutoff wavelength resulted in a less degree of tissue scattering, an improved SBR (Fig. 5D) and spatial resolution, at the expense of exposure time. The same trend was also found during the imaging of the hindlimb vasculature (Figs. 5B–E), in which the vessel with FWHM of 71.1 µm could be distinctly observed (Fig. S10 in Supporting information). A compromise between the exposure time and the SBR led to the determination of 1300 nm/50 ms for future imaging studies.
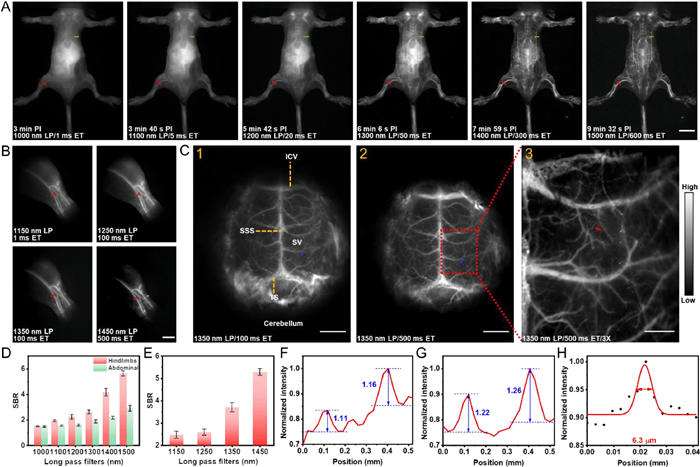
We further used ECYPEG to image the tiny vessels of the cerebral vasculature through intact skull from a superior view with excitation at 808 nm, longpass cutoff at 1350 nm, an exposure time of 100 ms, and a magnification of 0.64. After intravenous injection of ECYPEG (3 mg/kg), the inferior cerebral veins (ICV), the transverse sinus (TS), the superior sagittal sinus (SSS), and the superficial veins (SV) connected to the SSS could be clearly distinguished. A shorter exposure is good for high imaging frame rate, while a longer exposure time improves the SBR. For example, to realize richer vasculature network observation, the exposure time was set to be 500 ms. With an exposure of 100 ms, by the line-profile of the two capillaries (highlighted in blue, Fig. 5C1), a SBR of 1.11 and 1.16 were calculated (Fig. 5F). By increasing to 500 ms, a SBR of 1.22 and 1.26 were obtained (Fig. 5G). A higher magnification of 3X with an exposure time of 500 ms, offered improved spatial resolution. The micro blood vessel with an apparent width of only 6.3 µm was observed with good SBR (Fig. 5H).
To summarize, we developed a bright deep-NIR fluorophore (ECY) absorbing/emitting at 836 nm in CH2Cl2, with a narrow FWHM of 689 cm−1. We further synthesized a focused library of water-soluble analogs of ECY by introducing a varying number of sulfonates (ECYS1, ECYS2, and ECYS3) or a polyethylene glycol chain (ECYPEG). They were tested in in vivo mouse imaging. ECYS2 has potentials for imaging of organs involved in hepatobiliary metabolism and ECYPEG for vasculature. This work offers a framework for future development of fluorophores for deep-NIR multiplexing. Also, the fluorophores of this work have broad potentials for practical applications in basic research, translational medicine and surgery.
The authors declare that they have no known competing financial interests or personal relationships that could have appeared to influence the work reported in this paper.
This work was supported by the National Natural Science Foundation of China (Nos. 21908065, 22078098, and 22278138), the Shanghai Academic Technology Research Leader (No. 22XD1421000), the Research Funds of Happiness Flower ECNU (No. 2020JK2103), and the Open Funding Project of the State Key Laboratory of Bioreactor Engineering.
J.V. Frangioni, Curr. Opin. Chem. Biol. 7 (2003) 626–634. doi: 10.1016/j.cbpa.2003.08.007
G.M. Dam, G. Themelis, L.M. Crane, et al., Nat. Med. 17 (2011) 1315–1319. doi: 10.1038/nm.2472
Z. Hu, C. Fang, B. Li, et al., Nat. Biomed. Eng. 4 (2020) 259–271. doi: 10.1038/s41551-019-0494-0
Z. Lei, F. Zhang, Angew. Chem. Int. Ed. 60 (2020) 16294–16308.
Y.T. Lim, S. Kim, A. Nakayama, et al., Mol. Imaging 2 (2003) 50–64. doi: 10.1162/153535003765276282
A.N. Bashkatov, E.A. Genina, V.V. Tuchin, J. Innov. Opt. Health Sci. 4 (2011) 9–38. doi: 10.1142/S1793545811001319
J.A. Carr, D. Franke, J.R. Caram, et al., Proc. Natl. Acad. Sci. U. S. A. 115 (2018) 4465–4470. doi: 10.1073/pnas.1718917115
K. Welsher, Z. Liu, S.P. Sherlock, et al., Nat. Nanotechnol. 4 (2009) 773–780. doi: 10.1038/nnano.2009.294
Y. Liu, Y. Li, S. Koo, et al., Chem. Rev. 122 (2022) 209–268. doi: 10.1021/acs.chemrev.1c00553
M. Longmire, N. Kosaka, M. Ogawa, et al., Cancer Sci. 100 (2009) 1099–1104. doi: 10.1111/j.1349-7006.2009.01133.x
V.G. Bandi, M.P. Luciano, M. Saccomano, et al., Nat. Methods 19 (2022) 353–358. doi: 10.1038/s41592-022-01394-6
C. Yao, Y. Chen, M. Zhao, et al., Angew. Chem. Int. Ed. 61 (2022) e202114273. doi: 10.1002/anie.202114273
J. Li, M. Zhang, L. Yang, et al., Chin. Chem. Lett. 32 (2021) 3865–3869. doi: 10.1016/j.cclet.2021.04.041
Y. Sun, X. Zeng, Y. Xiao, et al., Chem. Sci. 9 (2018) 2092–2097. doi: 10.1039/C7SC04774F
Z. Shou, S. Herraiz, J. Yue, et al., Adv. Mater. 30 (2018) 1705799. doi: 10.1002/adma.201705799
W. Jun, B. Noël, J. Li, et al., Biomol. Chem. 18 (2020) 4135–4156. doi: 10.1039/D0OB00790K
H. Bian, D. Ma, F. Peng, et al., J. Am. Chem. Soc. 144 (2022) 22562–22573. doi: 10.1021/jacs.2c08602
B. Ulrich, F. Fimmel, Angew. Chem. Int. Ed. 51 (2012) 164–167. doi: 10.1002/anie.201107176
E. Cosco, J. Caram, O. Bruns, et al., Angew. Chem. Int. Ed. 56 (2017) 13126–13129. doi: 10.1002/anie.201706974
J. Liu, Y. Sun, H. Zhang, et al., ACS Appl. Mater. Interfaces 35 (2016) 22953–22962.
Z. Qin, T. Ren, H. Zhou, et al., Angew. Chem. Int. Ed. 56 (2022) e202201541.
L. Tolbert, X. Zhao, J. Am. Chem. Soc. 119 (1997) 3253–3258. doi: 10.1021/ja9626953
D. Cosco, A. Arús, L. Spearman, et al., J. Am. Chem. Soc. 143 (2021) 6836–6846. doi: 10.1021/jacs.0c11599
L. Antaris, H. Chen, K. Cheng, et al., Nat. Mater. 15 (2016) 235–242. doi: 10.1038/nmat4476
Y. Yuan, Z. Feng, S. Li, et al., Adv. Mater. 34 (2022) 2201263. doi: 10.1002/adma.202201263
Z. Lei, X. Li, X. Luo, et al., Angew. Chem. Int. Ed. 56 (2017) 2979–2983. doi: 10.1002/anie.201612301
H. Choi, K. Nasr, S. Alyabyev, et al., Angew. Chem. Int. Ed. 50 (2011) 6258–6263. doi: 10.1002/anie.201102459
M. Luciano, J. Namgoong, R. Nani, et al., Mol. Pharmaceutics 16 (2019) 3253–3260. doi: 10.1021/acs.molpharmaceut.9b00453
L. Wang, W. Du, Z. Hu, et al., Angew. Chem. Int. Ed. 58 (2019) 14026–14043. doi: 10.1002/anie.201901061
N. Wang, Y. Hao. X. Feng, et al., Chin. Chem. Lett. 33 (2022) 133–140. doi: 10.1016/j.cclet.2021.06.075
W. Liu, J. Chen, Q. Qiao, et al., Chin. Chem. Lett. 33 (2022) 4943–4947. doi: 10.1016/j.cclet.2022.03.121
X. Chai, W. Zhu, Q. Meng, et al., Chin. Chem. Lett. 32 (2021) 210–213. doi: 10.1016/j.cclet.2020.11.032
W. Zhou, X. Fang, Q. Qiao, et al., Chin. Chem. Lett. 32 (2021) 943–946. doi: 10.1016/j.cclet.2021.02.003
W. Blass, G. Halsey, Deconvolution of Absorption Spectra, Elsevier Science, America, 1981.
J. Li, Y. Dong, R. Wei, et al., J. Am. Chem. Soc. 144 (2022) 14351–14362. doi: 10.1021/jacs.2c05826
H. Lin, J. Silzel, Spectrochim. Acta A: Mol. Biomol. Spectrosc. 142 (2015) 210–219. doi: 10.1016/j.saa.2015.01.032
B. Guennic, D Jacquemin, Acc. Chem. Res. 48 (2015) 530–537. doi: 10.1021/ar500447q
R. Tian, H. Ma, Q. Yang, et al., Chem. Sci. 10 (2019) 326–332. doi: 10.1039/C8SC03751E
Y. Li, J. Gao, S. Wang, J, Med. Chem. 65 (2022) 2078–2090. doi: 10.1021/acs.jmedchem.1c01615
M. Ahmad, S. Tarek, M. Mohammed, et al., Transplantation 20 (2014) 1393–1401.

Figure 1 The absorption spectra of ICG and ECX showing that they do not absorb appreciably at 830 nm, and the generic structure of ECY.

Scheme 1 The synthesis procedure of ECYa-d and their water-soluble analogs (ECYS1, ECYS2, ECYS3, ECYPEG).

Figure 2 The UV-vis absorption, the fluorescence emission spectra of (A) ECYa, (B) ECYS1, (C) ECYS2, (D) ECYS3, (E) ECYPEG. Their chemical structures are included as insets. Those absorption and emission spectra are further deconvoluted and the constituting bands are plotted below the corresponding spectra. ECYa, and ECYS1 were dissolved in CH2Cl2, ECYS2, ECYS3 and ECYPEG were dissolved in HEPES buffer. (F) Comparison of the absorption spectra of ECYa in CH2Cl2 and aqueous medium.

Figure 3 Photostability studies of ECYS2, ECYS3, ECYPEG and ICG in PBS with 10% serum, performed by continuous 808 nm laser-irradiation of their solution sealed between a slide and a cover slip.

Figure 4 (A) NIR fluorescence imaging of the mice in the supine position after intravenous injection of ICG, ECYa, ECYS2, ECYS3, and ECYPEG with an 808 nm laser line (1200 nm long-pass filter, 50 ms) at various time points. (B, C) Representative fluorescent intensity of liver and right saphenous vasculature for ICG, ECYa, ECYS2, ECYS3 and ECYPEG administrated mice as a function of time. (D) The respiratory rate of the awake mouse (170 breaths per minute), analyzed by detecting the fluorescent signal fluctuation of liver motion after an intravenous injection of ECYPEG (1100 nm long-pass filter, 5 ms). All images were obtained with an 808 nm laser line (150 mW/cm2).

Figure 5 In vivo imaging of BALB/C mice through tail-vein injection of ECYPEG. (A) The whole-body imaging with a longpass emission filter of 1000, 1100, 1200, 1300, 1400, 1500 nm, sequentially. Scale bar: 1 cm. (B) Fluorescence imaging of the hindlimb blood vessels with longpass filters of 1150, 1250, 1350 and 1450 nm. Scale bar: 2 mm. (C) Cerebral vasculature imaging with a longpass filter of 1350 nm. Scale bar: 2 mm, 1 mm, 0.5 mm, respectively. (D) The signal-to-background ratio (SBR) of abdominal (green line) and hindlimb (red line) blood vessels highlight in Fig. 5A. (E) The SBR of the highlighted blood vessel in Fig. 5B. (F, G) The corresponding SBR of the vasculature along a blue line in Figs. 5C1 and C2. (H) Cross-sectional fluorescence intensity profile (black dots) and Gauss fit across a red line of interest in Fig. 5C3 for its diameter. All images were obtained with an 808 nm laser line (120 mW/cm2).

 扫一扫看文章

扫一扫关注我们
 DownLoad:

 下载:
下载: