
Scheme 1.
(a) Schematic diagram of the fabrication of Fe-N-CNS. (b) Schematic diagram of the properties of as-prepared Fe-N-CNS and their applications in synergistic dye removal and electromagnetic wave absorption.
Using silk-derived magnetic carbon nanocomposites as highly efficient Nanozymes and electromagnetic absorbing agents
Hao Wang , Xianhui Zhang , Yonghua Tang , Weifeng Rong , Jiachen Zhao , Chaoyu Fan , Zhisen Zhang , Zhijun Sun , Yun Yang , Youhui Lin

Carbon nanomaterials, including carbon nanotubes, graphene, graphene quantum dots and carbon quantum dots, are regarded as a rising star in many active research fields such as electronics, energy, catalysis, imaging, sensing and biomedicine [1–3]. Among the many carbon materials, graphene and graphene-like materials have attracted much attention from the experimental and theoretical scientific communities due to their large specific surface area, high thermal and electrical conductivity, high mechanical strength and low manufacturing cost [4]. One of their successful applications is in the catalysis field, which has been widely used as catalysts in various chemical and biochemical reactions. The performance of these catalysts is highly dependent on their physical and chemical properties, such as their electronic property [5]. To enhance their catalytic performance, various strategies have been adopted to tailor their properties by physical and chemical means [6,7]. Among these methods, both theoretical calculations and detailed experiments have demonstrated that chemical doping carbon materials with hetero-atoms is one of the most versatile and efficient strategies to tune their intrinsic properties, including electronic characteristics, surface structures and local chemical, enrich-free charge-carrier densities and enhance the thermal or electrical conductivities [8,9]. In particular, nitrogen-doped carbon nanomaterials have promising energy storage and environmental remediation applications due to their excellent catalytic properties [10,11]. More interestingly, the insert of nitrogen into the graphitic structural lattice of carbon nanomaterials can endow them with unique enzyme-mimicking catalytic activities. For instance, Fan et al. reported a facile strategy to prepare N-doped porous carbon nanospheres (N-PCNSs) through the pyrolysis of melamine and formalin/phenol [12]. The obtained N-PCNSs could serve as an efficient nanozyme, which exhibited four enzymatic-like activities (oxidase, peroxidase, catalase, and superoxide dismutase). N-PCNS nanozymes could boost the generation of abundant reactive oxygen species in a tumor-specific manner, resulting in significant tumor regression in human tumor xenograft mice models.
On the other hand, to circumvent the aggravating electromagnetic wave (EMW) induced pollution problems, carbon/magnetic metal composites have widely been explored as highly efficient EMW absorption agents. The combination of carbon materials (dielectric materials [13,14]) with magnetic metals and ferrite (magnetic loss materials [15,16]) is a promising approach to enhance the electromagnetic wave and broaden the effective absorption bandwidth of the composite materials [17]. So far, magnetic metal/carbon composites are overwhelmingly derived from MOF carbon-based derivatives [18]. Additionally, the loading of ferromagnetic nanoparticles, such as FeNx, can provide graphite-like carbon materials with intrinsic magnetism. Consequently, developing and designing ferromagnetic nanoparticles loaded on N-doped carbon materials might act as EMW absorption materials to address the EMW-induced environmental problems. However, only a few preliminary attempts and efforts have been made to exploit loaded and doped functionalized carbon materials for both artificial enzymes and electromagnetic wave absorption applications.
Herein, a practical and versatile method for synthesizing ferromagnetic nanoparticles loaded on N-doped carbon nanosheets (Fe-N-CNS) by salt-assisted high-temperature carbonization of natural silk proteins was reported (Scheme 1). The doping of N and loading of ferromagnetic nanoparticles endows Fe-N-CNS with more efficient catalytic activities, acting as excellent mimics of peroxidase and oxidase. Combining graphene-like structures, catalytically active Fe-N-CNS can be applied to highly efficient dye removal via synergistic adsorption and degradation. Moreover, the Fe-N-CNS with intrinsic magnetism and moderate electrical conductivity can also serve as an efficient electromagnetic wave absorption agent. The design and development of natural-proteins-derived carbon nanomaterials may provide an ascendant opportunity to mitigate or remediate dye-induced or electromagnetic-induced environmental pollution issues.
The manufacturing process of Fe-N-CNS is described in Scheme 1. Typically, 3 g silk cocoon was added into a 100 mL solution containing 30 g ZnCl2 and 40 g FeCl3. After heating at 80 ℃ for 4 h, the silk cocoon was utterly dissolved into silk-derived proteins (silk fibroin and sericin). And then, the above sample containing inorganic salts was dried in an oven at 150 ℃. Finally, the Fe-N-CNS was synthesized through facile carbonization of N- and Fe-rich precursors at 900 ℃ (with a heating rate of 5 ℃/min) for 2 h. In contrast, our previous work prepared silk-derived N-doped carbon nanosheets (N-CNS) by carbonization of extracted silk fibroin [19]. Silk possesses abundant amino-group structure, β-sheets and β-crystalline structures. The unique system enables significant biomass advantages, such as outstanding mechanical properties, excellent biocompatibility, and ease of chemical modification. Meanwhile, natural silk is rich in N, and only one step of carbonization is needed to form nitrogen-rich and highly active carbon-based nanozymes. The synthesis of N-CNS had to go through a complicated process (Scheme S1 in Supporting information). The morphology and structure of as-prepared carbon material were first characterized by transmission electron microscopy (TEM). As shown in Fig. 1a, our carbon material had a two-dimensional nanosheet shape and many holes on uneven surfaces. The porous structure on our nanosheet was formed because ZnCl2 was continuously evaporated during the carbonization process. SEM-energy dispersive X-ray spectroscopy (EDS) mapping images showed that Fe and N atoms are uniformly distributed throughout the domain (Fig. S1 in Supporting information), indicating that both Fe and N co-existed in such porous carbon nanosheets (Fe-N-CNS). Moreover, the XRD pattern of Fe-N-CNS, like N-CNS, showed a diffraction peak located at 26°, corresponding to graphite's (002) plane (Fig. 1b) [20]. It was also noted that another peak at 43.5° was ascribed to the (100) lattice plane of turbostratic carbon. These results indicated that graphene formed both hexagonal conjugated carbon and disordered graphene structures during the carbonization process [21]. The characteristic peaks of Fe3O4, Fe3N, Fe4N and Fe3C could be found in XRD. In the high-temperature process, Fe combines with different groups in the protein to form Fe-N [22], Fe-O, Fe-C, and finally, form other ferromagnetic nanoparticles. Moreover, Raman spectroscopy was applied to examine the structural disorder of the as-prepared Fe-N-CNS. The characteristic G band at around 1579 cm−1 and D bands at about 1340 cm−1 were observed in Fig. 1d, like the Raman spectroscopy of N-CNS (Fig. S2 in Supporting information), further confirming the plane of sp2-hybridized carbon and the disordered graphite structure, respectively [23]. The FTIR spectra of Fe-N-CNS showed the same O-H (3641 cm−1), C=O (1714 cm−1), and C-C (1471 cm−1) characteristic peaks with no characteristic peak shift and cleavage, only a decrease in peak intensity compared to N-CNS (Fig. 1c), indicating Fe-N-CNS remained a similar graphitization-like structure and surface groups as N-CNS [19].

X-ray photoelectron spectroscopy (XPS) was also used to examine the chemical compositions and the bonding configurations of the Fe-N-CNS. The XPS survey spectra of Fe-N-CNS (Fig. 1e) revealed that the Fe-N-CNS mainly contained carbon, iron, oxygen, and nitrogen elements, consistent with EDS mapping results. As seen in the high-resolution XPS spectrum of Fe 2p in Fig. 1f, there were two prominent peaks at 711 eV (2p1/2) and 725 eV (2p3/2) with two small satellite peaks [24]. However, no characteristic peaks of Fe0 metal or Fe-Fe bonds were observed near 706 eV, [25] indicating that Fe was present in the form of Fe2+ or Fe3+ and was anchored and stabilized in the sample by the formation of FeNx, FeOy or FeCz nanoparticles [26]. Moreover, the N doping in Fe-N-CNS was likewise confirmed by the N 1s high-resolution spectrum. As shown in Fig. 1h, four peaks could be fitted at 398.4, 399.5, 401.2 and 402.6 eV of N 1s for pyridine N, pyrrole N, graphite N, and oxidized N, respectively [27]. The deconvolution of the C 1s spectrum of Fe-N-CNS (Fig. 1g) indicated the presence of four types of carbon bonds: C-C (284.6 eV), C-N (285.2 eV), C-O (286.3 eV), and C=O (289.5 eV). C-O and C=O were equally detected in the O 1s high-resolution spectrum (Fig. 1i). All the results illustrated the existence of ferromagnetic nanoparticles, hetero N atoms with different types, and the graphitic structure, which were reported to contribute to the excellent enzyme-like activities of carbon-supported metal compound materials [12].
Solar absorbers have become a popular research topic due to their significant potential to increase photothermal conversion efficiency. Metal plasma materials, ceramic plasma materials and carbon-based materials effectively absorb solar energy. Compared with metal plasma materials, carbon-based materials (carbon black, graphite, graphene, carbon nanotubes, carbon composites, amorphous carbon, etc.) have been selected as superior photothermal conversion materials due to their excellent inherent properties. N-doped rich carbon materials have been shown to have excellent photothermal conversion efficiency [19]. Compared with other light sources, NIR light from 700 nm to 1000 nm is more frequently used than visible light due to its ease of operation, lower energy absorption, deeper penetration, and fewer side effects for human tissue. Therefore, an 808 nm laser was used as the light source to test the photothermal conversion efficiency of Fe-N-CNS. As shown in Figs. 2a and b, the temperature of the Fe-N-CNS solution (0.2 mg/mL) increased from 25 ℃ to 49 ℃ in 10 min. The temperature of the Fe-N-CNS solution increased more when the laser power was higher (Fig. 2c). The linear time data versus −lnθ, shown in Fig. 2d, is derived from the cooling period of the Fe-N-CNS solution. Accordingly, the photothermal conversion efficiency (η) of Fe-N-CNS was calculated to be 25% from the following equations (Eqs. 1-3):
|
|
(1) |
|
|
(2) |
|
|
(3) |

where h is the heat transfer coefficient, A is the surface area of the container, ΔTmax-mix and ΔTmax-H2O are the temperature changes of the mixture and water at the maximum steady-state temperature, respectively, I is the laser power, and A is the absorbance of Fe-N-CNS solution at 808 nm. The parament θ is defined as the ratio of ΔT to ΔTmax during the calculation.
Due to its unique structures, the as-prepared functionalized carbon materials possess intrinsic enzyme-like activities. The oxidase-like activity of Fe-N-CNS was determined by the colorimetric method. To monitor the reaction, 3,3′, 5,5′-tetramethylbenzidine (TMB) was introduced as a typical colorimetric enzyme substrate; and the oxidation of TMB produced a blue product oxTMB with a characteristic absorbance peak at 652 nm (Fig. 3a) [28]. As shown in Fig. 3b, the pure TMB solution did not show any absorption peak. However, when Fe-N-CNS was added, the solution had a clear absorption peak at 652 nm, which indicated that Fe-N-CNS could effectively catalyze the TMB molecule to obtain a blue product (oxidize TMB, inset of Fig. 3b). Like natural enzymes, the ability of Fe-N-CNS to oxidize TMB was pH- and temperature-dependent, with the highest activity at pH 4.0 and temperature 55 ℃ (Figs. S3b and c in Supporting information). In addition, Fe-N-CNS exhibited Michaelis-Menten kinetics in the TMB colorimetric reaction (Fig. 3c and Fig. S3d in Supporting information). To further investigate the origin of the oxidase-like activity of Fe-N-CNS, electron spin resonance (ESR) was used to detect reactive oxygen species in the catalytic process. Using DMPO as a probe, a typical DMPO/•O2− signal was observed in the ESR spectrum (Fig. 3d). Therefore, the ability of Fe-N-CNS to oxidize TMB originates from the generation of •O2− in the presence of O2.

Then, the peroxidase (POD)-like activity of Fe-N-CNS, which catalyzes the oxidation of TMB by H2O2, was measured (Fig. 3e) [29]. To test the activity, H2O2 and TMB were added directly to the colorimetric reaction (Fig. 3f). As shown in Fig. S4a (Supporting information), the system's activity increased significantly with the increasing concentration of Fe-N-CNS. The activity was also pH- and temperature-dependent; the optimum pH and temperature were 4.0 and 60 ℃, respectively (Figs. S4b and c in Supporting information). Figs. 3g and h showed typical Michaelis-Menten kinetics of H2O2 and TMB substrates, respectively. In addition, ESR spectra were also used to detect the generated ROS. Four characteristic peaks with a relative intensity ratio of 1:2:2:1 were observed in the Fe-N-CNS/H2O2/DMPO system from the ESR spectra (Fig. 3i), indicating that Fe-N-CNS reacted with H2O2 and formed the reaction intermediate (•OH). Fe-N-CNS catalyzed the production of •OH in the presence of H2O2 to further oxidize TMB. Moreover, light-regulated enzyme activity experiments were carried out. As shown in Fig. S5 (Supporting information), the oxidase- and peroxide-like activity of Fe-N-CNS under NIR irradiation was nearly 2.0 times higher than without NIR irradiation, suggesting NIR irradiation's capability to enhance dual-mimic enzyme activity. Many photo-activated nanozymes can perform photosensitized oxygen activation. When nanomaterials absorb photons, they often undergo an electronic transition from the ground state (S0) to the excited singlet state (S1). Electrons in S1 can also be transferred to the nanomaterial's excited triplet state (T1) via an intersystem crossing. After fast vibrational relaxation, T1 can decay to its ground state by emitting phosphorescence. Meanwhile, nearby triplet-state molecules, especially molecular oxygen, can interact with the T1 nanomaterial and initiate photochemical reactions that drive ROS production. These results indicated that our prepared Fe-N-CNS has photo-regulatable oxidase- and peroxide-like activities. Furthermore, Fe-N-CNS also possessed good recoverability, and its activity remained at 92% after five circles (Fig. S6 in Supporting information). Meanwhile, by comparing the XRD results before and after the reaction, it was found that the shape and position of the characteristic peaks of Fe-N-CNS did not change significantly (Fig. S6c), indicating that its crystal structure and chemical bonding maintained the same. Therefore, the prepared Fe-N-CNS nanozyme was easy to recover, durable, and had the potential for practical applications.
In recent decades, many untreated synthetic dyes are still released into the environment each year, posing a severe risk to human health and aquatic life [30]. Therefore, many methods have been developed to remove dye contaminants from wastewater, and nanozymes are considered one of the promising options [31]. Based on this, the removal activity of our catalytically active Fe-N-CNS toward organic pollutants was tested. In detail, since Fe-N-CNS contained a graphene-like structure, it had excellent adsorption properties for organic dyes (MO: Methyl orange and RhB: Rhodamine B) through hydrogen bonding, π-π interactions, and electrostatic interactions [32]. On the other hand, Fe-N-CNS generated numerous ROS by catalyzing oxygen and hydrogen peroxide to degrade pollutants into carbon dioxide and water. Fig. 4a showed that the MO was almost eliminated after 240 min of Fe-N-CNS treatment, as evidenced by the supernatant's color shift and the considerable drop in absorbance after centrifugation (Fig. 4b). The color of the control solution remained almost unchanged (Fig. 4a), indicating that the observed removal of the dye was due to not self-aggregation of the dye but the adsorption and degradation of Fe-N-CNS. Figs. 4c and d showed that the removal of MO could reach more than 90%, either by extending the reaction time to 240 min or by increasing the concentration of Fe-N-CNS nanozyme, implying that the removal effect depended on Fe-N-CNS and the inherent enzyme-like activity of Fe-N-CNS. Meanwhile, Fe-N-CNS showed a stronger ability to degrade MO in the presence of H2O2 (Figs. 4e and f, Fig. S7 in Supporting information). It was noted that after adding H2O2, the removal rate of MO by Fe-N-CNS was significantly higher than that without H2O2, and the removal effect was considerably higher than 91% only at 160 min. This indicated that the peroxidase-like activity of Fe-N-CNS enhanced the degradation of MO when hydrogen peroxide was added.
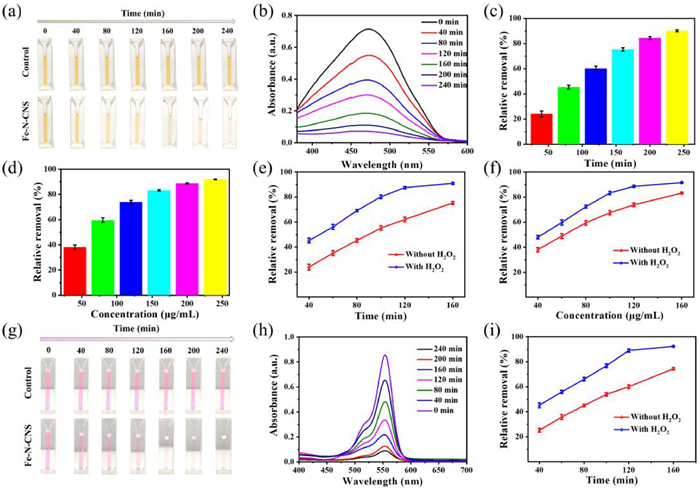
To further demonstrate the removal of organic pollutants by Fe-N-CNS nanozymes, RhB was used as a model substrate. As shown in Figs. 4g and h, similar to the removal of MO, the color change of the supernatant solution and the decrease of the absorption intensity both proved that Fe-N-CNS almost completely removed RhB. A 90% removal effect was obtained when the consumption time was 240 min (Fig. S8a in Supporting information). In addition, the removal of RhB was examined with increasing Fe-N-CNS concentration (Figs. S8b and c in Supporting information) and with the presence or absence of H2O2 (Figs. S8d-f in Supporting information). As shown in Fig. 4i, the removal rate was better in the presence of H2O2. These results indicated that Fe-N-CNS was an effective synergistic adsorption method for dye degradation. The performance of Fe-N-CNS for dye removal was more prominent in the presence of H2O2.
Besides its efficient enzyme-like catalytic activity, Fe-N-CNS has intrinsic magnetic properties and moderate electrical conductivity. Consequently, Fe-N-CNS could also serve as an efficient electromagnetic wave absorption agent. As a functional material, the electromagnetic wave-absorbing coating material has the advantages of a simple fabrication method, low cost, and selective design. It can reduce the problem of electromagnetic pollution in the environment and improve the stealth performance of weapons and equipment on the battlefield. The research and application of magnetic wave-absorbing coating materials have become a hot topic [33,34]. As shown in Scheme 1, Fe-N-CNS had good electrical conductivity due to its graphene-like layer structure, which was easy to form a conductive network inside the material. In addition, it had a large specific surface area, which resulted in multiple reflections and scattering of electromagnetic waves. The ferromagnetic nanoparticles loaded in Fe-N-CNS are magnetic, which greatly impedes matching and loss. And the multilayer structure of Fe-N-CNS made electromagnetic waves easily multiple scattering and polarized at its interface.
The nitrogen-doped carbon material existed close to the Fermi energy level of the donor energy level; thus, the carbon material had metallic properties. The doping of nitrogen atoms into the graphite lattice significantly improved the electrical conductivity of carbon materials as electron donors. The electrical conductivity of carbon materials was highly dependent on the density of states in the Fermi level (D(EF)), and nitrogen atom doping increased the graphite lattice defects, which caused an increase in the D(EF), which in turn increased the electrical conductivity of the material [35]. Ideally, the conductivity increased as D(EF) increased according to the relation given by Eq. 4 [36],
|
|
(4) |
where e0 is the electronic charge, K is the Boltzmann constant, T is the temperature, and µ is defined as the mobility of the electronic state at the Fermi energy level.
Fig. 5a showed that at the Fermi energy level (E − EF = 0 eV), the conductivity of N-pyridine and N-graphene was significantly higher than that of graphene, which agreed with the results already reported [35]. Meanwhile, to demonstrate the magnetic properties of Fe-N-CNS material, an ordinary magnet was used to attract the material inside the container to one side (Fig. S10 in Supporting information). At the same time, the N-CNS alone does not move, which indicates that Fe-N-CNS had good magnetic properties [37]. This result was further demonstrated by the vibrating sample magnetometer (VSM) data. As shown in Fig. 5b, the hysteresis line of N-CNS was horizontal, while Fe-N-CNS was a typical superparamagnetic curve [38]. Then, the absorbing properties of 50 wt% of Fe-N-CNS/paraffin were investigated. As shown in Fig. 5c, the maximum absorption peak was −37.33 dB (8.30 GHz) at 1.5 mm, and the adequate absorption bandwidth (fe) was 2.33 GHz (7.08–9.41). The broadest sufficient absorption bandwidth (fe) yielded a 6.73 GHz (9.44–16.17) GHz at 1 mm thickness with a maximum reflection loss of −33.39 dB (11.41 GHz). This strongly suggested that Fe-N-CNS was an excellent wave-absorbing material. Obviously, by analyzing the dielectric loss tangent and magnetic loss tangent of Fe-N-CNS (Figs. 5h and i), its dielectric loss tangent was between 0.05 and 5.56, which was more significant than the magnetic loss tangent value (1.24–0.49), so the electromagnetic absorption of Fe-N-CNS mainly came from the dielectric loss. Electric current is conducted in Fe-N-CNS, creating a stable conductive network. Conduction losses due to current transfer facilitate the dissipation of electromagnetic energy. Multi-walled carbon nanosheets of Fe-N-CNS have a hierarchical porous structure, which can cause multiple reflections and scattering of electromagnetic waves, prolonging the propagation path of electromagnetic waves and effectively attenuating more electromagnetic wave energy. Dipole orientation polarization is enhanced by N self-doping in Fe-N-CNS as polarization centers. The ε′ and ε″ of Fe-N-CNS showed some vibrational peaks (Fig. 5d), and there were several Debye cycles (Fig. 5e), indicating that these relaxations might stem from the interfacial polarization, dipole polarization, defects, and disordered carbon. This phenomenon was mainly because the polarization of electrons in the molecule cannot keep up with the change in the frequency of the electromagnetic field, which implied that multi-polarization relaxation processes occurred in multi-walled carbon nanosheets in an alternating electromagnetic field [39]. The composite permeability (μ′ and μ″) decreased with the increase in frequency (Fig. 5f). And according to the variation of C0 (C0 = μ″(μ′)−2f−1) value with frequency (Fig. 5g), the eddy current loss effect was further excluded, and its loss mainly came from natural resonance and exchange resonance [18]. Overall, Fe-N-CNS material was an effective electromagnetic wave-absorbing material with various electromagnetic dissipation mechanisms.

In summary, a novel, cost-effective and sustainable synthetic method for the preparation of ferromagnetic nanoparticles deposited on nitrogen-doped porous graphene-like carbon nanosheets using silk protein as the nitrogen and carbon source and FeCl3 as the iron source is demonstrated. Due to their graphitic structures, N-doping, and ferromagnetic nanoparticles, the silk-derived Fe-N-CNS can serve as highly efficient mimics of both peroxidase and oxidase, which can induce the conversion of O2 and H2O2 to superoxide anion radical and hydroxyl radical, respectively. Consequently, the Fe-N-CNS can effectively remove MO and RhB in the presence of H2O2 via synergistic adsorption and degradation. The removal efficiencies for both dyes are over 90%. On the other hand, Fe-N-CNS possess intrinsic magnetism and good electrical conductivity, thus exhibiting excellent electromagnetic wave absorption properties. The maximum RL of Fe-N-CNS achieves −37.33 dB at 8.30 GHz with a thickness of 1.5 mm, and the adequate absorption bandwidth (RL ≤ −10 dB) was 6.73 GHz (9.44–16.17 GHz), corresponding to a thickness of 1 mm. This study provides new ideas for silk-based multifunctional materials to remediate dye-induced and electromagnetic-induced environmental problems.
The authors declare that they have no conflict of interest.
This research was funded by the National Nature Science Foundation (Nos. 21901110, 52001265 and 12274356), Natural Science Foundation of Fujian Province (No. 2021J01847), Fujian Provincial Department of Education Fund (No. JAT190337), Fujian Provincial Department of Science and Technology (No. 2019J06001), the Open Fund of Xiamen Key Laboratory of Marine Corrosion and Smart Protective Materials, and the 111 Project (No. B16029).
Supplementary material associated with this article can be found, in the online version, at doi:
D.M. He, M.M. Yan, P.J. Sun, et al., Chin. Chem. Lett. 32 (2021) 2994–3006. doi: 10.1016/j.cclet.2021.03.078
Y.J. Song, K.G. Qu, C. Zhao, J.S. Ren, X.G. Qu, Adv. Mater. 22 (2010) 2206–2210. doi: 10.1002/adma.200903783
J.Y. Zhang, S.H. Wu, L.G. Ma, P. Wu, J.W. Liu, Nano Res. 13 (2020) 455–460. doi: 10.1007/s12274-020-2629-8
X.L. Ren, J. Liu, J. Ren, F.Q. Tang, X.W. Meng, Nanoscale 7 (2015) 19641– 19646. doi: 10.1039/C5NR04685H
W.K. Kim, W.H. Ryu, D.W. Han, et al., ACS Appl. Mater. Interfaces 6 (2014) 4731–4736. doi: 10.1021/am405335k
S.Y. Luo, M. Sha, F. Tian, et al., Chin. Chem. Lett. 33 (2022) 344–348. doi: 10.1016/j.cclet.2021.06.018
G.H. Tang, J.Y. He, J.W. Liu, X.Y. Yan, K.L. Fan, Exploration 1 (2021) 75–89. doi: 10.1002/EXP.20210005
P. Kannan, T. Maiyalagan, N.G. Sahoo, M. Opallo, J. Mater. Chem. B 1 (2013) 4655–4666. doi: 10.1039/c3tb20923g
R. Langer, P. Błonski, C. Hofer, et al., ACS Appl. Mater. Interfaces 12 (2020) 34074–34085. doi: 10.1021/acsami.0c07564
W.H. Shin, H.M. Jeong, B.G. Kim, J.K. Kang, J.W. Choi, Nano Lett. 12 (2012) 2283–2288. doi: 10.1021/nl3000908
Y. Xu, W.G. Tu, B.W. Zhang, et al., Adv. Mater. 29 (2017) 1605957. doi: 10.1002/adma.201605957
K.L. Fan, J.Q. Xi, L. Fan, et al., Nat. Commun. 9 (2018) 1–11. doi: 10.1038/s41467-017-02088-w
X.G. Liu, S.L. Ran, J.Y. Yu, Y.P. Sun, J. Alloys Compd. 765 (2018) 943–950. doi: 10.1016/j.jallcom.2018.06.292
Y. Lin, J.J. Dai, H.B. Yang, L. Wang, F. Wang, Chem. Eng. J. 334 (2018) 1740–1748. doi: 10.1016/j.cej.2017.11.150
Y.C. Wang, W.L. Wang, J. Sun, et al., Carbon 135 (2018) 1–11. doi: 10.1016/j.carbon.2018.04.026
L. Wang, B. Wen, X.Y. Bai, C. Liu, H.B. Yang, J. Colloid Interface Sci. 540 (2019) 30–38. doi: 10.1016/j.jcis.2018.12.111
S. Qiu, H.L. Lyu, J.R. Liu, et al., ACS Appl. Mater. Interfaces 8 (2016) 20258–20266. doi: 10.1021/acsami.6b03159
X. Zhang, J. Qiao, Y.Y. Jiang, et al., Nano-Micro Lett. 13 (2021) 1–31. doi: 10.1007/s40820-020-00525-y
X.Q. Xiong, Y.H. Tang, C.J. Xu, et al., Small 16 (2020) 2004129. doi: 10.1002/smll.202004129
C.Y. Wang, W.X. Chen, K.L. Xia, et al., Small 15 (2019) 1804966. doi: 10.1002/smll.201804966
X.R. Liu, M. Zhang, D.N. Yu, et al., Electrochim. Acta 215 (2016) 223–230. doi: 10.1016/j.electacta.2016.08.091
Y.Q. Zhu, W.M. Sun, J. Luo, et al., Nat. Commun. 9 (2018) 1–9. doi: 10.1038/s41467-017-02088-w
A.C. Ferrari, J.C. Meyer, V. Scardaci, et al., Phys. Rev. Lett. 97 (2006) 187401. doi: 10.1103/PhysRevLett.97.187401
X.Y. Qiu, X.H. Yan, H. Pang, et al., Adv. Sci. 6 (2019) 1801103. doi: 10.1002/advs.201801103
Q.C. Wang, Y.P. Lei, Z.Y. Chen, et al., J. Mater. Chem. A 6 (2018) 516–526. doi: 10.1039/C7TA08423D
W.J. Jiang, L. Gu, L. Li, et al., J. Am. Chem. Soc. 138 (2016) 3570–3578. doi: 10.1021/jacs.6b00757
P.T. Liu, D.Q. Gao, W. Xiao, et al., Adv. Funct. Mater. 28 (2018) 1706928. doi: 10.1002/adfm.201706928
H. Wei, E.K. Wang, Chem. Soc. Rev. 42 (2013) 6060–6093. doi: 10.1039/c3cs35486e
S.C. Lin, Y.H. Zhang, W. Cao, et al., Dalton Trans. 48 (2019) 1993–1999. doi: 10.1039/C8DT04499F
G. Crini, Bioresour. Technol. 97 (2006) 1061–1085. doi: 10.1016/j.biortech.2005.05.001
E. Forgacs, T. Cserháti, G. Oros, Environ. Int. 30 (2004) 953–971. doi: 10.1016/j.envint.2004.02.001
J.B. Liu, S.H. Fu, B. Yuan, Y.L. Li, Z.X. Deng, J. Am. Chem. Soc. 132 (2010) 7279–7281. doi: 10.1021/ja100938r
Y. Zhang, Y. Huang, T.F. Zhang, et al., Adv. Mater. 27 (2015) 2049–2053. doi: 10.1002/adma.201405788
J. Liu, H.B. Zhang, R.H. Sun, et al., Adv. Mater. 29 (2017) 1702367. doi: 10.1002/adma.201702367
J.D. Wiggins-Camacho, K.J. Stevenson, J. Phys. Chem. C 113 (2009) 19082–19090. doi: 10.1021/jp907160v
H. Gerischer, J. Phys. Chem. B 89 (1985) 4249–4251. doi: 10.1021/j100266a020
A.G. Kolhatkar, A.C. Jamison, D. Litvinov, R.C. Willson, T.R. Lee, Int. J. Mol. Sci. 14 (2013) 15977–16009. doi: 10.3390/ijms140815977
P. Miao, K.Y. Cheng, H.Q. Li, et al., ACS Appl. Mater. Interfaces 11 (2019) 17706–17713. doi: 10.1021/acsami.9b03944
L.W. Jiang, Z.H. Wang, D.Y. Geng, et al., J. Phys. Chem. C 120 (2016) 28320–28329. doi: 10.1021/acs.jpcc.6b09445

Scheme 1 (a) Schematic diagram of the fabrication of Fe-N-CNS. (b) Schematic diagram of the properties of as-prepared Fe-N-CNS and their applications in synergistic dye removal and electromagnetic wave absorption.

Figure 1 Structure characterization for Fe-N-CNS. (a) TEM image of Fe-N-CNS. (b) XRD patterns of Fe-N-CNS and N-CNS. (c) FTIR spectra of Fe-N-CNS and N-CNS. (d) Raman spectra of Fe-N-CNS. The XPS spectra of Fe-N-CNS: (e) Survey spectra, (f) Fe 2p, (g) C 1s, (h) N 1s and (i) O 1s.

Figure 2 The photothermal effect of Fe-N-CNS. (a) Photothermal images and (b) the temperature curve of Fe-N-CNS solution with different concentrations under laser irradiation (2 W/cm2, 808 nm). (c) Temperature curves of Fe-N-CNS solution (0.2 mg/mL) at different power densities (0.5–2 W/cm2). (d) The relationship between time and −lnθ during the cooling process of Fe-N-CNS solution (0.2 mg/mL).

Figure 3 The oxidase-mimicking and peroxidase-mimicking activity of Fe-N-CNS. (a) Schematic illustration of the oxidase-like activity. (b) Absorbance spectra and color of TMB with different treatments: 1) TMB solution as control, 2) Fe-N-CNS. Insert showed the color change of different samples. (c) Double-reciprocal plots of oxidase-like activity of Fe-N-CNS at a fixed concentration of TMB. (d) Electron spin resonance spectra of DMPO/Fe-N-CNS and DMPO. (e) Schematic illustration of the peroxidase-like activity. (f) Absorbance curves of TMB solutions under different conditions: 1) TMB solution as control, 2) H2O2, 3) Fe-N-CNS + H2O2. Insert showed the color change of different samples. (g) Double-reciprocal plots of oxidase-like activity of Fe-N-CNS at a fixed concentration of H2O2. (h) Double-reciprocal plots of oxidase-like activity of Fe-N-CNS at a fixed concentration of TMB. (i) ESR spectra of DMPO, DMPO/H2O2 and DMPO/H2O2/ Fe-N-CNS.

Figure 4 Removal performance for MO and RhB of Fe-N-CNS. The change in (a) color, (b) absorbance and (c) removal performance of MO solution (0.01 mg/mL) by adding Fe-N-CNS (0.02 mg/mL) after various reaction time (40–240 min). (d) Concentration-dependent removal performance of MO solution (0.01 mg/mL) by the constant reaction time of 40 min. The compare of (e) time-dependent and (f) concentration-dependent removal performance of MO solution (0.01 mg/mL) by adding Fe-N-CNS (0.02 mg/mL) in the presence or absence of H2O2 (100 mmol/L). The change in (g) color and (h) absorbance of RhB solution (0.01 mg/mL) by adding Fe-N-CNS (0.02 mg/mL) after various reaction times (40–240 min). (i) The comparison of time-dependent removal performance of RhB solution (0.01 mg/mL) by adding Fe-N-CNS (0.02 mg/mL) in the presence or absence of H2O2 (100 mmol/L).

Figure 5 Electromagnetic properties and electromagnetic wave absorption performance of Fe-N-CNS. (a) Simulation of the conductivity of graphite structures for different chemical environments. (b) Hysteresis loop of Fe-N-CNS and N-CNS. (c) Calculated reflection loss vs. frequency results for Fe-N-CNS (50 wt%) with different thicknesses. (d) The real part (ε′) and imaginary part (ε″) of complex permittivity. (e) The ε′-ε″ curve. (f) The real part (μ′) and imaginary part (μ″) of complex permeability. (g) The C0 curve. (h) Dielectric loss (tanδε). (i) Magnetic loss (tanδμ).

 扫一扫看文章

扫一扫关注我们
 DownLoad:
 下载:
下载: