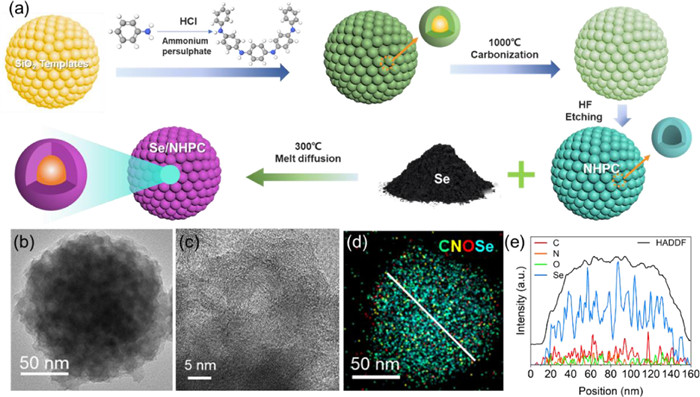
Figure 1.
(a) Synthetic procedures of Se/NHPC sample. (b, c) TEM images of Se/NHPC. (d) The combining elements mapping image of Se/NHPC. (e) Linear elemental distribution diagram of Se/NHPC.
Advanced all-solid-state lithium-selenium batteries enabled by selenium-nitrogen doped hierarchic meso-microporous carbon nanospheres composite cathode
Chongxing Li , Renbo Liu , Shuxian Zhang , Qingyu Li , Cong Wang , Zhiwei Zhang , Chengxiang Wang , Longwei Yin , Rutao Wang

With the rapid development of electric vehicles and large-scale stationary energy storage systems in recent years, lithium ion based rechargeable batteries with versatile properties in high energy density, long-term cycling life, and low cost are in high demand. Conventional cathode materials including LiCoO2, LiFePO4 and Li1+x(Ni1−y−zCoyMnz)1−xO2(NCM), however, cannot stratify these demands due to their inherent limitations of low specific capacities [1-3]. Sulfur (S) cathode has received great attention due to its extremely high energy density (2570 Wh/kg) and low cost [4]. Nevertheless, the practical applications of Li-S batteries are impeded by the critical issues including the insulting nature of S (10−30 S/cm at 25 ℃) and the intractable shuttle effects caused by the high solubility of polysulfides. Selenium, an element in the chalcogen group, which has a similar (de)lithiation mechanism with S, is attracting growing interest mainly associated with its desirable merits [5]. Although the theoretical specific capacity of selenium (675 mAh/g) is lower than that of S (1675 mAh/g), its high density (4.82 g/cm3) ensures a high volumetric energy density (3253 mAh/cm3, or 1621 mAh/cm3 based on Li2Se) which is comparable to that of S (3467 mAh/cm3, 2.07 g/cm3) [6]. In addition, the electronic conductivity of Se is 1 × 10⁻⁵ S/cm, yet almost 25 orders higher than that of S, potentially enabling Li-Se batteries with higher active material utilization and better rate capability [7]. Moreover, Se has a higher melting point (221 ℃) than S (115 ℃), enabling a safer battery at elevated temperatures. Therefore, Se should be an attractive alternative cathode material for building next generation recharge batteries.
Since a pioneer work on demonstrating the feasibility of Li-Se battery prototype worked in carbonate electrolyte under room temperature in 2012 [8], substantial progress has been made in Li-Se batteries [9]. Nevertheless, Se cathode still undergoes several troublesome problems including the sluggish kinetics of the solid-state diffusion, a shuttle effect of polyselenides, and the large volume change (> 98%) between Se and Li2Se in carbonate-based electrolytes, thus resulting in low active material utilization and poor cycling life. To circumvent these issues, extensive efforts have been made to design a porous carbon matrix for effective accommodation and regulation of Se species. Many novel Se/C composites have been developed to achieve a better performance in rate capability and cycling stability, however, with a further sacrifice of volumetric/gravimetric capacities due to the relatively low Se loading in the cathode (< 60 wt%). In addition, the shuttle effect of soluble polyselenides cannot be well solved when using liquid electrolytes. Hence, inflammable solid-state electrolytes (SSEs) were considered a choice to eliminate the soluble polyselenide shuttle with the coupons of suppressing lithium dendrite growth and solving the safety issues in leakage and combustion. Many novel SSEs, such as Li1.5Al0.5Ge1.5(PO4)3 [10], Li3PS4 [11], Li10GeP2S12 [12] and gel polymer electrolytes [13], had been explored to fabricate all-solid-state Li-Se batteries (ASSLSBs) which showed the highly reversible capacity. However, the large stress/strain and interfacial resistance caused by the stiffness of SSEs and the relatively low ionic conductivity of SSEs limit the rate and/or cycling performance of ASSLSBs under a high Se loading. It is essential to further exploration of higher ionic conductive SSEs combined with developing novel Se hosts with high Se loadings. In addition, the underlying mechanism of the electrochemical reaction between Se molecules and Li under a solid-state electrolyte system remains unclear to date.
Herein, we developed a Se-infused nitrogen-doped hierarchical meso-microporous carbon (denoted as NHPC) composites (Se/NHPC) through a melt-diffusion process. Thanks to the highly and uniformly porous structure of NHPC, Se is infused into the meso-micropores of NHPC uniformly with a high Se mass loading of 81%. ASSLSBs employing Se/NHPC as the cathode and Li6PS5Cl solid-state electrolyte (SSE) exhibits a high reversible capacity of 621 mAh/g (92% of theoretical capacity) at a current density of 20 mA/g and the good cycling stability with a capacity retention of 80.9% at 120 mA/g after 100 cycles. The mechanism of capacity decay is systematically studied, which is mainly related to interfacial degradation and the separation of Se from the carbon substrate, as confirmed by data from electrochemical impedance spectra (EIS), ex-situ Raman, and X-ray photoelectron spectroscopy (XPS) analysis.
Se-NHPC cathode was prepared through a melt-diffusion method as illustrated in Fig. 1a. NHPC was prepared by a templated method according to previous reports [14,15]. Typically, NHPC was prepared first using polyaniline as nitrogen-doped carbon precursor and SiO2 as the template by the in-situ assembly and then carbonization. With further acid etching, NHPC with uniformly nanospherical morphology structure was achieved. Fig. S1 (Supporting information) shows that NHPC nanospheres have the ordered mesoporous structure with an average size of 136 nm and a pore diameter of around 10 nm. Then, Se/NHPC composite was achieved via a melt-diffusion method at 300 ℃ (higher than the melting point temperature (217 ℃) of Se) from a hand-milled mixture of Se powder and NHPC sealed into a glass tube. SEM (Fig. S2 in Supporting information) and TEM images (Figs. 1b-d) show that Se/NHPC composite maintains the nanospherical morphology of NHPC. A high-resolution TEM image (Fig. 1c) shows that amorphous Se was uniformly distributed into the carbon matrix of NHPC, which is also confirmed by the selected area electron diffraction (SAED) pattern (Fig. S3 in Supporting information) and energy dispersive X-ray spectrometry (EDS) mapping (Figs. 1d and e, Fig. S4 in Supporting information).
Fig. 2a displays XRD patterns of Se, NHPC and Se/NHPC. Se powder shows several diffraction peaks which can be assigned to hexagonal Se (JCPDS No. 73-0465). XRD pattern of the as-prepared NHPC shows broad peaks at around 22° and 43°, corresponding to the characteristic peaks of graphitic carbon (002) and (100) diffraction, respectively. After Se is infused into NHPC, all of the diffraction peaks of hexagonal Se disappear, indicating the homogenous dispersion of amorphous Se in NHPC, which is consistent with TEM observation. Raman spectra of Se show two vibrational modes at 142 and 235 cm−1 (Fig. 2b). The peak at 142 cm−1 represent Se12 with ring structure, while the peak at 235 cm−1 is associated with the trigonally crystal-line Se chain structure (t-Se) [16,17]. Interestingly, Raman spectra of Se/NHPC exhibit one prominent peak around 245 cm−1 associated with the amorphous Se (polymer-like chains, c-Sen) and two broad peaks around 1340 and 1585 cm−1 associated with D and G bands of amorphous carbon, respectively [17].
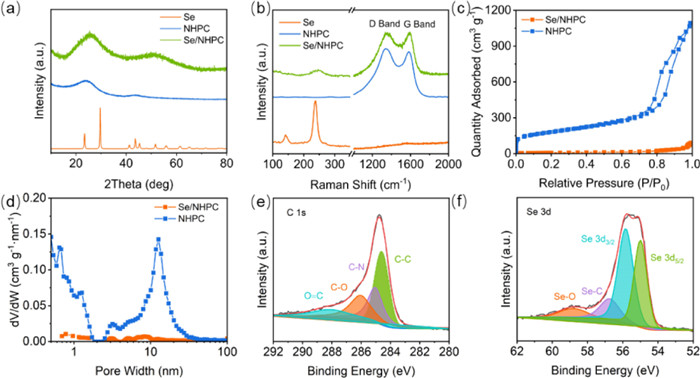
The nitrogen adsorption/desorption curve of NHPC shows type Ⅳ isotherms (Fig. 2c), suggesting a hierarchical meso-microporous structure. The calculated Brunauer-Emmett-Teller (BET) surface area and pore volume are 628.8 m2/g and 1.62 cm3/g, respectively. The pore size distribution of NHPC in Fig. 2d further confirms the presence of micropores in 0.5–1.8 nm size range as well as mesopores around 10 nm, suggesting the hierarchical porous architecture of NHPC. After the incorporation of Se, Se/NHPC displays a type-Ⅰ curve, indicating a dramatic decrease in the level of porosity. The specific surface area and pore volume of Se/NHPC are only about 27.9 m2/g and 0.1 cm3/g, which suggests that both micropores and mesopores of NHPC are almost filled with Se. Thermogravimetric analysis (TGA) (Fig. S5 in Supporting information) shows that the mass loading of Se in Se/NHPC is as high as ~81 wt%. To disclose the surface characteristics of the Se/NHPC sample, X-ray photoelectron spectroscopy (XPS) was employed. Full-scale XPS spectra exhibit Se/NHPC samples composed of C, N, O and Se (Fig. S6a in Supporting information). C 1s spectra (Fig. 2e) can be deconvoluted into a peak at 284.6, 285.9, 287.9 and 289.5 eV, corresponding to sp2 carbon, C-N species, C-O bonds and O=C-O, respectively [17]. The existence of nitrogen-containing groups in Se/NHPC is confirmed and analyzed with the high-resolution N 1s spectrum (Fig. S6b in Supporting information). Three characteristic peaks are observed at 400.9, 399.9 and 398.4 eV, corresponding to graphitic, pyrrolic, and pyridinic nitrogen in Se/NHPC [18]. The high-resolution Se 3d XPS spectra plotted in Fig. 2f can be deconvoluted into four peaks around 54.8, 55.7, 57.0 and 58.5 eV. The two peaks around 54.8 eV and 55.7 eV can be attributed to the Se 3d5/2 and Se 3d3/2, respectively, suggesting the existence of elemental Se in the Se/NHPC composite. The other two peaks around 58.5 eV and 57.0 eV may be related to the Se-O and Se-C bonds, respectively, which may arise from the reaction of selenium with oxygen or carbon matrix during the annealing process [19].
To evaluate the electrochemical performances of Se/NHPC, ASSLSBs coupling this cathode with an In-Li anode and Li6PS5Cl solid-state electrolyte (Fig. S7 in Supporting information) were assembled inside a glovebox which is filled with Ar gas. Fig. S8 (Supporting information) shows the CV curves at 0.1 mV/s. The cathodic peak around 1.2 V (vs. In-Li) is attributed to the reduction of Se to Li2Se, corresponding to the reaction Se + 2Li+ + 2e− → Li2Se. Another cathodic peak around 0.7 V (vs. In-Li) may be attributed to the reduction of argyrodite SSE [20]. For the oxidation process, only one peak around 1.8 V (vs. In-Li) was detected. The galvanostatic intermittent titration technique (GITT) at 67.5 mAh/g was carried out to evaluate the diffusion coefficient Li+ (DLi) in the Se/NHPC electrode. As shown in Fig. 3a, only one plateau can be observed after full relaxation, which indicates a one-step solid-solid phase transition between Se and Li2Se during the discharge/charge process [11]. The DLi value can be calculated by solving Fick's second law based on the GITT potential curves. During the discharge process, the DLi value drops rapidly until 1.5 V (vs. In-Li), then raises slightly until reaching cutoff voltage. A similar trend of diffusion kinetics is observed during the charging process. After the voltage reaches 2 V (vs. In-Li), the internal resistance (IR) drop becomes large, resulting in a significant fluctuation in the DLi value. Overall, the DLi values for Se/NHPC cathode fall in between 2.62 × 10⁻¹¹ cm2/s and 1.0 × 10⁻¹⁴ cm2/s, suggesting the fast Li+ diffusion in Se/NHPC electrode.

The typical charge/discharge curves under the different current densities ranging from 20 mA/g to 200 mA/g are plotted in Fig. 3b. The discharge/charge curves exhibit one predominant plateau corresponding to the redox reaction between Se and Li2Se, which is consistent with CVs observations. The specific capacities of Se/NHPC are calculated to be 621.3, 531.1, 454.6, 387.1 and 237.2 mAh/g, corresponding to the charge/discharge current densities of 20, 40, 80, 120, 160 and 200 mA/g, respectively. The coulombic efficiency values are close to 100% throughout the rate-test process (Fig. 3c). The cycling performance of this ASSLSB at a rate of 120 mA/g is shown in Fig. S9 (Supporting information). Even after 100 cycles, this ASSLSB still delivers a specific capacity of 295.3 mAh/g with a capacity retention value of 80.9%. During the whole cycling, the coulombic efficiency values are approximately 100%. By comparison, this ASSLSB shows higher capacity performance than that of Li-Se batteries based on Se/NHPC cathode using a Li+ containing liquid organic electrolyte (Fig. S10 in Supporting information), which is probably caused by that solid-state electrolyte plays a role as a physical separation barrier on the dissolved polyselenide.
To further probe the interfacial change of this ASSLSB, EIS spectra were collected as a function of the state of the initial charge/discharge process. The achieved Nyquist plot was fitted with the equivalent circuit (R₁(R₂Q₁)(R₃Q₂)Q₃) shown in Fig. S11 (Supporting information). All the Nyquist plots of the Se/NHPC electrodes during the initial discharing/charging process achieved at different lithiated states in Figs. 3d and e have two semicircles in the high-frequency region and medium-frequency region, which can be ascribed to In/InLi|SE anode interface (R₂Q₁) the and the SE|Se-NHPC cathode interface (R₃Q₂), respectively [21-23]. During the initial charge/discharge process, the R₂ values show no apparent change, suggesting the stable InLi|SE anode interface (Fig. S12a and Table S1 in Supporting information). While the interfacial resistance of the SE|Se-NHPC cathode increases significantly during the initial discharging process which may be ascribed to the formation of the insulating Li2Se [24,25]. During the charging process, the interfacial resistance of the SE|Se-NHPC cathode rapidly decreases and then tends to stay stable with the increased cell potential (Fig. S12b and Table S1 in Supporting information). Notably, the Nyquist plots are nearly kept the same before and after the initial discharge/charge cycle, which further verifies the highly reversible reaction of this ASSLSB. EIS spectra were further employed to probe the degradation at the interface of these ASSLSBs during the cycling (Fig. 3f). The achieved Nyquist plots were also fitted with the equivalent circuit (R₁(R₂Q₁)(R₃Q₂)Q₃) shown in Fig. S10. Both the resistances of In/InLi|SE and SE|Se-NHPC increase significantly during the long-term cycling (Fig. S13 and Table S2 in Supporting information), which may be associated with unstable interfaces of In/InLi|SE and SE|Se-NHPC [22,23,26,27].
To further understand the degradation mechanism of this ASSLSB, a series of ex-situ measurements, such as XRD and XPS were performed on the cell after the cycling process. Fig. S14 (Supporting information) shows ex-situ XRD patterns of Se-NHPC cathode side obtained at the original state and after the 100th cycle. In the pristine state, XRD patterns mainly have several peaks which can be assigned to the Li6PS5Cl electrolyte. After the long-term cycling, the XRD pattern shows no change, indicating the stability of the Li6PS5Cl electrolyte. Fig. S15 (Supporting information) shows the Se 3d XPS spectra of the Se-NHPC cathode side obtained after the 100th cycle. The intensity of the peak position of Se XPS peaks at the low binding energy area change after the long-term cycling. The high-resolution Se 3d XPS spectra show that the pristine peaks assigned to Se-C and Se-O bonds disappear after the cycling, replaced by only one peak as-signed to Se 3d3/2 and Se 3d5/2. This may be associated with the reduction of selenium-containing oxides and the weakened interaction between Se and carbon matrix. In addition, Se 3d spectra shifts negatively about 0.7 eV during the initial discharge process, which may be caused by the formation of Li2Se, which is consistent with XPS results from other report [28]. While in the followed charge process, the Se 3d spectra is little changed compared to initial discharged state, which may be due to the incomplete delithiation process. After long cycles, the Se 3d spectra shift positively about 0.2 eV, which may be related to the formation of Se. Ex-situ Raman was further employed to probe the structural change of Se in composite during the cycling. Raman spectra in Fig. 4a show that after the potential down to 0.4 V, amorphous Se composed of disordered Se chains (c-Sen) reacts with Li to form Li2Se as indicated by the reduced density of Se peak which slightly shits to a high value of ~260 cm−1 [28]. After the potential charges back to 2.4 V, the Se peak will not return to the pristine position, but continue to shift to a high value of 267 cm−1, suggesting that the main state of Se in the composite is isolated Se8 rings (r-Se8). As we know, the binding between r-Se8 and carbon matrix is weak, thus the Se detaching from NHPC is possible [29,30]. Therefore, after the long cycles, r-Se8 are mainly transformed into t-Se which can be inferred from the Raman shift of the product at 238 cm−1 [17]. A weak peak appears around 260 cm−1, indicating a few residual Li2Se after long cycles. SEM and EDS characterizations were performed on the surface of Se-NHPC cathode before and after cycling. Compared to the homogenous distribution of the Se atom in the Se-NHPC cathode before the cycling (Fig. 4b), unevenly distributed Se strips or particles could be found after the cycling (Fig. 4c and Figs. S16-S18 in Supporting information), which suggests that Se is detached from Se-NHPC composite and then enriched on the surface of the cathode. The enrichment of Se may lead to the low utilization of Se, which may be the main reason for the capacity decay of these ASSLSBs.
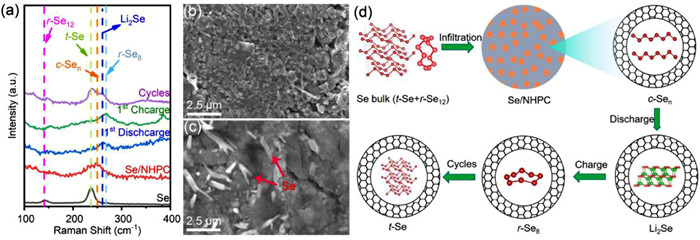
Combining with the Raman and XPS results, we proposed a reaction mechanism of Se in Se/NHPC cathode during the charging and discharging process, which is illustrated in Fig. 4d. Typically, the commercial Se is composed of r-Se12 and t-Se, which will be mainly transformed into amorphous Se (mainly composed by disordered c-Sen after being composited with NHPC. During the discharge process, Se will be reduced into Li2Se. After the charging process, Li2Se is mainly converted to r-Se8. Because of the weak interaction between r-Se8 and carbon substrate, Se would be detached from NHPC, thus leading to the agglomeration of Se into t-Se particles in Se/NHPC cathode and further reducing the utilization of Se. The reaction mechanism of Se in Li6PS5Cl electrolyte-based ASSLSBs is different from liquid electrolyte-based Li-Se batteries in which r-Se8 is converted to c-Sen after the long-term cycling process [16,31].
In conclusion, we have confined amorphous Se in nitrogen-doped hierarchical meso-microporous carbon with a high mass loading of 81%. ASSLSBs using Se/NHPC as the cathode, a Li-In alloy as the anode, and Li6PS5Cl as the solid-state electrolyte, show a highly reversible capacity of 621 mAh/g (92% of theoretical capacity) at a current density of 20 mA/g and high cycling stability (80.9% capacity retention after 100 cycles at 120 mA/g). The superior electrochemical performance of the Se/NHPC cathode is ascribed to the high Se loading provided by the meso-micropores-rich carbon structure and the excellent stability of solid-state electrolytes. The slight degradation of ASSLSBs performance may be associated with the increase in interfacial resistance, as suggested by the continuous increase of interfacial resistance during the electrochemical cycling. We further observe the conversion of the molecules from amorphous Se in pores of NHPC into r-Se8 after the electrochemical cycling. The weak interaction between r-Se8 and carbon substrate results in the Se detached from pores of NHPC and enriched on the surface of Se-NHPC cathode, thus leading to capacity decay during the cycling. Moreover, owing to the high mass loading of Se in the Se/NHPC composite and the flexibility of synthesizing method of Se/NHPC composite, which will work as a new cathode candidate for high-performance solid-state rechargeable batteries.
The authors have no conflict of interest.
This work was supported by the National Natural Science Foundation of China (Nos. 51902188, 52272224), Innovation Capacity Improvement Project of Small and Medium-Sized Technology-Based Enterprise of Shandong Province (No. 2021TSGC1149), Youth Innovation Team Project of Shandong Provincial Education Department (No. 10000082295015), and Natural Science Doctoral Foundation of Shandong Province (No. ZR2019BEM019), the Future Program for Young Scholar of Shandong University.
Supplementary material associated with this article can be found, in the online version, at doi:
X. Han, S. Wang, Y. Xu, et al., Energy Environ. Sci. 14 (2021) 5044-5056. doi: 10.1039/d1ee01494c
X. Han, W. Zhou, M. Chen, et al., J. Energy Chem. 67 (2022) 727-735. doi: 10.1016/j.jechem.2021.11.021
X. Han, W. Zhou, M. Chen, et al., Nano Res. 15 (2022) 6156-6167. doi: 10.1007/s12274-022-4242-5
C. Zhao, G.L. Xu, Z. Yu, et al., Nat. Nanotech. 16 (2021) 166-173. doi: 10.1038/s41565-020-00797-w
X. Zhao, L. Yin, T. Zhang, et al., Nano Energy 49 (2018) 137-146. doi: 10.1016/j.nanoen.2018.04.045
F. Zhang, X. Guo, P. Xiong, et al., Adv. Energy Mater. 10 (2020) 2000446. doi: 10.1002/aenm.202000446
J. He, W. Lv, Y. Chen, et al., J. Power Sources 363 (2017) 103-109. doi: 10.1016/j.jpowsour.2017.07.065
A. Abouimrane, D. Dambournet, K.W. Chapman, et al., J. Am. Chem. Soc. 134 (2012) 4505-4508. doi: 10.1021/ja211766q
J. Sun, Z. Du, Y. Liu, et al., Adv. Mater. 33 (2021) e2003845. doi: 10.1002/adma.202003845
Y. Zhou, Z. Li, Y.C. Lu, Nano Energy 39 (2017) 554-561. doi: 10.1016/j.nanoen.2017.07.038
X. Li, X. Li, J. Liang, et al., Energy Environ. Sci. 11 (2018) 2828-2832. doi: 10.1039/c8ee01621f
Q. Zhang, L. Cai, G. Liu, et al., ACS Appl. Mater. Interfaces 12 (2020) 16541-16547. doi: 10.1021/acsami.0c01996
X. Gao, X. Yang, S. Wang, et al., J. Mater. Chem. A 8 (2020) 278-286. doi: 10.1039/c9ta10623e
Q. Feng, S. Zhao, Q. Xu, et al., Adv. Mater. 31 (2019) 1901024. doi: 10.1002/adma.201901024
T. Li, J. Zhang, C. Li, et al., Sci. China Mater. 65 (2022) 2363-2372. doi: 10.1007/s40843-021-2047-x
C. Luo, Y. Xu, Y. Zhu, et al., ACS Nano 7 (2013) 8003-8010. doi: 10.1021/nn403108w
R. Lukács, M. Veres, K. Shimakawa, S. Kugler, J. Appl. Phy. 107 (2010) 073517. doi: 10.1063/1.3371813
S. Huang, Z. Li, B. Wang, et al., Adv. Funct. Mater. 28 (2018) 1706294. doi: 10.1002/adfm.201706294
Z. Li, L. Yuan, Z. Yi, Y. Liu, Y. Huang, Nano Energy 9 (2014) 229-236. doi: 10.1016/j.nanoen.2014.07.012
T.K. Schwietert, V.A. Arszelewska, C. Wang, et al., Nat. Mater. 19 (2020) 428-435. doi: 10.1038/s41563-019-0576-0
C. Yu, S. Ganapathy, E.R.H. Van Eck, et al., J. Mater. Chem. A 5 (2017) 21178-21188. doi: 10.1039/C7TA05031C
C. Yu, S. Ganapathy, E.R.H.V. Eck, H. Wang, et al., Nat. Commun. 8 (2017) 1086. doi: 10.1038/s41467-017-01187-y
T.T. Zuo, R. Rueß, R. Pan, et al., Nat. Commun. 12 (2021) 6669. doi: 10.1038/s41467-021-26895-4
R. Prasada Rao, S. Adams, J. Mater. Sci. 51 (2016) 5556-5564. doi: 10.1007/s10853-016-9860-4
H.T. Bui, H. Jang, D. Ahn, et al., Electrochim. Acta 368 (2021) 137556. doi: 10.1016/j.electacta.2020.137556
B.R. Shin, Y.J. Nam, D.Y. Oh, et al., Electrochim. Acta 146 (2014) 395-402. doi: 10.1016/j.electacta.2014.08.139
Y.G. Lee, S. Fujiki, C. Jung, et al., Nat. Energy 5 (2020) 299-308. doi: 10.1038/s41560-020-0575-z
B. Guo, Z. Wang, J. Chen, et al., ACS Nano 16 (2022) 16, 17414-17423. doi: 10.1021/acsnano.2c08558
Y. Dong, P. Lu, Y. Ding, et al., SusMat 1 (2021) 393-412. doi: 10.1002/sus2.26
C. Lu, A. Li, G. Li, et al., Adv. Mater. 33 (2021) 1-13.
C.P. Yang, S. Xin, Y.X. Yin, et al., Angew. Chem. Int. Ed. 52 (2013) 8363-8367. doi: 10.1002/anie.201303147

Figure 1 (a) Synthetic procedures of Se/NHPC sample. (b, c) TEM images of Se/NHPC. (d) The combining elements mapping image of Se/NHPC. (e) Linear elemental distribution diagram of Se/NHPC.

Figure 2 (a) XRD patterns and (b) Raman spectra of Se, NHPC and Se/NHPC. (c) Nitrogen adsorbed/desorbed isotherms. (d) Pore-size distribution curves of NHPC and Se/NHPC. (e) C 1s and (f) Se 3d XPS spectra of Se/NHPC.

Figure 3 Electrochemical performance of ASSLSBs based on Se/NHPC cathode. (a) GITT potential profile of Se/NHPC cathode and the corresponding Li+ diffusion coefficient at respective charge and discharge potentials by GITT method. (b) Charging/discharging curves at the different current densities. (c) Specific capacities under the different discharging current densities. (d, e) Nyquist plots for a Se/NHPC electrode at the initial discharge and charge states, respectively. (f) Nyquist plots of Se/NHPC cathode during long-term cycles. "1st-100th" represent the cycling number.

 扫一扫看文章

扫一扫关注我们
 DownLoad:
 下载:
下载:
