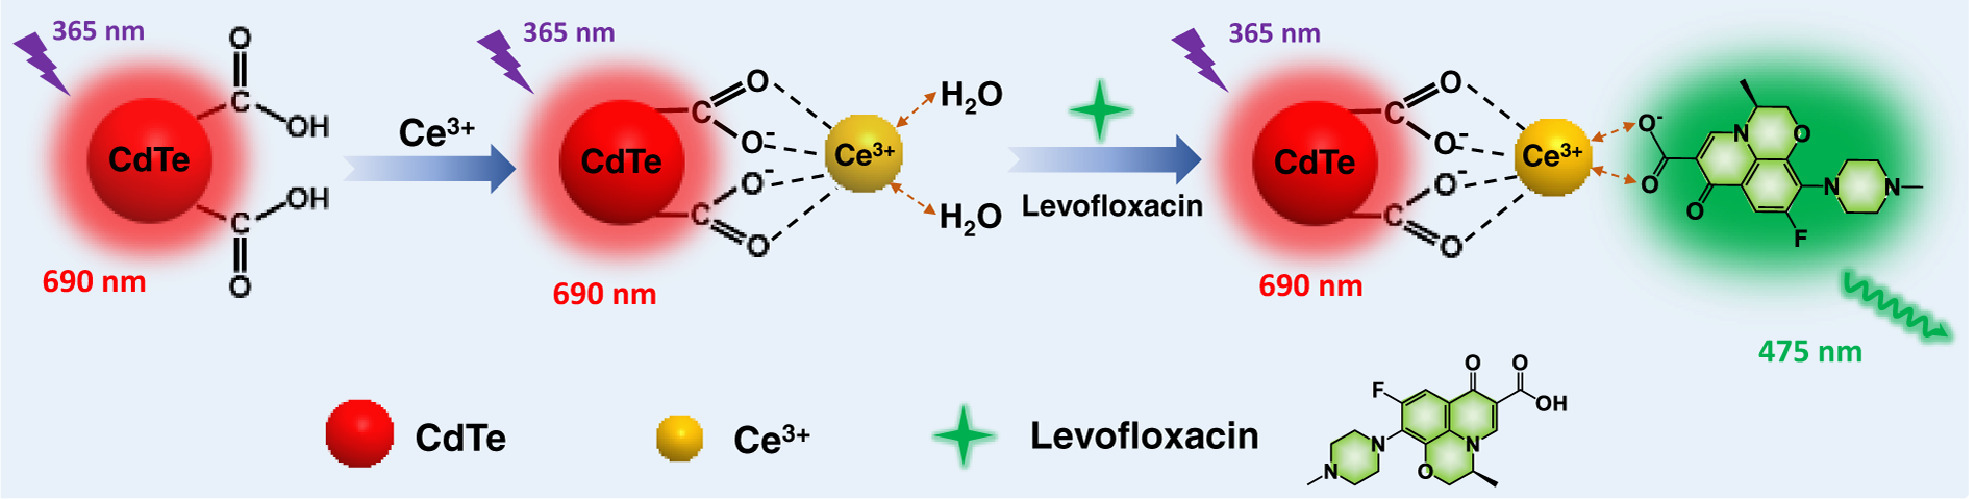
Scheme 1.
Diagram illustration of the sensing mechanism of the Ce/CdTe nanoprobe.
Rare-earth ions coordination enhanced ratiometric fluorescent sensing platform for quantitative visual analysis of antibiotic residues in real samples
Shihao Xu , Lingfei Li , Dan Lin , Liang Yang , Zhenyang Wang , Changlong Jiang

The widespread application of antibiotics has caused food and environmental water safety problems to become increasingly serious [1,2]. Levofloxacin as a representative drug of quinolone antibiotics is also widely used in clinical against various bacterial infections [3-5]. Unfortunately, current treatment technology is unable to recognize antibiotic residues in food and water, resulting in tiny amounts of residues posing health concerns to people being distributed throughout the food chain, including drug resistance [6], and allergic reactions [7], etc. Therefore, there grows an increasing demand for developing and establishing detection methods for multiple antibiotics [8].
Over the past few decades, fluorescence photometry [9,10], liquid chromatography-mass spectrometry [11], chemiluminescence method [12], electrochemical sensor [13] and other analytical methods have been widely used in the detection of levofloxacin residues. Unfortunately, those methods are not suitable for real-time and on-site detection due to their existed disadvantages such as higher cost and technical complexity which [14,15]. Recently, fluorescent nanomaterials and optical sensing have developed rapidly, and fluorescence sensors have proven to be a promising choice for micro-control pollutants determination due to their high sensitivity, selectivity, and visualization [16-18]. Dual-response ratiometric fluorescent sensors provide multicolor changes, which can self-regulate to eliminate fluorescence fluctuations compared to single-emitting fluorescent probes [19]. Chu et al. used a ratiometric fluorescent paper strip integrated with a portable smartphone platform for visual quantitative sensing of thiram [20]. Lin and colleagues proposed a dual-readout OP detection system based on a self-assembled Rhodamine B-Ag@Au nanoprobe nanocomposite [21]. Carbon dots (CDs), quantum dots (QDs), fluorescent dyes, and noble metal have been designed as a novel type of nano-fluorescent probe and are extensively applied in the field of environmental monitoring and chemical phototherapy [22-24].
Quantitative identification is an important goal in realizing real-time monitoring of environmental micro-control pollutants [25]. Compared with traditional detection technology, intelligent portable detection equipment has satisfactory accuracy and sensitivity, and can satisfy the demands of in-situ detection of various residues with lower cost, small size and portability [26,27]. The development of analytical devices deeply relies on sensitive materials, such as aptamers, enzyme, and fluorescent nanomaterials [28,29]. By comparison, the portable paper sensors we fabricated via easy-to-use method for on-site detection by color recognizer application (App) and smartphone with satisfactory sensitivity and selectivity of antibiotic detection.
Remarkably, Lanthanide ions can chelate on the surface of antibiotic structural molecules to form a complex, which can absorb energy and transform into lanthanide ions thus initiating its fluorescence, called the "antenna effect" [30,31]. Different from the spectral characteristics of other ions, the fluorescence of lanthanide ions includes a long fluorescence lifetime, large Stokes shift, clear and unique emission band, etc. [32,33]. By exploiting the linear energy transfer (LET) properties of LVFX and Ce3+, we have developed a new convenient and sensitive system for detecting LVFX based on the fluorescence "light up" mechanism. To construct a proportionate fluorescent nanoprobe for LVFX detection, we utilised red-emitting CdTe QDs as an internal reference and chelated them with Ce3+ [34]. The probe reported here accomplished the response within 10 min, showing a limit of detection (LOD) of 16.3 nmol/L. Moreover, we further utilize a portable smartphone platform formed with cerium-doped ratiometric fluorescent nanoprobe for quantitative visualization of Levofloxacin in water, milk, and raw pork.
Due to the presence of a large number of negatively charged carboxyl groups on the surface of CdTe quantum dots, Ce3+ can undergo a specific strong chelation reaction and be immobilized on the surface of CdTe quantum dots, as shown in Scheme 1. After adding LVFX, LVFX can replace water molecules to coordinate with Ce3+ due to the high coordination strength between LVFX and Ce3+. Due to strong bonding with LVFX, the surface electron distribution of Ce will be shifted and then affect the Ce atom, thus the Ce atom to exhibit a bivalent state. This is attributed to the fact that the core ion Ce3+ is in the d0 electron valence state, which means there are no electrons in the orbit and therefore no CFAE loss. With the continuous addition of LVFX, this fluorescent probe provides a noticeable color variation from red to green. Here, the complex Ce/CdTe QDs exhibit the visual fluorescence linear relationship to LVFX, Ce3+ functions as a specialized recognition unit for LVFX, culminating in green-emitting Ce-LVFX, while the red fluorescence of quantum dots as a reference signal remains unchanged.
Fig. S1A (Supporting information) shows the external morphology and particle size of CdTe quantum dots characterized by TEM. CdTe QDs have quite an essentially monodisperse spherical morphology and are distributed uniformly, with an average diameter of roughly 2.6 nm. As shown in Fig. S1B (Supporting information), due to its covalent chelation on the surface of quantum dots, CdTe quantum dots are slightly aggregated and the diameter increases slightly when Ce3+ is added, however it still maintains good monodispersed. The HRTEM image of Fig. S1B demonstrates the clear lattice fringes spacing distance around 0.23 nm ascribed to the (220) lattice plane of cubic CdTe [35]. Moreover, the more accurate particle size data are provided by the DLS data in Fig. S2 (Supporting information), which shows an average diameter of 2.6 nm of CdTe QDs. However, when Ce3+ was added to the CdTe QDs, the DLS data proved that the size of the quantum dots was about 2.9 nm from Fig. S3 (Supporting information), which was consistent with the results of TEM.
Fig. S4A (Supporting information) shows the FTIR spectra of pure CdTe QDs and the infrared spectrum of quantum dots after adding Ce3+. The -OH stretching vibration of the carboxyl group is responsible for the broad infrared absorption peak at 3445 cm−1. The N-H/COO- bond is accountable for the infrared absorption peak at 1640 cm−1. There is an obvious bonding process in the whole reaction, which is also confirmed by the shift of the characteristic infrared peak from 1640 cm−1 to 1586 cm−1. After adding LVFX (Fig. S4B in Supporting information), the absorption peak of 1186 cm−1 enhanced accompanied by the absorption peak of 1404 cm−1 gradually diminish to disappear, and we can speculate that the Ce3+ is coordinated to the O on the surface of CdTe QDs. Fig. S5 (Supporting information) presents the full-scan spectrum and the related high-resolution specific spectrums of Te 3d, Cd 3d, O 1s, C 1s, and S 2p. The distinctive peaks of Te 3d5/2 emerge at 572.2, 572.5, 575.6, and 576.4 eV, while Te 3d3/2 peaks show at 582.9 and 586.1 eV. Peaks at 405.4 and 405.9 eV are thought to be Cd 3d5/2, while those at 408.9 and 409.3 eV are Cd 3d3/2. On the basis of the peaks at 284.6 eV, 285.8 eV, and 288.4 eV, the C 1s band could be separated into three peaks, which could be attributed to the C=C, C−N, and C=O bonds, respectively. The peaks of 531.3 eV, 532.5 eV, and 535.7 eV in O 1s spectra correlate to C=O and C−O bonds, correspondingly. In addition, zeta-potential measurements were being used to confirm the formation of Ce/CdTe QDs. As can be seen in Fig. S6 (Supporting information), the absolute zeta-potential value of Ce/CdTe QDs is below that of CdTe QDs. All the above proved that Ce3+ had chelated onto the surface of QDs.
Fig. S7 (Supporting information) demonstrated the fluorescence emission peaks of Ce3+, CdTe QDs and CdTe + Ce3+ + LVFX, which the inside are fluorescent photographs under a 274 nm UV lamp. We can clearly see that Ce3+ has a distinct fluorescence emission peak at 360 nm, but it is not visible. The pure quantum dot solution without other reagents showed strong red fluorescence emission at 680 nm. After adding LVFX to Ce/CdTe QDs, a strong green fluorescence emission peak of LVFX appeared at 475 nm, which was due to the enhanced auto fluorescence caused by the absorption of Ce energy by LVFX molecules. Fig. S8 (Supporting information) clearly shows that as the LVFX concentration increases, the fluorescence intensity at 475 nm was significantly enhanced, and the fluorescence emission peak intensity of Ce3+ at 352 nm was significantly reduced. The changes of the two fluorescence intensity peaks showed a good linear relationship with the concentration of LVFX, and the green color of the solution was gradually enhanced through the optical photographs. In order to further verify the reliability of CdTe QDs, we separately add Ce3+ and LVFX to the quantum dot solution. Figs. S9 and S10 (Supporting information) prove that the addition of Ce3+ and LVFX has no effect on the fluorescence of quantum dots, and we can also confirm this through the optical photographs, which further proves the theoretical feasibility of this ratiometric fluorescence sensor. When using fluorescein in aqueous solution and rhodamine 6G in ethanol solution as the reference (Fig. S11 in Supporting information), the quantum yields of CdTe QDs and CdTe and CdTe + Ce3+ + LVFX were calculated to be 29.3% and 37.9%, respectively, confirming their considerable fluorescence intensity [36].
In addition, in order to evaluate the spectacular detection capability, we conducted a series of experiments on the nanoprobe stability at various pH levels and over lengthy periods of time. The impact of solution pH on probe fluorescence intensity is depicted in detail in Fig. S12 (Supporting information), which proves that pH 7 is the most ideal reaction condition. The transmission pictures in Fig. S13 (Supporting information) and fluorescent spectra in Fig. S14 (Supporting information) demonstrate that CdTe QDs have good dispersion in PBS and FBS, with uniform particle size and no significant aggregation. Photostability of the colorimetric fluorescent probe in Fig. S15 (Supporting information) has proved that the ratio fluorescent probe has high stability within 60 min.
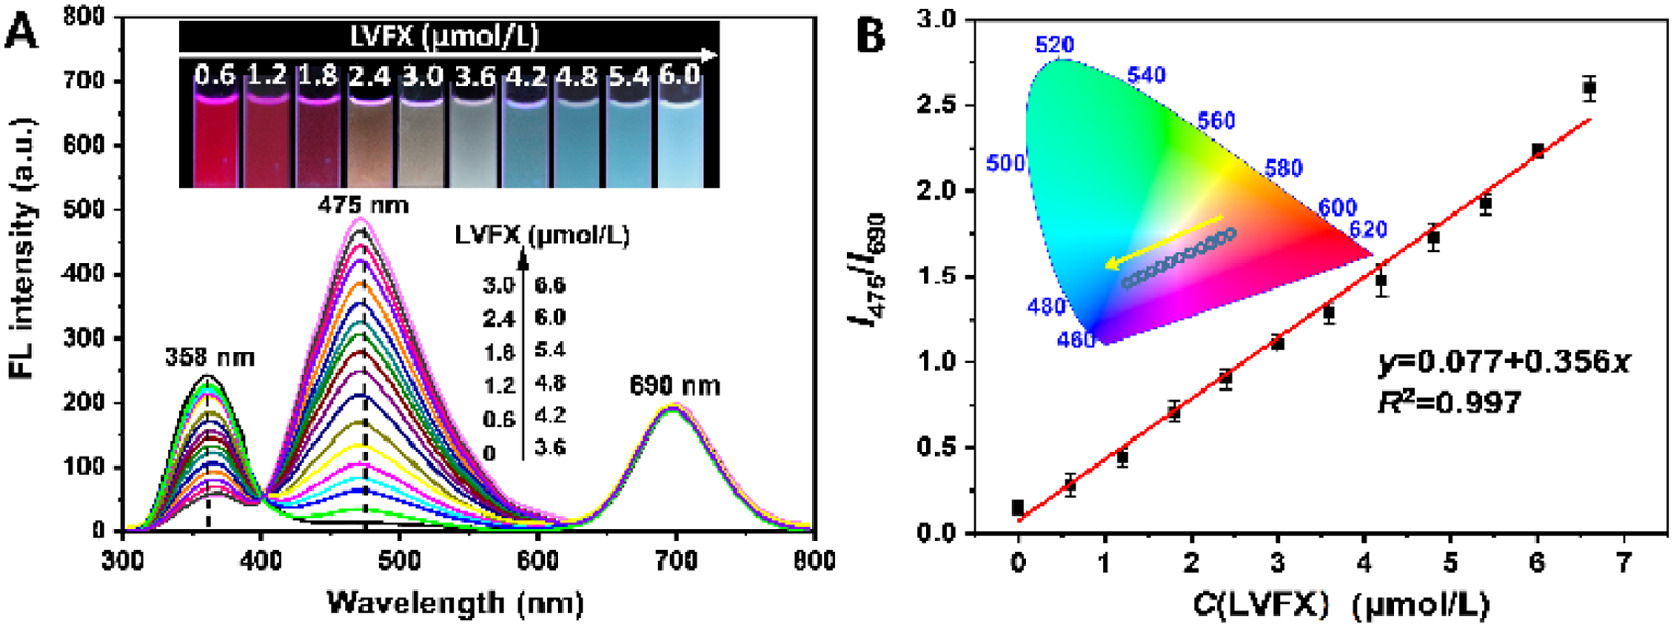
The detection of LVFX based on the Ce/CdTe QDs fluorescence sensor present in Fig. 1. As the LVFX concentration increases from 0 mol/L to 6.6 mol/L, the red-emission intensity at 690 nm remains constant while the green-emission intensity at 475 nm dramatically increases. Furthermore, the I475/I690 fluorescence intensity ratio of Ce/CdTe QDs has a high degree of correlation with LVFX concentrations ranging from 0-6.6 mol/L, with R2 = 0.997. (Fig. 1B). Using the following equation as a reference: we compute that the limit of detection (LOD) is 16.3 nmol/L using LOD = 3σ/k and the amount of LVFX administered, where k is the slope of the calibration plot and is the standard deviation of the blank signals (n = 9) [30]. The comparison with other detection methods reported in the literature clearly confirms that the present sensor of Ce/CdTe has a lower detection line in a narrower concentration linear relationship and presents a wider range of application scenarios over the previous works (Table S1 in Supporting information). It should be noted that the fluorescence intensity peak of Ce3+ at 358 nm decreased linearly when the amount of LVFX added increased. The 4f electron layer of Ce3+ ions absorb energy and transfers to levofloxacin to increase its green fluorescence, which indicates the process of linear energy transfer (LET) between Ce3+ and LVFX. In addition, we can also see from the optical photographs in Fig. 1A that when the amount of LVFX is gradually increased, the color of the ratio fluorescence probe gradually changes from red to green. The temporal fluorescent response by the ratio fluorescence I475/I690 after the addition of LVFX is presented in Fig. S16 (Supporting information), which represents that the entire response process reached equilibrium within 10 min.
We reached a significant visualization reflected by the change of fluorescence intensity ratio I475/I690 by modulating the concentration ratio of Ce3+ and CdTe quantum dots in order to more accurately test its detecting impact. Fig. S17 (Supporting information) shows the fluorescence spectra of the colorimetric fluorescent probe with LVFX added. We have seen the most prominent color changes over a wide range of measured concentrations when the reaction between LVFX and Ce/CdTe QDs achieved equilibrium, with LVFX: CdTe QDs ratios reaching 2:1 and 1.5:1. In particular, the investigations revealed that 2.5:1 was the optimal ratio for manufacturing the nanosensor.
As shown in Fig. S18 (Supporting information), we evaluated the fluorescence spectra of a ratiometric probe in the presence of several relevant interfering chemicals including heavy metals, amino acid, and some antibiotics, etc. As we can see, the intensity ratio I475/I690 changed only when LVFX was added, indicating excellent selectivity to LVFX. When the interfering analytes were introduced, there was no discernible change. Furthermore, when all of the compounds are combined, they have no influence on the sensing system's LVFX detection, demonstrating the superior anti-interference of the ratiometric fluorescence sensor. Fig. S19A (Supporting information) represents the fluorescence photos of monochromatic fluorescent probe after adding different detection samples when without adding red emission CdTe QDs. At the same time, when several other types of antibiotics are added, it shows weak green fluorescence, which further validated the sensitivity of visual detection effect. Other interfering substances have no effect on the reaction when they coexist with LVFX, as shown by the particular results in Fig. S19B (Supporting information).
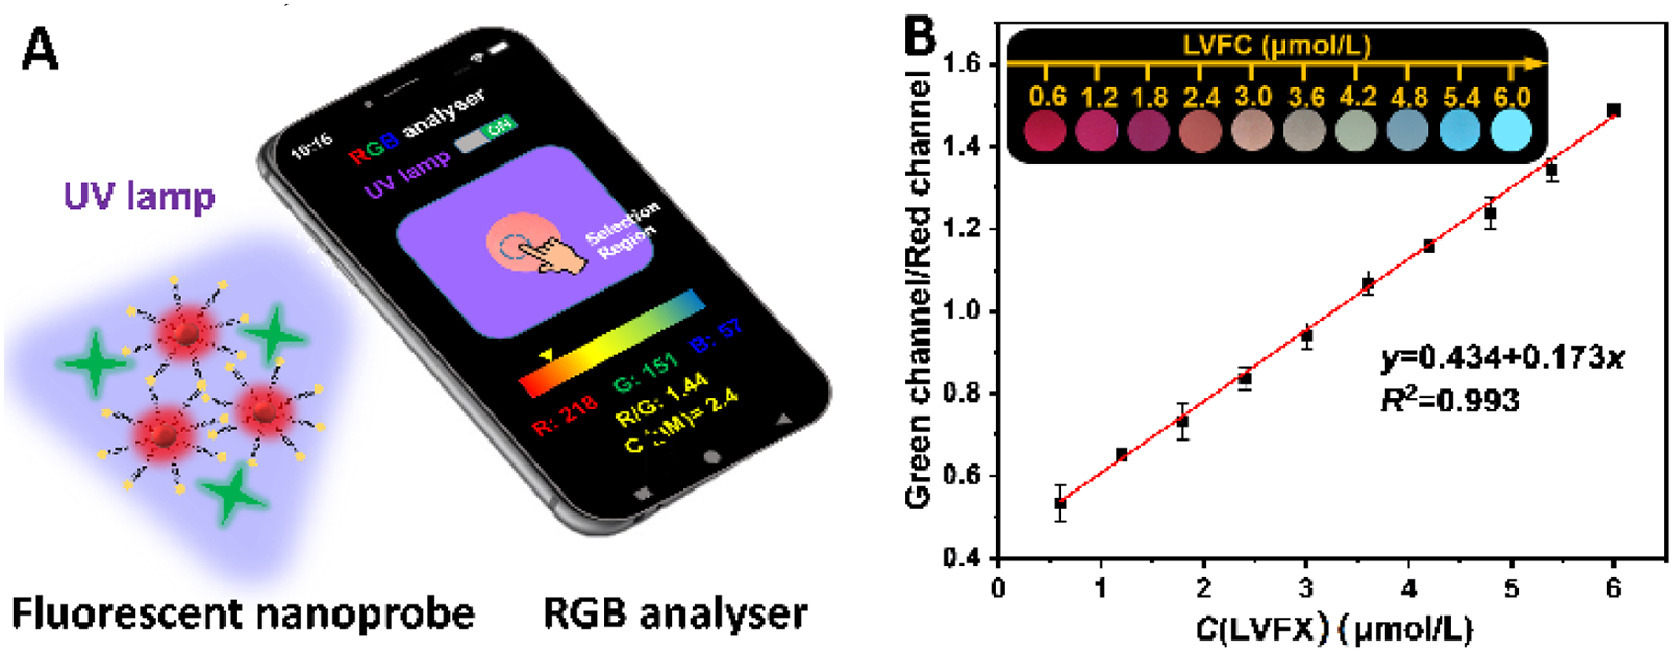
The change of fluorescence intensity can only achieve semi-quantitative detection of the detected substance, and accurate judgment cannot be achieved. To improve the accuracy and reliability of the results and achieve platform portability, it is required and effective to convert color information into RGB values using a smartphone and the color recognizer App (Color recognizer, Xiyi Technology). The smartphone sensing platform is depicted in Fig. 2A as a basic setup diagram, which enables real-time RGB analysis of fluorescence images using the smartphone's color recognizer application. The smartphone's built-in UV light enables continuous excitation of the fluorescence sensing unit, and the color recognizer application can then convert the fluorescence color to a specific RGB value. The ratio of green and red channels (G/R) varied linearly with increasing LVFX concentration, as shown in Fig. 2B, presenting a good linear relationship with R2 = 0.993, and the estimated LOD was determined to be 27.9 nmol/L, indicating a favorable practical application prospect.
In order to further verify the detection effect of this ratiometric fluorescent probe in actual samples, we selected lake water, tap water, milk, and raw pork to detect residual LVFX in combination with a smartphone sensing platform. Water, milk, and raw pork were further pre-treated to strengthen the experiment's rigor and eliminate the background fluorescence of biomolecules in the samples from interfering with the findings. Different concentrations of four spiked samples were conducted and the recovery investigations were conducted multiple loop experiments simultaneously. Fig. 3 depicts the visualization and quantitative detection of LVFX in real samples using a sensing platform and a smartphone color recognizer App. From the fluorescence photos, we can see that as the concentration of LVFX increases, the actual samples also show obvious color changes in the fluorescent solution, and the sensing platform can quantitatively identify them and convert them into specific values. In addition, without complex data processing, the smartphone App can be used to get the final measurement data, which further simplifies the experimental procedure.
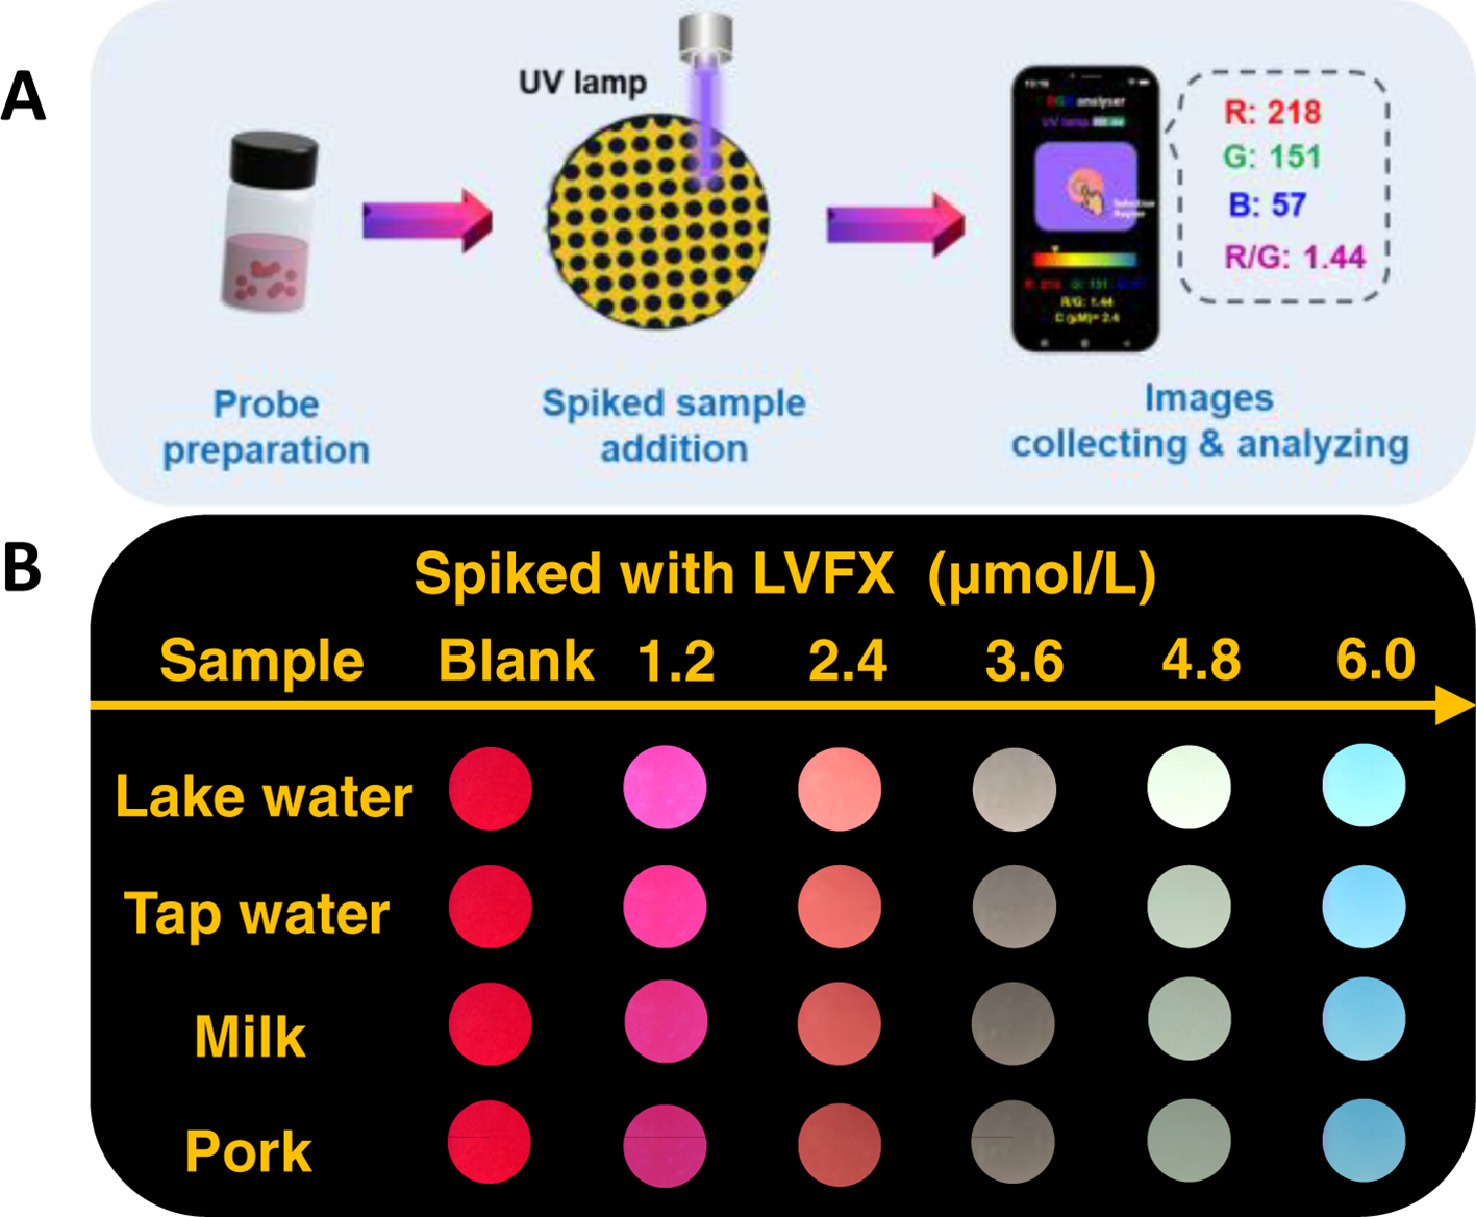
When varied amounts of actual samples were applied, the LVFX concentration recoveries ranged from 94% to 104%, and the relative standard deviation (RSD) was between 1.11% and 2.55%, as can be seen intuitively in Table S2 (Supporting information). Good precision and repeatability of the experiments were demonstrated.
In summary, we have diversified portable colorimetric fluorescence sensing devices for rapid and in-situ detection of LVFX. On the basis of the energy transfer strategy, cerium ions can light up the green emission of LVFX while the red emission of CdTe QDs was unaffected. With the addition of LVFX, the fluorescent sensor provides a conspicuous color change from red to green, which demonstrated the satisfactory sensitivity, selectivity, and anti-interference to LVFX with the LOD of 16.3 nmol/L in the range of 0-6.0 µmol/L. In addition, a smartphone sensing platform has been developed for quantitative visualization of LVFX using the fluorescence detection probe that has been created, and could accomplish quantified detection of LVFX in water, milk, and raw pork with a LOD of 27.9 nmol/L. Hence, all the reported results here demonstrate that the sensor should be a promising detection tool for LVFX, and the as-established diversified devices with excellent performance provide an excellent platform for antibiotic residues monitoring and health safety.
The authors declare that they have no known competing financial interests or personal relationships that could have appeared to influence the work reported in this paper.
This work is financially supported by National Natural Science Foundation of China (No. 21876175), National Key Research and Development Program (No. 2021YFD2000200) and Key Research and Development Program of Anhui Province (No. 202004d07020013).
Supplementary material associated with this article can be found, in the online version, at doi:
D. Hana, A. Véronique, P. Otto, M.B. Jean, J. Med. Chem. 62 (2019) 8665–8681. doi: 10.1021/acs.jmedchem.8b01781
L. Yang, Q.X. Wen, Y.Q. Zhao, et al., J. Hazard. Mater. 373 (2019) 60–66. doi: 10.1016/j.jhazmat.2019.03.060
Y. Zhong, K.M. Shi, Z.H. Diao, et al., Chem. Eng. J. 417 (2021) 129225–129231. doi: 10.1016/j.cej.2021.129225
J.S. Lesley, Drugs 76 (2016) 231–242. doi: 10.1007/s40265-015-0524-5
V. Ratha-korn, A. Natsuda, R. Thawee, et al., Int. J. Infect. Dis. 97 (2020) 102–107. doi: 10.1016/j.ijid.2020.05.077
C. Ana, N. Cleyton, C. Laís, C. Emanuel, Food Chem. 356 (2021) 129692–129700. doi: 10.1016/j.foodchem.2021.129692
C. Cecilia, T. Mihaela, G. Ramona, Nanomaterials 7 (2017) 119–126. doi: 10.3390/nano7060119
Y.H. Cheng, X.Z. Xiao, Y.D. Chen, Y.W. Chen, Z.Y. Huang, Anal. Chim. Acta 1120 (2020) 50–58. doi: 10.1016/j.aca.2020.04.024
X.M. Wang, C. Liu, M. Wang, et al., Chem. Commun. 58 (2022) 4667–4670. doi: 10.1039/D2CC00007E
X.Q. Tan, Y.P. Liang, Y.Y. Ye, et al., Anal. Chem. 94 (2022) 829–836. doi: 10.1021/acs.analchem.1c03508
M. Hu, Y.J. Ben, M.H. Wong, C.M. Zheng, J. Agric. Food Chem. 69 (2021) 1656–1666. doi: 10.1021/acs.jafc.0c05778
F. Nadhiratul, S. Aemi, S. Bahruddin, K. Sazlinda, Talanta 236 (2022) 122833–122840. doi: 10.1016/j.talanta.2021.122833
T. He, Z.Q. Xu, J. Ren, Microchem. J. 146 (2019) 1295–1300. doi: 10.1016/j.microc.2019.02.057
F.L. Chai, D. Wang, L.N. Zhu, W.F. Zheng, X.Y. Jiang, Anal. Chem. 94 (2022) 6628–6634. doi: 10.1021/acs.analchem.2c01177
Q. Pedro, J. María, M. Sergi, M. Ángel, Anal. Chem. 92 (2020) 14608–14615. doi: 10.1021/acs.analchem.0c03020
T. Dong, S.Y. Hu, L. Zhao, X.A. Huang, F. Liu, Anal. Bioanal. Chem. 411 (2019) 8103–8111. doi: 10.1007/s00216-019-02190-6
Y.L. Xu, W. Tuo, L. Yang, et al., Angew. Chem. Int. Ed. (2022), doi:10.1002/anie. 202110048.
Y.L. Xu, C.L. Li, S. Lu, et al., Nat. Commun. 13 (2022) 2009–2022. doi: 10.1038/s41467-022-29572-2
S. Han, L. Yang, Z.G. Wen, et al., J. Hazard. Mater. 398 (2020) 122894–122902. doi: 10.1016/j.jhazmat.2020.122894
S.Y. Chu, H.Q. Wang, X. Ling, et al., ACS Appl. Mater. Interfaces 12 (2020) 12962–12971. doi: 10.1021/acsami.9b20458
D. Lin, L.F. Li, X. Song, et al., ACS Sustain. Chem. Eng. 9 (2021) 14579–14587. doi: 10.1021/acssuschemeng.1c05544
Y. Fan, W.J. Qiao, W.J. Long, et al., Spectrochim. Acta. A: Mol. Biomol. Spectrosc. 274 (2022) 121033–121041. doi: 10.1016/j.saa.2022.121033
P.Z. Wang, H.C. Yang, C. Liu, et al., Chin. Chem. Lett. 32 (2021) 168–178. doi: 10.1016/j.cclet.2020.11.056
C.L. Li, Y.L. Xu, L. Tu, et al., Chem. Sci. 13 (2022) 6541–6549. doi: 10.1039/D2SC01518H
A. Anastasia, Z. Marina, M. Raffaella, et al., ACS Sustain. Chem. Eng. 10 (2022) 738–745. doi: 10.1021/acssuschemeng.1c05289
X.F. Zheng, F.R. Zhang, K. Wang, et al., TrAC Trends Anal. Chem. 140 (2021) 116281–116302. doi: 10.1016/j.trac.2021.116281
T. Zhang, C.C. Ling, B.X. Feng, et al., Adv. Mater. Technol. 7 (2022) 2200250. doi: 10.1002/admt.202200250
X.L. Zhang, L. Wang, X.C. Li, X.C. Li, Chin. Chem. Lett. 33 (2022) 3078–3082. doi: 10.1016/j.cclet.2021.09.061
J.Q. He, T.L. Zhuo, Y.T. Teng, et al., Chin. Chem. Lett. 34 (2023) 107510. doi: 10.1016/j.cclet.2022.05.024
J. María, S. Eduardo, P. Dayán, Dalton Trans. 49 (2020) 7444–7450. doi: 10.1039/D0DT01132K
D. Zhao, J. Yang, X. Tian, et al., Chem. Eng. J. 434 (2022) 134806–134813. doi: 10.1016/j.cej.2022.134806
Q.Q. Ma, J. Wang, Z.H. Li, et al., Small 15 (2019) 1804969–1804991. doi: 10.1002/smll.201804969
H. Li, X. Wang, Y.O. Tymish, G.Y. Chen, Adv. Mater. 33 (2021) 2000678–2000695. doi: 10.1002/adma.202000678
S.L. Wu, J. Dou, J. Zhang, S.F. Zhang, J. Mater. Chem. 22 (2012) 14573–14578. doi: 10.1039/c2jm31409f
X.D. Wang, D. Wang, Y.L. Guo, et al., Biosens. Bioelectron. 77 (2016) 299–305. doi: 10.1016/j.bios.2015.09.044
X.F. Chen, Q.S. Mei, L. Yu, et al., ACS Appl. Mater. Interfaces 10 (2018) 42225–42232. doi: 10.1021/acsami.8b13765

Figure 1 (A) The spectra of the sensors with the addition of LVFX. The fluorescence intensities of LVFX and CdTe QDs were tuned to a ratio of 2.5:1. (B) Plot of the I475/I690 ratio versus the concentrations of LVFX. The chromaticity diagram is shown in the inset of Fig. 1B.

Figure 2 (A) Schematic diagram of smartphone sensing platform for the detecting LVFX. (B) Linearity plot of ratiometric fluorescent probe color change versus LVFX concentration from 0.6 µmol/L to 6.0 µmol/L.

 扫一扫看文章

扫一扫关注我们
 DownLoad:

 下载:
下载:
