Figure 1.
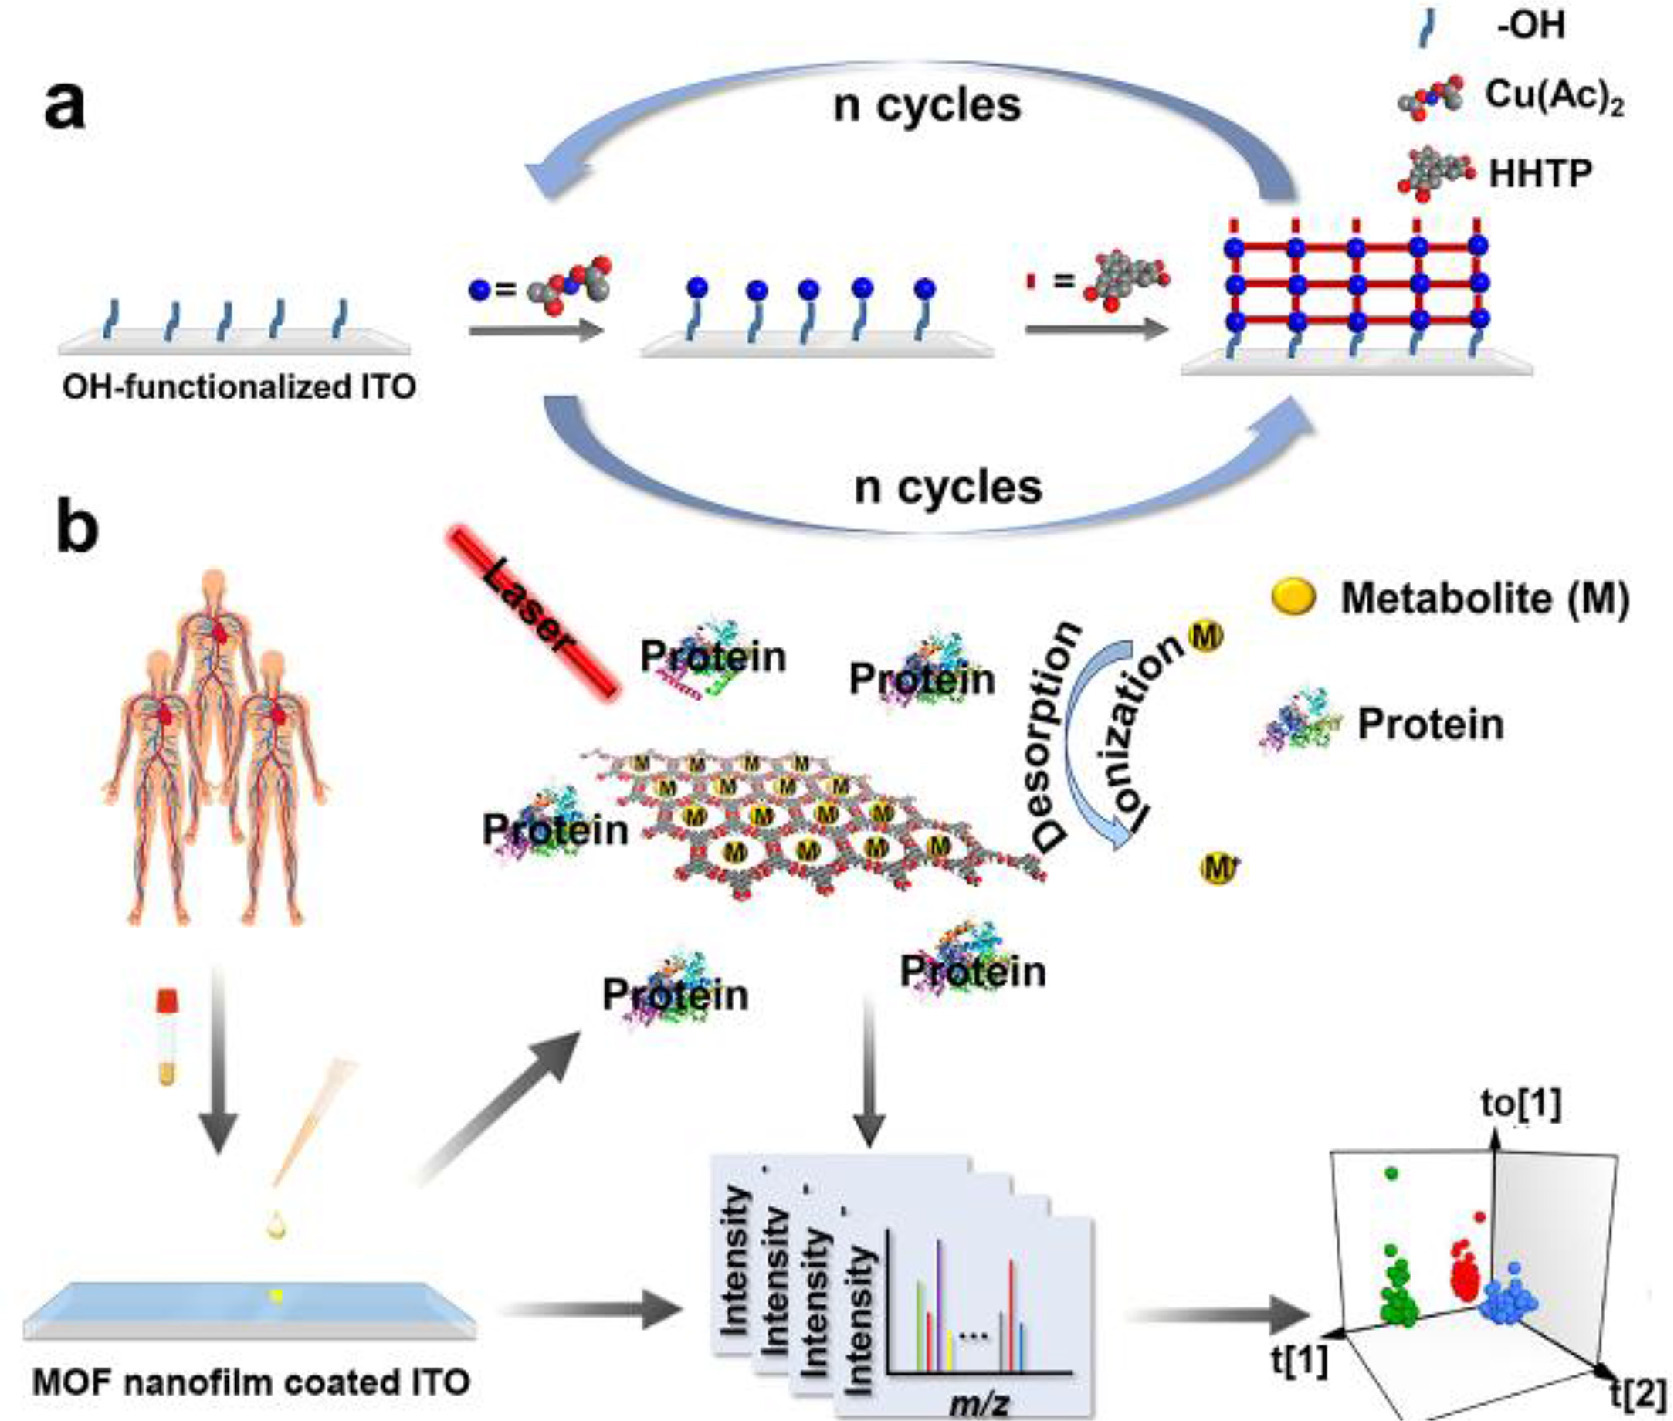
(a) Synthetic route of MOF nanofilm coated ITO. (b) The SMPs by MOF nanofilm-based LDI-MS for precise diagnosis of CVD.
Metal-organic framework nanofilm enhances serum metabolic profiles for diagnosis and subtype of cardiovascular disease
Dan Ouyang , Zhihua Fu , Guorong Li , Chao Zhong , Jiahao Yuan , Huan Huang , Juan Lin , Gang Xu , Zian Lin

Cardiovascular disease (CVD), which consists of coronary heart disease (CHD), stroke and other diseases of the heart such as arrhythmia, heart failure (HF), and heart valve problems, is prevalent worldwide and remains a leading cause of death [1-3]. Although substantial progress has been made in the diagnosis and treatment of CVD, precisely subtyping of CVD are strongly depended on clinical observation and monitoring, which often lead to false diagnosis [4]. As a result, it is necessary to develop an approach for precise diagnosis of CVD. Considering that the variation of metabolites in biofluids can reflect the current physiological and pathological states, metabonomics is more conducive to precise diagnosis than genomics and proteomics [5-8]. More importantly, understanding the corresponding molecular basis behind the diversity of cardiovascular phenotypes may contribute to the diagnosis, therapy and prognosis of CVD [9,10]. However, the inherent low abundance of most metabolites in high-complexity biofluids hindered clinical use [11]. Therefore, developing an effective strategy for high-throughput and precise diagnosis of CVD based on metabolic profiles in biofluids should be enforced urgently.
Mass spectrometry (MS), characterized by high throughput, sensitivity and resolution, has been increasingly applied in analyzing metabolites [12,13]. Especially, laser desorption/ionization mass spectrometry (LDI-MS) based on nanomaterials is attractive in large-scale clinical diagnosis because of its minimal sample volume and ideal detection speed within seconds [7,14-18]. It has been well known that the background interference caused by traditional organic matrixes in low mass region can be circumvented with appropriate nanomaterials as substrates [19-21]. Thus, the nanomaterials-based LDI-MS is more suitable for the detection of small molecules. So far, a variety of nanomaterials, such as carbon [22-24], silicon [25-27], metal and metal oxides [28,29], metal-organic frameworks (MOFs) [30], covalent organic frameworks (COFs) [31,32], and hybrid materials [33-36], have been exploited as substrates. Among them, MOFs are superior in (1) high light absorption and fast energy transfer facilitating the desorption/ionization process; (2) large specific surface areas, tunable pore size and modifiable pore surface helping to selectively extract metabolites from complex biofluids and thus improving detection sensitivity [37-40]. Despite the improvement that has been made in MOFs as substrates, the reported MOFs for LDI-MS so far were mainly limited to the form of powders which cannot accurately control the spatial distribution in the traditional spotting and drying strategies, resulting in a degree of poor reproducibility and loss of target information [29,41]. As an alternative, the film-structured nanomaterials can solve the aforementioned problem by reducing region-dependent differences to improve reproducibility [41,42]. Therefore, further exploitation of MOF nanofilms that can homogeneously distribute in space and possess oriented arranged chromophores and pores are expected to play an important role in improving the performance of LDI-MS toward precision diagnostics.
Herein, a highly oriented MOF nanofilm was introduced as a substrate for LDI-MS to construct a high-performance metabolic analysis platform for precise diagnosis of CVD (Fig. 1). The MOF nanofilm, Cu3(HHTP)2 (HHTP, 2, 3, 6, 7, 10, 11-hexahydroxytriphenylene), was fabricated by a layer-by-layer liquid-phase epitaxial spray approach. The optimized MOF nanofilm-based LDI-MS showed enhanced sensitivity, high selectivity and excellent reproducibility, thus enabling selective extraction of serum metabolic profiles (SMPs) without any tedious pretreatment. Further combination with multivariate statistical analysis, the precise diagnosis of CVD was achieved by SMPs, which could distinguish CVD from healthy controls and differentiate two different phenotypes of CVD (CHD and chronic heart failure (CHF, a subgroup of HF)).
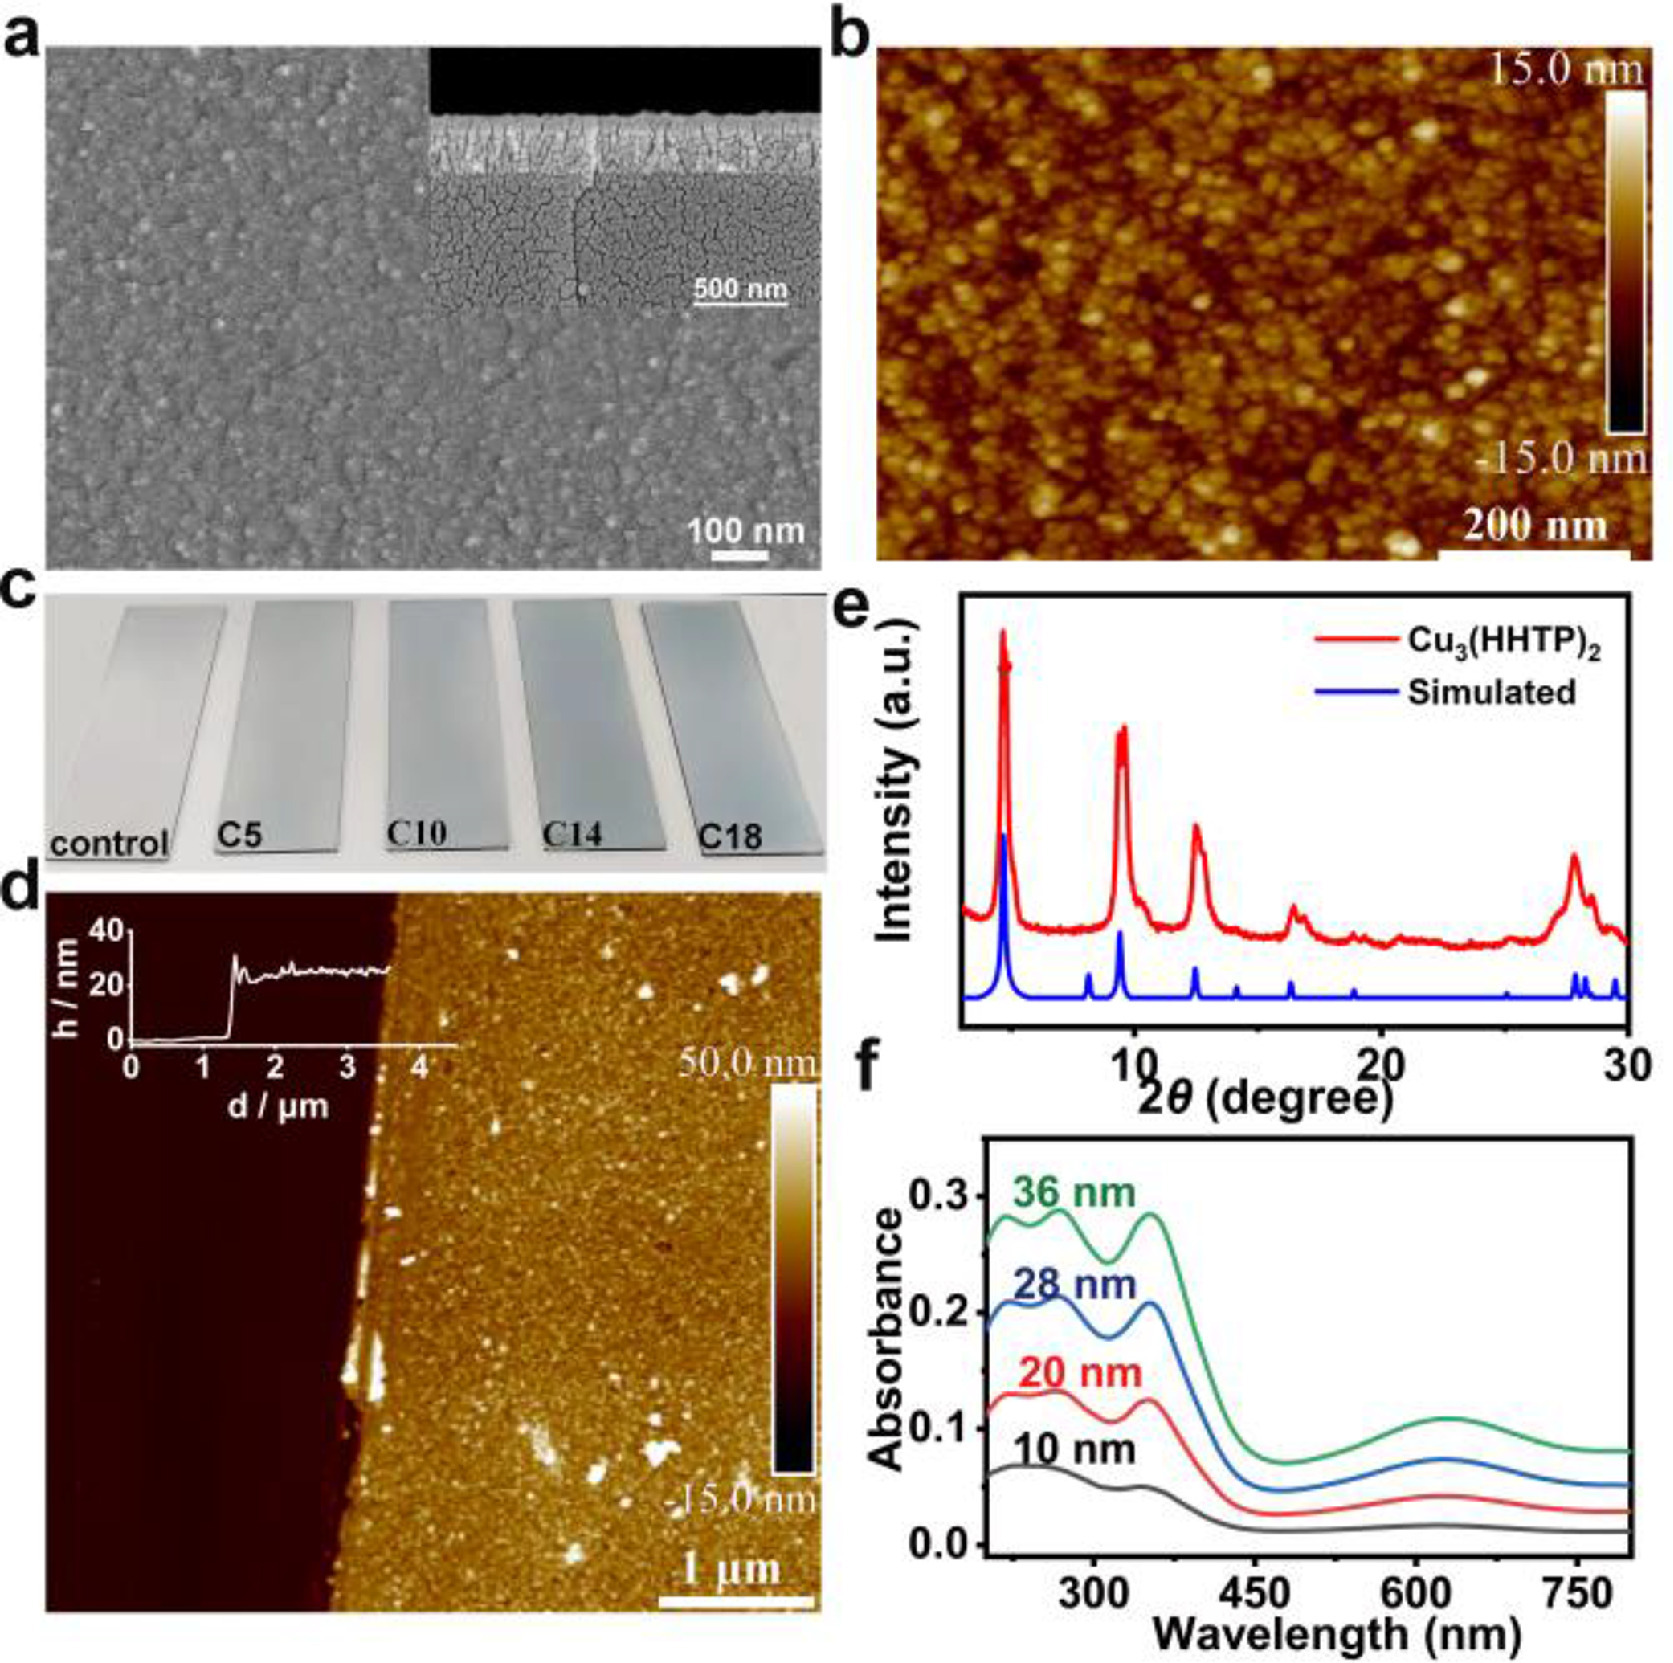
The Cu3(HHTP)2 nanofilm was fabricated by a layer-by-layer spray method on -OH functionalized indium-tin oxide (ITO) glass with some modifications based on the previous work [43]. The scanning electron microscopy (SEM) and atomic force microscopy (AFM) images of MOF nanofilm showed that the nanofilm was dense and continuous (Figs. 2a and b, Figs. S1a–f in Supporting information). The thickness of nanofilm could be precisely controlled through different growth cycles, denoted as Cu3(HHTP)2-Cx (x represented the growth cycles). Fig. 2c revealed the photograph of the MOF nanofilm prepared after different growing cycles, and the corresponding thickness were of 10 nm, 20 nm, 28 nm, and 36 nm (Fig. 2d and Figs. S1g–i in Supporting information). The results demonstrated that the thickness increment of each cycle was ~2 nm, which was matched well with previous work [43]. The powder X-ray diffraction (PXRD) patterns in Fig. 2e exhibited typical peaks assigned to Cu3(HHTP)2, indicating the successful synthesis of this MOF. Good optical properties are one of the preconditions for substrates in LDI-MS [44]. As for Cu3(HHTP)2, the organic bridging ligand of HHTP possessed a fused benzene ring structure which could strongly adsorb UV light and meanwhile, resist to photolysis and avoid to produce undesired molecular fragment background [43]. As shown in Fig. 2f, the maximum absorption wavelength of the MOF nanofilm was close to 355 nm, which was well matched with the wavelength of the laser used for LDI-MS (λ = 355 nm). The photocurrent response of Cu3(HHTP)2-C14 was performed in Fig. S2 (Supporting information), and the result indicated that the MOF nanofilm-based LDI-MS had good sensitivity due to the fact that the suppression of electron-hole recombination in substrate carriers could improve the desorption/ionization efficiency [45].
To evaluate the feasibility of Cu3(HHTP)2 nanofilm as substrate, LDI-MS analysis were performed and compared by using the MOF nanofilm, Cu3(HHTP)2 powder, commercially available 2, 5-dihydroxybenzoic acid (DHB), and α-cyano-4-hydroxycinnamic acid (CHCA) as matrixes, with and without glucose (Glu) as a model analyte. As presented in Figs. S3a and b (Supporting information), the matrix-related ions of DHB and CHCA in low-mass range played a dominant role in the corresponding mass spectra, and no background peaks were observed in the same mass ranges while using Cu3(HHTP)2 powder and MOF nanofilm as substrates, suggesting the feasibility of MOF nanofilm as substrate for metabolite analysis. On the other hand, the [M+Na]+ and [M+K]+ ions of Glu with enhanced MS responses was observed by using the MOF nanofilm as substrate in comparison with Cu3(HHTP)2 powder (Fig. S3b). The result could be attributed to the fact that the highly oriented MOF nanofilm could facilitate photo-generated electron and energy transfer, and thus enhance the efficiency of desorption/ionization process [46,47]. The above-mentioned results firmly confirmed the potential of the MOF nanofilm as a substrate for LDI-MS.
It was well known that the thickness of MOF nanofilm played an important role in the detection sensitivity of LDI-MS. Herein, the effect of MOF nanofilm with different thicknesses on the performance of LDI-MS was further evaluated by using histidine (His) and Glu as examples. It was observed from Fig. S4 (Supporting information), the MS signals of His and Glu were prominently enhanced with the increasing thickness of MOF nanofilm, among which the MOF nanofilm with 28 and 36 nm performed better. Therefore, the MOF nanofilm with the thickness of 28 nm was preferentially selected considering the MS signal responses.
Reproducibility as an important factor was also examined to assess the performance of the proposed MOF nanofilm-based LDI-MS approach, where Glu was adopted as a model compound and the results were shown in Fig. 3. As expected, the relative standard deviations (RSDs) of shot-to-shot, spot-to-spot, and batch-to-batch were 11.14%, 20.29%, and 24.56% (Figs. 3a–c), when Cu3(HHTP)2 powder was used as substrate. In contrast, the reproducibility was distinctly improved as the MOF nanofilm was used (Figs. 3d–f), where the RSDs of shot-to-shot, spot-to-spot, and batch-to-batch were 3.84%, 4.51%, and 6.50%, respectively. In addition, the MOF nanofilm in current work exhibited high reproducibility compared with the previously reported MOFs substrate [48-52], demonstrating the superiority of the MOF nanofilm in LDI-MS. Such excellent reproducibility could be attributed to the uniform surface of the MOF nanofilm (Fig. S5 in Supporting information), which was beneficial to obtaining the high-quality and high-reproducibility of MS signals.

Besides, the successful detection of five small molecules including His, Glu, lysine (Lys), hydroxyproline (Hyp), and phenylalanine (Phe) proved the superiority of the MOF nanofilm for LDI-MS. In contrast, only few compounds could be found by using DHB and CHCA matrixes, respectively (Figs. 3g–i). Considering the high-abundance salts and proteins in biofluids, analysis of the mixture in a simulated biofluid environment with high salinity (0.5 mol/L NaCl) and protein (5 mg/mL bovine serum albumin (BSA)) was performed in Fig. S6 (Supporting information), and the result validated that no information of the mixture was lost, implying the high selectivity and sensitivity of the MOF nanofilm-based LDI-MS for small metabolites in complex biofluids. This good result can be explained by the fact that the micropore (< 2.0 nm) of Cu3(HHTP)2 can selectively accommodate small metabolites and exclude large-sized proteins in biofluids [16,46,53]. In addition, the limit of detection (LOD) of Glu as low as 1 ng/mL was obtained (Fig. S7 in Supporting information), indicating the high sensitivity of the MOF naofilm-based LDI-MS. Overall, the above-mentioned results firmly confirmed that the microporous MOF nanofilm could be used for metabolic detection of complex biofluids with desirable selectivity.
Encouraged by the good performance as mentioned above, the optimized MOF nanofilm-based LDI-MS was further applied to extract SMPs of CVD. A total of 174 serum samples were collected from 54 healthy individuals (control) and 120 CVD patients (66 CHF and 54 CHD), and no significant differences in age and sex were observed among the three groups (Fig. 4a and Table S1 in Supporting information). The typical SMPs of healthy control, CHF patient and CHD patient were presented in Fig. 4b, where abundant peaks with significant differences could be seen in all cases.

We first used the unsupervised principal component analysis (PCA) to observe the overall distribution of serum metabolic variation after data processing, in which showed a satisfactory discrimination result in Fig. S8 (Supporting information). Therefore, we further applied the orthogonal partial least squares discriminant analysis (OPLS-DA) to establish the classification models. The heatmap of SMP with 388 m/z features were shown in Fig. S9 (Supporting information), and the healthy controls and CVD patients were classified by OPLS-DA (R2Y(cum) = 0.980, Q2(cum) = 0.949, and AUC = 0.999 with 95% confidence interval (CI) of 0.995-1) (Fig. 4c and Fig. S10 in Supporting information), validating that the SMPs based on the MOF nanofilm could differentiate CVD patients from healthy controls. Besides, the results of 200 permutations elucidated that the model was reliable (Fig. S11 in Supporting information). Then, the m/z features of potential biomarkers were selected by combining S-plot (variable importance on projection (VIP) value > 1) and t-test (P-value < 0.05) (Fig. 4d). The top 20 m/z features with relatively high VIP values were shown in Fig. S12 (Supporting information), and the differential expression of CVD compared to healthy controls could be seen from the heatmap. Furthermore, metabolites with significant difference between CVD patients and healthy controls were conducted manually by m/z feature selection using the human metabolome database (
With the development of precision medicine, disease classification has been recognized as the key to achieving personalized treatment for patients. Consequently, two major CVD including CHD and CHF were selected to preliminarily explore the ability of the MOF nanofilm-based LDI-MS in identifying CVD subtypes. Firstly, the three groups were successfully separated by OPLS-DA (Fig. S13 in Supporting information). Similarly, as presented in Figs. 5a–c and Fig. S14 (Supporting information), the two phenotypes of CVD could be classified by the differential variables, leading to clear group separations between CHF and control (R2Y(cum) = 0.982, Q2(cum) = 0.944, and AUC = 0.971 with 95% confidence interval (CI) of 0.893-1), CHD and control (R2Y(cum) = 0.972, Q2(cum) = 0.932, and AUC = 0.998 with 95% confidence interval (CI) of 0.983-1), CHF and CHD (R2Y(cum) = 0.995, Q2(cum) = 0.888, and AUC = 0.999 with 95% confidence interval (CI) of 0.97-1). Subsequently, the reliability for subtype classification was verified via the results of 200 permutation tests, which was shown in Fig. S15 (Supporting information). The S-plots of CHF, CHD vs. control, and CHF vs. CHD (Figs. 5d–f) were executed and 20 featured peaks (according to VIP value) were presented in Figs. 5g–i. Therefore, such a diagnostic model of CVD based on SMPs could be applied to distinguish not only healthy controls and CVD, but also CHF and CHD, validating the excellent performance of the MOF nanofilm-based LDI-MS platform.

In summary, we presented a highly oriented MOF nanofilm-based LDI-MS for direct metabolic analysis in biofluids and developed a high-quality and high-reproducibility analytical platform for precise diagnosis and subtyping of CVD. Benefited from the highly oriented, and microporous (< 2.0 nm) and uniform surface of MOF nanofilm based LDI-MS platform with high-throughput and high analytical speed, the established method enabled selective extraction of SMPs without enrichment or purification and generated robust and reliable MS data, which is conductive to large-scale clinical application. Furthermore, coupling with multivariate statistical analysis, the common experience of deviation in clinical detection can be eliminated, so as to reduce false diagnosis. This work provides a new strategy for precise diagnosis of CVD, and also expands the application of MOF nanofilm in clinical analysis.
The authors declare no competing financial interest.
This project was supported by the National Natural Science Foundation of China (Nos. 21974021 and 22036001) and the Major Project of Science and Technology of Fujian Province (No. 2020HZ06006).
Supplementary material associated with this article can be found, in the online version, at doi:
H. Clark, The Lancet 381 (2013) 510–511. doi: 10.1016/S0140-6736(13)60058-6
F. Paneni, C. Diaz Cañestro, P. Libby, et al., J. Am. Coll. Cardiol. 69 (2017) 1952–1967.
J.R. Ussher, S. Elmariah, R.E. Gerszten, et al., J. Am. Coll. Cardiol. 68 (2016) 2850–2870. doi: 10.1016/j.jacc.2016.09.972
Z. Wang, Q. Zhang, J. Xiong, et al., IEEE Sens. J. 17 (2017) 5581–5588. doi: 10.1109/JSEN.2017.2726011
C.H. Johnson, J. Ivanisevic, G. Siuzdak, Nat. Rev. Mol. Cell Biol. 17 (2016) 451–459. doi: 10.1038/nrm.2016.25
Z. Liu, D. Pouli, C.A. Alonzo, et al., Sci. Adv. 4 (2018) eaap9302. doi: 10.1126/sciadv.aap9302
J. Whitburn, S.R. Rao, E.V. Morris, et al., Sci. Adv. 8 (2022) eabf9096. doi: 10.1126/sciadv.abf9096
J. Yang, R. Wang, L. Huang, et al., Angew. Chem. Int. Ed. 59 (2020) 1703–1710. doi: 10.1002/anie.201913065
H. Taegtmeyer, M.E. Young, G.D. Lopaschuk, et al., Circ. Res. 118 (2016) 1659–1701. doi: 10.1161/RES.0000000000000097
M. Zhang, L. Huang, J. Yang, et al., Adv. Sci. 8 (2021) 2101333. doi: 10.1002/advs.202101333
W. Lu, X. Su, M.S. Klein, et al., Annu. Rev. Biochem. 86 (2017) 277–304. doi: 10.1146/annurev-biochem-061516-044952
Y. Li, M. Bouza, C. Wu, et al., Nat. Commun. 11 (2020) 5625. doi: 10.1038/s41467-020-19444-y
X. Sun, L. Huang, R. Zhang, et al., ACS Cent. Sci. 4 (2018) 223–229. doi: 10.1021/acscentsci.7b00546
C. Yang, H. Yu, X. Hu, et al., Adv. Funct. Mater. 31 (2021) 2105478. doi: 10.1002/adfm.202105478
R. Li, Y. Zhou, C. Liu, et al., Angew. Chem. Int. Ed. 60 (2021) 12504–12512. doi: 10.1002/anie.202101007
L. Huang, L. Wang, X. Hu, et al., Nat. Commun. 11 (2020) 3556. doi: 10.1038/s41467-020-17347-6
M.S. Rana, L. Xu, J. Cai, et al., Small 16 (2020) 2003902. doi: 10.1002/smll.202003902
V. Vedarethinam, L. Huang, M. Zhang, et al., Adv. Funct. Mater. 30 (2020) 2002791. doi: 10.1002/adfm.202002791
Z. Lin, Z. Cai, Mass Spectrom. Rev. 37 (2018) 681–696. doi: 10.1002/mas.21558
A.Y. Lim, J. Ma, Y.C.F. Boey, Adv. Mater. 24 (2012) 4211–4216. doi: 10.1002/adma.201200027
L.Z. Samarah, A. Vertes, View 1 (2020) 20200063. doi: 10.1002/VIW.20200063
Y.T. Lai, K. Kandasamy, Y.C. Chen, Anal. Chem. 93 (2021) 7310–7316. doi: 10.1021/acs.analchem.1c00878
B. Gulbakan, E. Yasun, M.I. Shukoor, et al., J. Am. Chem. Soc. 132 (2010) 17408–17410. doi: 10.1021/ja109042w
S. Li, J. Liu, J. Sun, et al., Chin. Chem. Lett. 32 (2021) 62–65. doi: 10.1016/j.cclet.2020.09.026
J. Wei, J.M. Buriak, G. Siuzdak, Nature 399 (1999) 243–246. doi: 10.1038/20400
S.A. Iakab, P. Rafols, M. García-Altares, et al., Adv. Funct. Mater. 29 (2019) 1903609. doi: 10.1002/adfm.201903609
S.A. Stopka, C. Rong, A.R. Korte, et al., Angew. Chem. Int. Ed. 55 (2016) 4482–4486. doi: 10.1002/anie.201511691
J.A. McLean, K.A. Stumpo, D.H. Russell, J. Am. Chem. Soc. 127 (2005) 5304–5305. doi: 10.1021/ja043907w
Y. Wang, K. Zhang, T. Tian, et al., ACS Appl. Mater. Interfaces 13 (2021) 4886–4893. doi: 10.1021/acsami.0c20944
S.S. Yang, M.Y. Shi, Z.R. Tao, et al., Anal. Bioanal. Chem. 411 (2019) 4509–4522. doi: 10.1007/s00216-019-01876-1
K. Hu, Y. Lv, F. Ye, et al., Anal. Chem. 91 (2019) 6353–6362. doi: 10.1021/acs.analchem.9b01376
Q. Sun, C. Gao, W. Ma, et al., Microchim. Acta 187 (2020) 370. doi: 10.1007/s00604-020-04340-5
L. Huang, J. Wan, X. Wei, et al., Nat. Commun. 8 (2017) 220. doi: 10.1038/s41467-017-00220-4
S.A. Iakab, P. Ràfols, M. Tajes, et al., ACS Nano 14 (2020) 6785–6794. doi: 10.1021/acsnano.0c00201
C. Pei, C. Liu, Y. Wang, et al., Angew. Chem. 132 (2020) 10923–10927. doi: 10.1002/ange.202001135
X. Li, A.S. Kulkarni, X. Liu, et al., Small Methods 5 (2021) 2001001. doi: 10.1002/smtd.202001001
J.R. Li, R.J. Kuppler, H.C. Zhou, Chem. Soc. Rev. 38 (2009) 1477–1504. doi: 10.1039/b802426j
H. Dou, M. Xu, B. Wang, et al., Chem. Soc. Rev. 50 (2021) 986–1029. doi: 10.1039/D0CS00552E
A. Schoedel, M. Li, D. Li, et al., Chem. Rev. 116 (2016) 12466–12535. doi: 10.1021/acs.chemrev.6b00346
F. Mu, B. Dai, W. Zhao, et al., Chin. Chem. Lett. 31 (2020) 1773–1781. doi: 10.1016/j.cclet.2019.12.015
D. Ouyang, Q. Zheng, H. Huang, et al., Anal. Chem. 93 (2021) 15573–15578. doi: 10.1021/acs.analchem.1c01743
J. Lee, Y.K. Kim, D.H. Min, J. Am. Chem. Soc. 132 (2010) 14714–14717. doi: 10.1021/ja106276j
M.S. Yao, X.J. Lv, Z.H. Fu, et al., Angew. Chem. Int. Ed. 56 (2017) 16510–16514. doi: 10.1002/anie.201709558
K. Dreisewerd, Chem. Rev. 103 (2003) 395–426. doi: 10.1021/cr010375i
A. Bhardwaj, J. Kaur, M. Wuest, et al., Nat. Commun. 8 (2017) 1. doi: 10.1038/s41467-016-0009-6
M. Hmadeh, Z. Lu, Z. Liu, et al., Chem. Mater. 24 (2012) 3511–3513. doi: 10.1021/cm301194a
R. Haldar, L. Heinke, C. Wöll, Adv. Mater. 32 (2020) 1905227. doi: 10.1002/adma.201905227
J.P. Wang, Y. Wang, X. Guo, et al., Microchim. Acta 185 (2018) 175. doi: 10.1007/s00604-017-2627-z
Z. Lin, W. Bian, J. Zheng, et al., Chem. Commun. 51 (2015) 8785–8788. doi: 10.1039/C5CC02495A
C.P. Fu, S. Lirio, W.L. Liu, et al., Anal. Chim. Acta 888 (2015) 103–109. doi: 10.1016/j.aca.2015.07.029
J. Wu, D. Ouyang, Y. He, et al., ACS Appl. Mater. Interfaces 11 (2019) 38255–38264. doi: 10.1021/acsami.9b11100
G. Han, Q. Zeng, Z. Jiang, et al., Talanta 164 (2017) 355–36. doi: 10.1016/j.talanta.2016.11.044
X. Song, X. Wang, Y. Li, et al., Angew. Chem. Int. Ed. 59 (2020) 1118–1123. doi: 10.1002/anie.201911543

Figure 1 (a) Synthetic route of MOF nanofilm coated ITO. (b) The SMPs by MOF nanofilm-based LDI-MS for precise diagnosis of CVD.

Figure 2 (a) SEM image (inset: cross-section) of 28 nm MOF nanofilm. (b) Top view AFM image of 28 nm MOF nanofilm. (c) MOF nanofilms with different growing cycle (Control, C5 (10 nm), C10 (20 nm), C14 (28 nm) and C18 (36 nm)). (d) Cross-section AFM image of 28 nm MOF nanofilm. (e) PXRD patterns of Cu3(HHTP)2 powder. (f) UV-visible spectra of different thickness MOF nanofilm.

Figure 3 With Cu3(HHTP)2 powder as substrate, the intensities of 0.1 mg/mL Glu repeatedly acquired from (a) the same spot, (b) 9 different sample spots, and (c) 3 different batches of Cu3(HHTP)2 powder, respectively. With MOF nanofilm as substrate, the intensities of 0.1 mg/mL Glu repeatedly acquired from (d) the same spot, (e) 9 different sample spots, and (f) 3 different batches of MOF nanofilm (28 nm), respectively. Mass spectra of mixture with (g) DHB, (h) CHCA and (i) MOF nanofilm as matrixes (the mixture contained His, Glu, Lys, Hyp, and Phe).

Figure 4 (a) Demographics of 174 clinical serum samples. (b) Typical mass spectra of healthy controls (green), CHF (blue) and CHD (red) patients, respectively. (c) OPLS-DA score plots revealing the global metabolic difference in 54 healthy controls and 120 CVD patients. (d) S-plot of CVD vs. control. The red dots were the metabolite ions with VIP value > 1. Results of biological information analysis of metabolites (e) enrichment overview and (f) pathway analysis. The colour and size of each circle were correlated to the P value and pathway impact value. Pathways with impact values > 0 were considered to be differentially altered.

 扫一扫看文章

扫一扫关注我们
 DownLoad:
 下载:
下载:
