Received Date:
24 April 2022 Accepted Date:
26 July 2022 Revised Date:
05 July 2022 Available Online:
15 April 2023
Abstract:
Caproate, produced by microbial chain elongation process, is potential to replace the diversified fossil-based products, contributing to carbon neutrality. However, its production performance is far from industrial application, so the cost-effective enhancement measures are highly needed. This study confirmed powdered activated carbon (PAC) has a significant effect on enhancing caproate production performance. The production, yield, and selectivity of caproate were improved by more than 1-fold by the optimized PAC dosage of 15 g/L, comparing with control. Mechanism investigation from a new visual angle showed that PAC accelerated ethanol oxidation to generate acetyl-CoA, and simultaneously boosted the efficiency of reverse β oxidation (RBO) by promoting the timely reaction of butyrate and acetyl-CoA to synthesis caproate. The addition of PAC also shifted the microbial community by enriching more caproate-producing bacteria but eliminating irrelevant ones. Furthermore, metagenomic analysis revealed that PAC effectively up-regulated the functional genes encoding key enzymes responsible for ethanol oxidation and RBO pathway, which was the root cause for the improved caproate production. This study presented the intrinsic insights into the mechanism of PAC promoting caproate generation, laying a foundation to the scale production of caproate.
Medium chain fatty acids (MCFAs) are considered eco-friendly bio-synthetic platform chemicals to replace non-renewable fossil-based products, contributing to carbon emission reduction [1]. Due to the high energy density, MCFAs are the superior precursors for further processing of biofuels and industrial chemicals in contrast with short chain fatty acids (SCFAs) [2]. Besides, the relatively low solubilities of MCFAs imparted by their longer carbon-chain than other biochemicals (e.g., SCFAs, ethanol, lactate) also make their selective phase separation process more accessible [3] (Table S1 in Supporting information). Therefore, researchers have increasingly focused on enhancing MCFAs production in the past decade (Fig. S1 in Supporting information), to facilitate its industrial application [4, 5].
As one of the main MCFAs, caproate is versatile and its total quantity demanded has so far reached upon hundreds of thousands of tons per year [6]. In general, caproate is produced through three approaches. First is industrial synthesis, primary in the petrochemical industry, with the restriction on production capacity and excessive energy consumption [6]. The second is to refine from coconut or palm kernel oil that contains below 1% caproate, encountering the contradiction of low yield but high costs [6]. The last one is the acknowledged greener route, which is the biorefinery from various wastes like syngas [7, 8], distillery by-products [3], and excess sludge [9] through chain elongation (CE) process [2] which is expected to become the dominant caproate production technology for the sustainable society development. However, current caproate yield from wastes is still far from the requirement of industrialization. Hence, it is significant to take effective measure to enhance productivity.
Anaerobic fermentation relies on interspecies electron transfer. Bryant et al. [10] and Thiele et al. [11] first demonstrated H2 and formate as electron carriers to aid electron transference, dubbed mediate interspecies transfer (MIET). Afterwards, direct interspecies electron transfer (DIET) was verified to be a more effective mode than MIET [12], which significantly facilitated methanation [13] as well as the removal of aromatic organics [14], sulfate [15] and COD [16] in wastewater. Therefore, DIET is obviously advantageous for anaerobic fermentation. Caproate synthesis, classified as anaerobic fermentation, necessitates the collaboration of ethanol oxidizers and reverse β oxidation (RBO) bacteria [17]. Relevant studies have reported the existence of DIET between CE bacteria [18, 19]. Methanosaeta and Methanobacterium acted as ethanol oxidizers, whose electron produced was captured by conductive materials like biochar and granular activated carbon (GAC) and then transferred to CE bacteria to perform caproate synthesis [20, 21]. The establishment of DIET could be the key cause for a high caproate concentration of 21.1 g/L [19]. So far, the studies on promoting DIET to enhance CE performance is still in its infancy.
In general, microorganisms conduct DIET through conductive pili, conductive materials (carbon materials of biochar [22] and activated carbon [23], and the iron materials of Fe3O4 [24] and zero-valent iron (ZVI) [25]), and long-distance transport via redox coupling [26]. Recently, the addition of conductive material to stimulate DIET and enhance caproate production has been demonstrated. Wang et al. [27] revealed that MCFAs concentration under 20 g/L ZVI was improved by ~5 times and caproate proportion peaked at 77.7% due to the increased electron transfer efficiency. However, adding ZVI also risks destroying cell membranes. By contrast, porous carbon material could be a better choice. The physical and chemical properties of carbon material, including species, specific surface, sizes and conductivity, affect the caproate production [28]. From a contrast experiment on the effects of biochar and activated carbon on MCFAs production, the highest caproate selectivity of 92% was obtained at a low dose of activated carbon instead of biochar [29]. Liu et al. [28] reported that the particle size of carbon material < 5 µm was optimal due to the larger specific surface and higher conductivity. Besides, the additive with pore space also provided a refuge for CE bacteria from the toxic substrate and product [19]. Therefore, powdered activated carbon (PAC), characterized by strong conductivity, high specific surface, and pore structure, could be also effective to enhance caproate production.
Hence, the aims of this study are to (1) investigate the feasibility of enhancing caproate production through PAC addition and its performance, (2) optimize the dosage of PAC, and (3) elucidate the intrinsic mechanism.
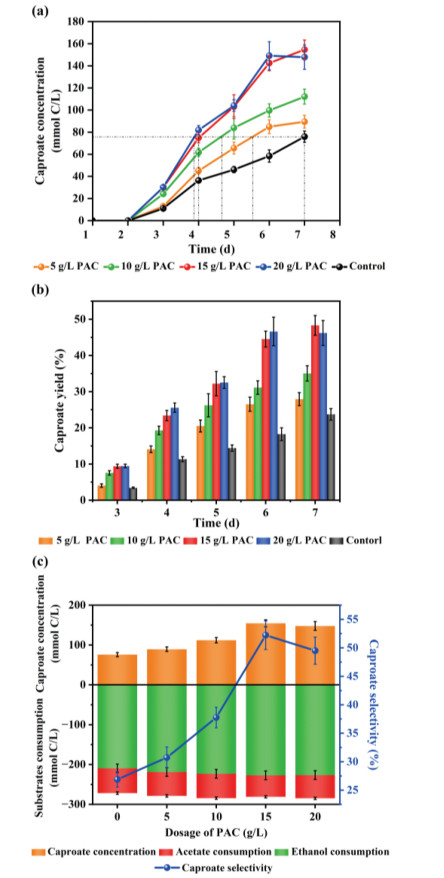
Experimental results showed that various SCFAs and MCFAs were detected, with caproate as the predominant product, and thereby the subsequent data analysis focused on caproate. As shown in Fig. 1, caproate production was significantly stimulated with PAC addition. The maximum caproate concentration of 154.6 ± 8.76 mmol C (2.99 ± 0.17 g/L) was obtained under 15 g/L PAC, which was 2.03 times as high as the control. Moreover, it only took about 4 days for 15 and 20 g/L PAC reactors to obtain the similar caproate concentration with control obtained after 7 days, suggesting PAC addition could simultaneously improve caproate production and shorten the lag phase. It was reported that ethanol content > 40 mmol/L had an inhibitory effect on ethanol oxidizer which was indispensable for ethanol-induced CE [30]. Although the initial concentration of ethanol was 3 times higher than the critical value (40 mmol), the reinforcement on ethanol oxidation under 15–20 g/L PAC was still found, meaning PAC might mitigate ethanol toxicity. Concerning product toxicity, rigorous analyses illustrated that 0.2 g/L undissociated caproic acid resulted in strong inhibition on bacteria, and severe inhibition arose when that reached at 0.87 g/L [31]. As shown in Table S2 (Supporting information), a low daily output of 237.41 mg/L was determined without PAC addition, when the corresponding undissociated caproic acid did not reach the toxic limit. Inversely, under 15 g/L PAC, although the undissociated caproic acid was 0.2–0.3 g/L, higher than the inhibition concentration, the daily output was about 4 times that of control. Therefore, the presence of PAC could alleviate the product inhibition significantly, ensuring the normal microbial metabolism and caproate formation. From Fig. 1b, the highest caproate yield of 48.3% was obtained under 15 g/L PAC, which was 2.04 times of that obtained from control. Besides, 15 g/L PAC also contributed to the highest selectivity of caproate (52.23% ± 2.51%) that was facilitated by 51.5% compared to the control trial (Fig. 1c). Hence, 15 g/L could be the optimal PAC dosage. In a similar ethanol-induced CE system, caproate yield was enhanced ~1.59 times compared to control when adding 20 g/L biochar [19], suggesting that the capacity of PAC to enhance caproate production could be no less than that of biochar. Additionally, it was reported that the conductivity and electron transfer efficiency were largely improved by adding conductive carbon material. Therefore, PAC likely also acted as an electronic shuttle to conduct DIET between CE related microorganisms to accelerate caproate synthesis.
Figure 1
Figure 1.
Comparison of caproate production performance at different PAC dosages: variations of caproate concentration (a) and yield (b) during 7 days reaction, and the substrate consumption and caproate production (left Y-axis), and caproate selectivity (right Y-axis) (c).
From Fig. 1c, the production and selectivity of caproate peaked at 15 g/L PAC, while the acetate consumption was the lowest, suggesting PAC could stimulate CE functional bacteria to utilize butyrate as electron acceptor (EA) priorly. Concentrating on PAC dosages of 15 and 20 g/L, the almost same ethanol utilization resulted in different caproate concentrations of 154.6 ± 8.76 mmol C and 147.8 ± 11.01 mmol C, respectively. There is one hypothesis for this discrepancy. The caproate produced at 20 g/L PAC may be absorbed by the excessive PAC. Contreras-Davila et al. [18] also encountered the analogical phenomenon when adding GAC, where lactate and acetate were still utilized, although caproate production declined, which could be partly attributed to the adsorption of caproate by porous structure on GAC. PAC with a similar structure to GAC could also show the adsorption capacity. Therefore, the caproate productivity could be improved under excess PAC, while the generated caproate might also be absorbed, which could explain the lower caproate concentration under 20 g/L PAC than that under 15 g/L PAC. A contrast experiment [29] indicated that more caproate were adsorbed with higher dosage of AC (with 30 g/L AC, at least 30% produced caproate were adsorbed), instead, BC did not show this adsorption capacity. Providing that the cost of resolving caproate from AC was much higher than that of extra AC dosage, it was meaningless to obtain the so-called high production.
To reveal the mechanism of PAC enhancing caproate production, the influences of PAC on the two steps of CE, ethanol oxidation and RBO, were investigated. As shown in Fig. S2a (Supporting information), when adding ethanol as sole substrate, ethanol consumption was extremely rapid, especially in the first two days. On the 4th and 6th day, the consumption of ethanol under PAC addition was always higher than that of control, with an overall utilization greater than 99%, indicating PAC accelerated ethanol conversion. Moreover, a noticeable difference appeared in the concentration of generated acetate that was significantly lower with PAC addition than control after day 2. Meanwhile, acetyl-CoA concentration was varied consistently in the two reactors, which reached its maximum on the second day and then dropped rapidly to near zero. This implied PAC addition might promote the reaction of acetyl-CoA with acetate to form butyrate and caproate.
To elucidate the effect of PAC on RBO, 3 mmol acetyl-CoA and 3 mmol acetate were added as substrates, and the experimental result is displayed in Fig. S2b (Supporting information). An entire caproate synthesis needs two cycles of RBO consuming both acetyl-CoA and acetate simultaneously, explaining why acetyl-CoA was consumed so rapidly. From day 2 to 4, acetate concentration dropped dramatically (~1.79 mmol) without PAC addition, resulting in significant growth of intermediate butyrate (from 0.5 mmol to 1.42 mmol), while only 0.31 mmol caproate was generated. With the continuous decline of acetate, part of butyrate began to be consumed, and at the same time, a large amount of caproate was synthesized. Therefore, the microorganism without PAC addition preferred to use acetate as EA, which was proposed by Weimer in 2012 [32]. A completely different variation happened with the addition of PAC. Most butyrate in PAC reactor produced by the first step of RBO reacted with acetyl-CoA in time to generate caproate, even though acetate concentration was still higher than butyrate, as evidenced by steady caproate production rate (~0.37 mmol/L). After 6 days fermentation, the left acetate without and with PAC addition were 1.27 mmol and 0.71 mmol, producing 1.3 mmol and 1.51 mmol caproate, respectively. To sum up, PAC accelerated the RBO by motivating microbiomes to utilize both acetate and butyrate as EAs concurrently, broking the traditional notion that acetate was preferred as EA. The deeper mechanisms from the microbial aspects are worth exploring.
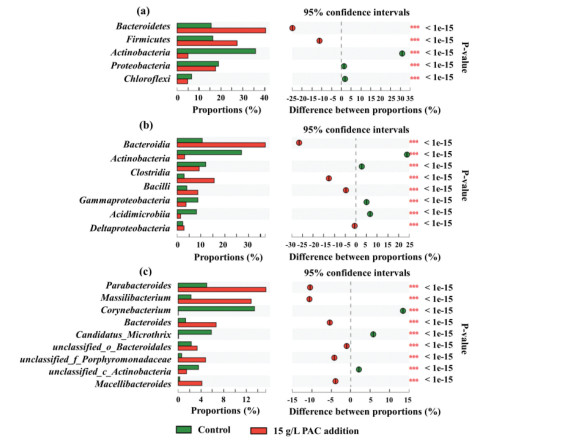
To reveal the influence of PAC on microbial community, the bacteria compositions of initial inoculum, control, and reactor with 15 g/L PAC at phylum, class, and genus levels are characterized in Figs. S3 and S4 (Supporting information), and their composition difference based on Fisher exact test are compared in Figs. 2a-c. Bacteroidetes, Firmicutes, Actinobacteria, Proteobacteria, and Chloroflexi were the top five phyla for both reactors. Among them, Bacteroidetes and Firmicutes were significantly more enriched in 15 g/L PAC reactor (36.28% and 25.78%) than those in control (14.22% and 16.52%). Meanwhile, PAC addition led to much lower relative abundance of Actinobacteria (5.52%) comparing with control (32.12%), which also slightly decreased Proteobacteria and Chloroflexi. Among these phyla, Firmicutes contained abundant CE bacteria, such as Clostridium kluyveri, Megasphaera elsdenii, Megasphaera hexanoica, Clostridium sp. BS-1, Ruminococcaceae bacterium CPB6, etc. [1, 33-35]. Bacteroidetes, as the common phylum in anaerobic fermentation, is closely related to organics degradation and caproate synthesis [27, 36]. Therefore, PAC addition helps to enrich more caproate-producing-associated microorganisms.
Figure 2
Figure 2.
Comparison of microbial community between control and 15 g/L PAC reactor based on Fisher exact test at 95% confidence intervals: (a) phylum level, (b) class level, and (c) genus level.
Class Bacteroidia that affiliated to Bacteroidetes was significantly increased from 10.51% (control) to 37.06% after adding PAC. The increased abundance mainly came from the more enrichment of genera Parabacteroides, Bacteroides, and Macellibacteroides. Similarly, Parabacteroides and Bacteroides were also significantly increased in the reactor producing caproate from excess sludge after adding ZVI, and both of them were considered to be beneficial for caproate formation [27]. Bacteroides was previously found to be more positively correlated with caproate production from electron donor (ED) of lactate instead of ethanol [36, 37]. However, in this study, Bacteroides was increasingly enriched along with the significantly enhanced caproate production after PAC addition, suggesting Bacteroides also contributed to caproate synthesis from ethanol. Genus Macellibacteroides was identified to be a butyrate producer, which also played synergistic roles with Clostridium on butyrate production [38]. Hence, the increased Macellibacteroides by PAC addition could be engaged in generating more precursor (butyrate) for caproate synthesis.
Bacilli, affiliated to Firmicutes, were another significantly increasing class. Its member Massilibacterium was the second largest increment genus other than Parabacteroides. Leng et al. [39] reported that Massilibacterium encoded for ethanol oxidation to acetate and butyrate, promoting the generation of these intermediates for C. kluyveri elongation to caproate. It was implied that, Massilibacterium could not only be responsible for the first step of CE (ethanol oxidation), but also facilitate the first cycle (acetate elongation to butyrate) of subsequent RBO. Therefore, the significantly increased Massilibacterium could play a key role in enhancing caproate production when adding PAC. In addition to Massilibacterium, another genus of Bacilli, Bacillus, was also committed to produce caproate from carbon sources of lactose, lactate, ethanol, and acetate [40]. Bacillus was also increasingly enriched after PAC addition, which might be also a contributor for the enhanced caproate production. In summary, the addition of PAC shifted the microbial community structures by enriching more caproate-producing-associated bacteria and eliminating irrelevant bacteria. It was noted that some common CE bacteria were not detected or increasingly enriched, which could be related to the initial microbial composition of inoculum and the characteristics of PAC. PAC addition might provide favourable conditions to enhance the competitiveness of existing caproate-producing bacteria.
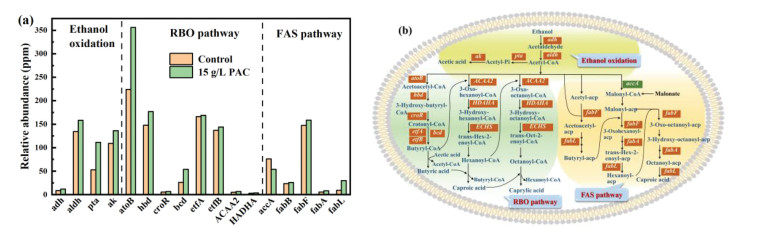
The metabolic behavior of microorganism is essentially determined by functional genes [41]. Hence, metagenomics analysis was further applied to reveal the fundamental reason why PAC addition shifted the microbial community and enhanced caproate production. Figs. 3a and b showed the changed relative abundance of genes and functions relevant for caproate synthesis, respectively.
Figure 3
Figure 3.
Comparison of the relative abundance on caproate-producing associated functional genes at control and 15 g/L PAC reactor microbiome (a), and functions enhanced by PAC addition (b). In (b), the increased genes were added with red character underline and the decreased genes were added with green character underline.
ED is the prerequisite substance for caproate generation since the oxidation of ED provides energy, reducing equivalents, and intermediate acetyl-CoA for subsequent RBO [1]. Clearly, the functional genes encoding alcohol dehydrogenase (adh) and aldehyde dehydrogenase (aldh) involved in ethanol oxidation to acetyl-CoA, and phosphate acetyltransferase (pta) and acetate kinase (ak) responsible for acetyl-CoA conversion to acetate, increased by 17%−110% after PAC addition compared with control. This indicated that PAC was conductive to the generation of acetyl-CoA, so that providing sufficient acetyl-CoA to perform the elongation of acetate to butyrate and then caproate. Accordingly, the transform of acetyl-CoA to acetate was also enhanced by PAC, which allowed microorganism to harvest more energy. However, this acetyl-CoA consumption process is not supposed to be promoted excessively, in case acetyl-CoA becomes insufficient for caproate synthesis. Fortunately, PAC addition did not cause the excessive ethanol oxidation, but enhance the subsequent caproate production performance (Fig. S2a).
RBO is the next step following ED oxidation for caproate generation. Acetyl-CoA participates as the core 2-carbon intermediate in each cycle of RBO. To start-up the first cycle, acetyl-CoA is coupled with another CoA derivative to form intermediate acetoacetyl-CoA, regulated by acetyl-CoA C-acetyltransferase (atoB). As shown in Fig. 3a, the functional gene encoding atoB occupied a high relative abundance in both control and PAC reactor, in which the gene abundance under PAC addition was 58.9% higher than that of control. Additionally, the relative abundances of genes encoding 3-hydroxybutyryl-CoA dehydrogenase (hbd) and 3-hydroxybutyryl-CoA dehydratase (croR) responsible for acetoacetyl-CoA conversion and crotonyl-CoA formation, respectively were also increased by 20% and 22% by PAC addition. Furthermore, the gene abundance of butyryl-CoA dehydrogenase (bcd) was largely increased by 105%, along with the slight increases of genes encoding electron transport flavoproteins alpha and beta subunits (etfAB). The bcd and etfAB constitute the butyryl-CoA dehydrogenase complex which works on catalyzing the conversion of crotonyl-CoA to butyryl-CoA [42]. Other than above functional genes for the first cycle of RBO (butyrate generation), PAC also increased the genes encoding acetyl-CoA acyltransferase-2 (ACAA2), 3-hydroxyacyl-CoA dehydrogenase (HADHA), and enoyl-CoA hydratase (ECHS), which are responsible for the synthesis of relevant intermediates in the cycles for caproate and caprylate generation (Fig. 3b). Therefore, PAC positively affected the functional genes involved in RBO.
Besides RBO, microbial FAS is also recognized as an important pathway directly generating caproate [43]. Different from RBO, FAS is started by a 3-carbon donor of malonyl-CoA produced by the carboxylation of acetyl-CoA, which is catalyzed by acetyl-CoA carboxylase (accA). As shown in Fig. 3a, the abundance of gene encoding accA was decreased by 29% by PAC addition than control, implying that less acetyl-CoA was used for malonyl-CoA generation and the FAS pathway. However, the genes encoding 3-oxoacyl-[acyl-carrier-protein] synthase Ⅰ (fabB) and Ⅱ (fabF), 3-hydroxyacyl-[acyl-carrier-protein] dehydratase (fabA), and enoyl-[acyl-carrier protein] reductase Ⅲ (fabL) catalyzing the generation of intermediates butyryl-acp, hexanoyl-acp and octanoyl-acp for FAS were increased by PAC addition. Nevertheless, the proportion of these increased gene abundance is much lower than that of RBO, meaning the changed genes related FAS could affect little for the final caproate production.
In conclusion, the addition of PAC effectively enhanced caproate production. Under the optimized PAC dosage of 15 g/L, the concentration, yield, and selectivity of caproate were all more than doubled comparing with those without PAC addition. Further mechanism investigation showed that PAC improved the efficiencies of both steps of CE, which were ethanol oxidation and RBO, accelerating the generation of acetyl-CoA and promoting the reaction of acetyl-CoA with acetate and butyrate. Microbial community and functional genes were also obviously affected by PAC. Concretely, caproate-producing functional bacteria, such as Massilibacterium, Macellibacteroides and Bacteroides, were significantly enriched. The genes encoding adh, aldh, pta, and ak responsible for ethanol oxidation and genes encoding atoB, hbd, bcd, and etfAB involved in RBO were largely increased. These PAC-induced variations collectively contributed to the enhanced caproate production.
Declaration of competing interest
The authors declare that they have no known competing financial interests or personal relationships that could have appeared to influence the work reported in this paper.
Acknowledgments
This work was supported by the Natural Science Foundation of Sichuan Province (No. 2022NSFSC1042), Fundamental Research Funds for the Central Universities, National Natural Science Foundation of China (No. 52000132), and also supported by the Sichuan Province College Students' Innovation and Entrepreneurship Training Plan (No. S202210610415).
Supplementary materials
Supplementary material associated with this article can be found, in the online version, at doi:10.1016/j.cclet.2022.07.057.
H. Seedorf, W.F. Fricke, B. Veith, et al., Proc. Natl. Acad. Sci. U. S. A. 105 (2008) 2128–2133. doi: 10.1073/pnas.0711093105
[43]
W. Han, P. He, L. Shao, et al., Appl. Environ. Microbiol. 84 (2018) e01614–e01618.
Figure 1
Comparison of caproate production performance at different PAC dosages: variations of caproate concentration (a) and yield (b) during 7 days reaction, and the substrate consumption and caproate production (left Y-axis), and caproate selectivity (right Y-axis) (c).
Figure 2
Comparison of microbial community between control and 15 g/L PAC reactor based on Fisher exact test at 95% confidence intervals: (a) phylum level, (b) class level, and (c) genus level.
Figure 3
Comparison of the relative abundance on caproate-producing associated functional genes at control and 15 g/L PAC reactor microbiome (a), and functions enhanced by PAC addition (b). In (b), the increased genes were added with red character underline and the decreased genes were added with green character underline.

 DownLoad:

 下载:
下载:


