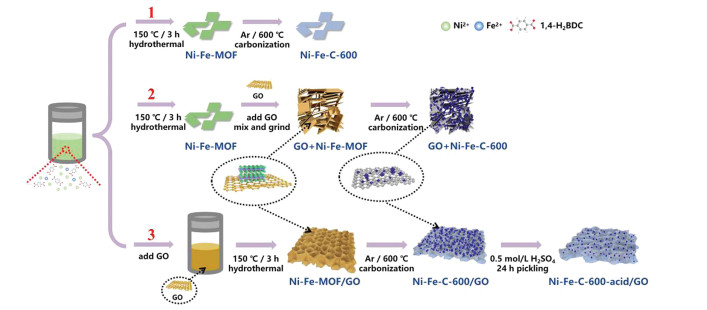
Figure 1.
The schematic of the preparation processes of Ni-Fe-C, GO + Ni-Fe-C, and Ni-Fe-C-acid/GO catalysts.
Modification strategies on 2D Ni-Fe MOF-based catalysts in peroxydisulfate activation for efficient organic pollutant removal
Minjun Liu , Ying Liu , Xinru Liu , Chengcheng Chu , Ducheng Yao , Shun Mao

Advanced oxidation processes (AOPs) based on sulfate activation show great prospect for refractory pollutants treatment [1-3]. Owing to the limited oxidizing ability of peroxydisulfate (PDS), many efforts have been made to develop efficient catalysts for PDS activation [4]. Among the reported catalysts, metal-organic frameworks (MOFs)-derived catalysts are promising catalysts for PDS activation because of their high catalytic activity from porous structure, small particle size, and abundant active sites [5, 6]. However, most of the reported MOF-derived catalysts have 3D structure [7-9], and the application of 2D MOF-derived catalysts in PDS activation have rarely been reported. Compared with 3D MOF-derived materials and traditional metals or metal oxides, the active sites of 2D MOF-derived materials are more accessible. Moreover, the 2D nanosheets have a smaller diffusion barrier for molecules [10, 11]. It was reported that uniform 2D NiO nanoflakes are highly efficient to activate PDS through the surface-activated complex [12], and the nanosheets loaded on a flat surface have less geometric constraints and higher catalytic activity [13]. Based on the unique dimension characteristics, 2D MOF-derived materials may higher catalytic activity compared with the 3D MOF-based catalysts [13, 14].
For 2D MOF-derived catalysts, the problems are how to balance the catalytic activity and metal leaching, and how to avoid the nanosheet agglomeration. Moreover, 2D MOFs without modification are not suitable for serving as PDS catalyst because of their poor chemical stability in water. Therefore, it is of paramount importance to develop efficient modification method for 2D MOFs to improve its stability. This study provides some strategies to synthesize 2D MOF-derived catalysts for PDS activation. As shown in Fig. 1, at first, we synthesized 2D Ni-MOF through a bottom-up solvothermal method [15, 16], and introduced Fe to prepare 2D Ni-Fe MOF [17-19]. Then, several modification strategies including carbonation, acid pickling, and combination of 2D MOF with graphene oxide (GO) support were applied. The carbonation can enhance the crystallinity of the catalyst and increase the specific surface area of the catalyst, thereby increasing the catalytic activity [8]. Acid etching was applied to eliminate larger size nanoparticles and to reveal more exposed active sites on the catalyst [6]. Additionally, acid etching was reported to be able to decrease the ion leaching during the PDS activation process [4]. Graphene oxide with abundant hydroxyl groups and oxygen-containing functional groups can serve the support for the 2D MOF catalyst and improve the stability of the catalyst in water [20-22].
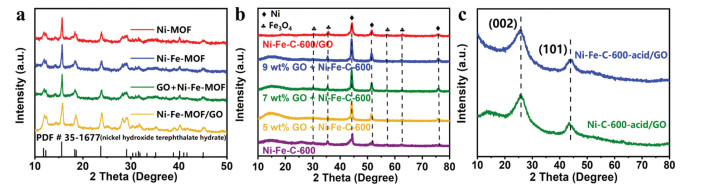
The 2D Ni-MOF and Ni-Fe-MOF were prepared through a solvothermal method. As shown in Figs. 2a and b, both 2D Ni-MOF and Ni-Fe-MOF show nanoflake structures with smooth surface. After annealing treatment of 2D Ni-Fe-MOF, the obtained Ni-Fe-C-600 still retains a nanosheet structure (Fig. 2c). Fig. S1 (Supporting information) shows the scanning electron microscope (SEM) image and EDS elemental mapping data of Ni-Fe-MOF. The Fe element is found in the Ni-Fe-MOF, confirming the successful synthesis of the Ni-Fe-MOF. The X-ray diffraction (XRD) patterns of the prepared catalysts (Fig. 3a) match well with the previously reported patterns of 2D Ni-MOF and Ni-Fe-MOF [16].
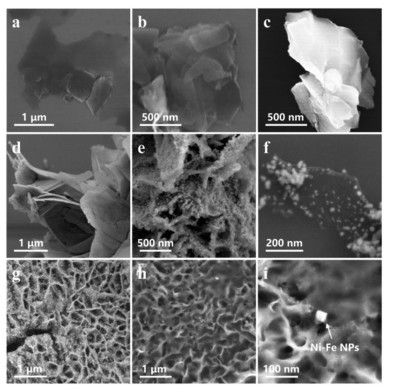
A two-step synthesis method was used to load the prepared 2D MOF on GO support. The GO + Ni-Fe-MOF shows a lamellar structure (Fig. 2d). As displayed in Figs. 2e and f, there are many nanoparticles distributed on the surface of GO + Ni-Fe-C-600. In the third synthesis method, a one-step method was used to in-situ grow 2D Ni-Fe-MOF directly on the GO surface as shown in Fig. 1. The Ni-Fe-MOF/GO shows the similar XRD patterns compared with those of Ni-Fe-MOF, indicating the 2D MOF generation. After the pyrolysis, the SEM image (Fig. 2g) of Ni-Fe-C-600/GO shows that the 2D nanosheets grow on the surface of GO and many nanoparticles are generated from 2D MOF. The Ni-Fe-C-600/GO has a rough surface which can improve the interaction between the catalyst and the reactants. The Ni-Fe-C-600/GO was further treated by acid to obtain Ni-Fe-C-600-acid/GO. It is worth noting that large nanoparticles were removed after the acid treatment and smaller nanoparticles (around 30 nm) were left on the GO surface (Figs. 2h and i)
The XRD diffraction patterns (Fig. 3b) of Ni-Fe-C-600, GO + Ni-Fe-C-600, and Ni-Fe-C-600/GO show similar peaks. Further analysis indicates that the main constituents in these materials are Ni [23, 24] and Fe3O4 [25-27]. After acid treatment, the main peaks of Ni-Fe-C-600-acid/GO and Ni-C-600-acid/GO are assigned to carbon (002) and (101), respectively (Fig. 3c). The amounts of Ni and Fe3O4 particles in Ni-Fe-C-600-acid/GO and Ni-C-600-acid/GO are too little, thus no clear Ni and Fe3O4 peaks in XRD patterns are found.
The p-chloroaniline (PCA) is a chlorinated aromatic compound, which has been used in the synthesis of dyes, plastics, cosmetics, pesticides, pharmaceuticals, etc. It can cause serious environmental pollution due to the properties of highly toxic, teratogenic, carcinogenic, mutagenic, and genotoxic [28] and induce cancer [29]. As a persistent organic pollutant, PCA has been listed as a priority pollutant by the United States Environmental Protection Agency and the European Union [30]. The PDS activation activity of the prepared materials was evaluated by the PCA degradation performance. As shown in Fig. 4a, as expected, 2D Ni-MOF and Ni-Fe-MOF without modification exhibit low catalytic activity, and the PCA removal rate of the two MOFs are lower than 11.04%. The corresponding pseudo first-order kinetics (k) of the two catalysts are smaller than 0.0012 min−1 (Fig. S2a in Supporting information). The experiments show that Ni-C-600 and Ni-Fe-C-600 have better catalytic activity. To be specific, 72.49% and 90.73% of PCA removal rates are achieved at 120 min (Fig. 4a). The k values of Ni-C-600 and Ni-Fe-C-600 are 0.0256 and 0.0520 min−1, respectively (Fig. S2a). Compared with Ni-C-600, Fe doping induced an enhancement of PCA degradation. Besides, the adsorption of Ni-Fe-C-600 is negligible and the oxidization of PDS alone for PCA removal is limited (Fig. 4b). The effect of annealing temperature reveals that high activity is obtained under high annealing temperature (Fig. 4c) and the k value of Ni-Fe-C-300 and Ni-Fe-C-800 is 0.0002 min−1 and 0.2521 min−1 (Fig. S2b in Supporting information), respectively.
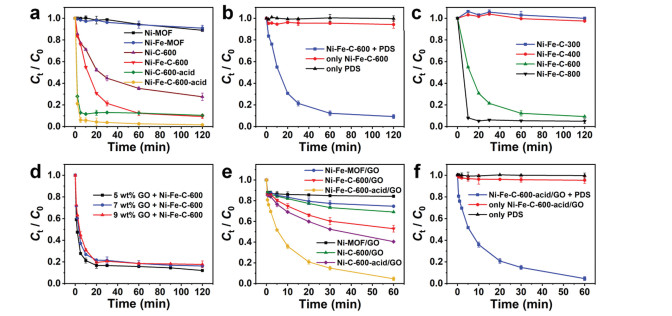
In order to reduce the metal ions leaching, the Ni-C-600 and Ni-Fe-C-600 were further treated by acid leaching. After acid treatment, a remarkable enhancement in the activity is achieved. Within only 10 min, 88.42% and 94.22% PCA was degraded by Ni-C-600-acid and Ni-Fe-C-600-acid assisted PDS system. The k values of 0.3986 min−1 and 0.5501 min−1 are obtained for the Ni-C-600-acid/PDS and Ni-Fe-C-600-acid/PDS systems, respectively (Fig. S2a). The PCA removal rates obtained by the catalysts synthesized by the second way are shown in Fig. 4d. As the GO increased from 5 wt% to 9 wt%, the GO + Ni-Fe-C-600/PDS systems show similar removal rates and as well as k values for PCA (Fig. S2c in Supporting information).
Compared with the two-step synthesis method, the one-step in-situ synthesis method enables the direct growth of MOF structures on the GO surface. After calcination, the Ni-Fe nanoparticles on GO are distributed more uniformly, and the combination of GO and Ni-Fe nanoparticles is much stronger for robust catalyst. As shown in Fig. 4e, the Ni-MOF/GO and Ni-Fe-MOF/GO based PDS systems show weak degradation efficiencies. Notably, the excess metal particles on the catalyst surface can be removed by acid washing, which effectively reduces the metal leaching and exposes more active sites in the catalyst. The degradation efficiency of the Ni-C-600-acid/GO/PDS and Ni-Fe-C-600-acid/GO/PDS systems was significantly enhanced after acid washing. In particular, using a small Ni-Fe-C-600-acid/GO catalyst dosage of 15 mg/L to activate PDS, 95.38% PCA (0.15 mmol/L) can be degraded within 60 min. The PCA degradation rate of the Ni-Fe-C-600-acid/GO system is found to be higher than that of the Ni-C-600-acid/GO system, indicating that the Fe element improves the activity of the catalyst.
The pseudo first-order kinetic model was utilized to evaluate the kinetic rate constants of the catalytic reactions for PCA degradation. As shown in Fig. S2d (Supporting information), the k sequence in the studied systems is as follows: Ni-MOF/GO/PDS (0.0013 min−1) < Ni-Fe-MOF/GO/PDS (0.0035 min−1) < Ni-C-600/GO/PDS (0.0048 min−1) < Ni-Fe-C-600/GO/PDS (0.0094 min−1) < Ni-C-600-acid/GO/PDS (0.0137 min−1) < Ni-Fe-C-600-acid/GO/PDS (0.0494 min−1). The highest k value in the Ni-Fe-C-600-acid/GO/PDS system further confirms the superior catalytic effect of Ni-Fe-C-600-acid/GO. The one-step synthesis of Ni-Fe-C-600-acid/GO catalyst has a better catalytic effect. Moreover, this catalyst can degrade higher concentration of PCA in shorter time with the reduction of catalyst dosage and PDS dosage. Fig. 4f shows that, in the Ni-Fe-C-600-acid/GO/PDS system, PCA cannot be degraded only by PDS or only by the catalyst, which reveals that the PCA is degraded by catalyst activation of PDS. The comparison of the PCA degradation performance by different catalyst systems is shown in Table S3 (Supporting information) [4-6, 31-33]. It is shown that the Ni-Fe-C-600-acid/GO system exhibits high PCA degradation performance. Moreover, the PDS/PCA ratio of this system (1.67) is smaller than other systems (5-50), and the catalyst/PCA ratio of this system (0.79) is also much lower than other systems (3.92-156.86).
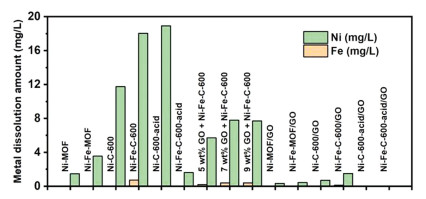
The metal leaching data are shown in Fig. 5. It is shown that the Ni2+ leaching of 2D Ni-MOF and Ni-Fe-MOF reaches 1.46 and 3.54 mg/L (Fig. 5 and Table S1 in Supporting information), which are much higher than the limit concentration (0.5 mg/L) specified in the Emission Standards for Pollutants in Copper and Cobalt Nickel Industry (GB25467-2010). The 2D MOFs without further modification are not suitable for serving as PDS catalysts because of the low activity and high Ni2+ leaching. Although direct carbonization products possess higher activity, the Ni2+ leaching of Ni-C-600 and Ni-Fe-C-600 is as high as 11.75 and 18.04 mg/L, respectively. Thus, it is unwise to pursue high efficiency at the sacrifice of the metal ion leaching. The corresponding Ni2+ leaching (Ni-Fe-C-600-acid) was reduced to 1.61 mg/L after acid treatment, indicating the acid treatment may help minimize the leaching issue (Table S1). Compared with Ni-Fe-C-600, the removal efficiency is increased and the total metal ions leaching is decreased. Nevertheless, the Ni2+ leaching is still high. After calcination, Ni-C-600/GO and Ni-Fe-C-600/GO exhibit enhanced PCA degradation rates. However, the Ni metal leaching during the reaction is too high to meet the release standard (Fig. 5 and Table S2 in Supporting information). Notably, the excess metal particles on the catalyst surface can be removed by acid washing, which effectively reduces the metal leaching and exposes more active sites in the catalyst. The degradation efficiency of the Ni-C-600-acid/GO/PDS and Ni-Fe-C-600-acid/GO/PDS systems was significantly enhanced after acid washing, and the metal leaching was negligible. The above data demonstrate that the one-step synthesis of Ni-Fe-C-600-acid/GO catalyst results in a more compact bonding of 2D MOF and GO nanosheets in the in-situ synthesis process with less metal leaching and better catalytic effect.
As for the reactive species in this PDS activation system, previous studies of MOF-derived catalysts supported on GO show that free radicals (•OH and SO4•‒) and non-free radicals (1O2 and electron transfer) both contribute to the degradation reaction [8, 9]. The degradation pathway of PCA by PDS activation involves possible intermediates include aniline, N-(4-chlorophenyl)-p-phenylenediimine, 1-(4-chlorophenyl)-3-phenlurea, and 5-chloro-2-((4-chlorophenyl) diazenyl) phenol [31].
In conclusion, 2D MOF without any modification is not suitable for PDS activation because of the poor catalytic activity and high metal ion leaching. Direct carbonization of 2D MOF can increase the activity but this method cannot solve the high leaching issue. The acid treatment of carbonization products can further improve the catalytic activity and decrease the metal ion leaching. Loading 2D MOF on carbon support (e.g., GO) is a promising strategy to improve the activity and stability of the catalyst. It is worth noting that the in-situ growth of 2D MOF on GO offers a better combination between the metal catalyst and support compared with the two-step synthesis method.
The authors declare that they have no known competing financial interests or personal relationships that could have appeared to influence the work reported in this paper.
This work was supported by the National Key R&D Program of China (No. 2019YFC1905400).
Supplementary material associated with this article can be found, in the online version, at doi:
Z. Wang, W. Qiu, S. Pang, et al., Water Res. 172 (2020) 115504. doi: 10.1016/j.watres.2020.115504
S. Nimai, H. Zhang, Z. Wu, et al., Chin. Chem. Lett. 31 (2020) 2657–2660. doi: 10.1016/j.cclet.2020.08.008
W. Peng, Y. Fu, L. Wang, et al., Chin. Chem. Lett. 32 (2021) 2544–2550. doi: 10.1016/j.cclet.2021.01.028
N. Du, Y. Liu, Q. Li, et al., Chem. Eng. J. 413 (2021) 127545. doi: 10.1016/j.cej.2020.127545
Y. Liu, W. Miao, X. Fang, et al., Chem. Eng. J. 380 (2020) 122584. doi: 10.1016/j.cej.2019.122584
Y. Liu, X. Chen, Y. Yang, et al., Chem. Eng. J. 358 (2019) 408–418. doi: 10.1016/j.cej.2018.10.012
K. Zhang, D. Sun, C. Ma, et al., Chemosphere 241 (2020) 125021. doi: 10.1016/j.chemosphere.2019.125021
Y. Liu, W. Miao, Y. Feng, et al., J. Hazard. Mater. 403 (2021) 123691. doi: 10.1016/j.jhazmat.2020.123691
X. Liu, Y. Liu, H. Qin, et al., Environ. Sci. Technol. 56 (2022) 2665–2676. doi: 10.1021/acs.est.1c07469
Z. Yang, Y. Lin, F. Jiao, et al., J. Energy Chem. 49 (2020) 189–197. doi: 10.1016/j.jechem.2020.02.025
F. Wu, X. Guo, G. Hao, et al., Nanoscale 11 (2019) 14785–14792. doi: 10.1039/C9NR03430G
L.L. Zhou, P.X. Liu, Y. Ding, et al., Chem. Eng. J. 430 (2022) 133134. doi: 10.1016/j.cej.2021.133134
Y. Liu, Y. Yang, W. Miao, et al., ACS EST Eng. (2021) 1618–1632.
J. Wang, N. Li, Y. Xu, H. Pang, Chem. Eur. J. 26 (2020) 6402–6422. doi: 10.1002/chem.202000294
K. Wang, C. Miao, Y. Liu, et al., Appl. Catal. B: Environ. 270 (2020) 118878. doi: 10.1016/j.apcatb.2020.118878
F.L. Li, P. Wang, X. Huang, et al., Angew. Chem. Int. Ed. 58 (2019) 7051–7056. doi: 10.1002/anie.201902588
Z. Dong, Q. Zhang, B.Y. Chen, J. Hong, Chem. Eng. J. 357 (2019) 337–347. doi: 10.1016/j.cej.2018.09.179
Z. Li, S. Luo, Y. Yang, J. Chen, Chemosphere 216 (2019) 499–506. doi: 10.1016/j.chemosphere.2018.10.133
D. Yue, X. Yan, C. Guo, et al., J. Phys. Chem. Lett. 11 (2020) 968–973. doi: 10.1021/acs.jpclett.9b03597
K. Ma, R. Wang, T. Jiao, et al., Colloid Surf. A 584 (2020) 124023. doi: 10.1016/j.colsurfa.2019.124023
B. Xu, S. Qi, M. Jin, et al., Chin. Chem. Lett. 30 (2019) 2053–2064. doi: 10.1016/j.cclet.2019.10.028
D. Guo, L. Zhao, H. Zhang, Chin. Chem. Lett. 33 (2022) 1263–1266. doi: 10.1016/j.cclet.2021.07.051
J. Kang, H. Zhang, X. Duan, et al., J. Clean. Prod. 218 (2019) 202–211. doi: 10.1016/j.jclepro.2019.01.323
L. Wang, X. Yu, X. Li, et al., Chem. Eng. J. 383 (2020) 123099. doi: 10.1016/j.cej.2019.123099
X. Li, S. Zhang, M. Zhang, et al., J. Hazard. Mater. 409 (2021) 124990. doi: 10.1016/j.jhazmat.2020.124990
S. Tang, M. Zhao, D. Yuan, et al., Chemosphere 268 (2021) 129315. doi: 10.1016/j.chemosphere.2020.129315
G. Peng, M. Zhang, S. Deng, et al., Chem. Eng. J. 341 (2018) 361–370. doi: 10.1016/j.cej.2018.02.064
S.X. Wei, J.J. Miao, Y.H. Li, et al., Environ. Toxicol. Pharmacol. 83 (2021) 103582. doi: 10.1016/j.etap.2021.103582
D.D. Dantzger, C.M. Jonsson, H. Aoyama, Ecotoxicol. Environ. Saf. 148 (2018) 367–376. doi: 10.1016/j.ecoenv.2017.10.054
J. Zheng, S. Xu, Z. Wu, Z. Wang, Sep. Purif. Technol. 211 (2019) 753–763. doi: 10.1016/j.seppur.2018.10.046
I. Hussain, Y. Zhang, S. Huang, X. Du, Chem. Eng. J. 203 (2012) 269–276. doi: 10.1016/j.cej.2012.06.120
Y. Zhang, H.P. Tran, X. Du, et al., Chem. Eng. J. 308 (2017) 1112–1119. doi: 10.1016/j.cej.2016.09.104
I. Hussain, Y. Zhang, S. Huang, Q. Gao, RSC Adv. 5 (2015) 41079–41087. doi: 10.1039/C5RA02221E

Figure 1 The schematic of the preparation processes of Ni-Fe-C, GO + Ni-Fe-C, and Ni-Fe-C-acid/GO catalysts.

Figure 2 SEM images of (a) Ni-MOF, (b) Ni-Fe-MOF, (c) Ni-Fe-C-600, (d) GO + Ni-Fe-MOF, (e, f) GO + Ni-Fe-C-600, (g) Ni-Fe-C-600/GO, and (h, i) Ni-Fe-C-600-acid/GO.

Figure 3 XRD patterns of (a) Ni-MOF, Ni-Fe-MOF, GO + Ni-Fe-MOF, Ni-Fe-MOF/GO, (b) Ni-Fe-C-600, 5 wt% GO + Ni-Fe-C-600, 7 wt% GO + Ni-Fe-C-600, 9 wt% GO + Ni-Fe-C-600, Ni-Fe-C-600/GO, and (c) Ni-C-600-acid/GO and Ni-Fe-C-600-acid/GO.

Figure 4 (a) PCA removal by PDS activation with GO-free catalysts. (b) Effects of adsorption and persulfate oxidation of Ni-Fe-C-600 on PCA removal. (c) Effect of annealing temperature on the catalytic activity of Ni-Fe-C catalysts. (d) PCA removal by PDS activation using Ni-Fe-C-600 loaded on GO with different GO amounts. (e) Comparison of PCA removal rate by PDS activation with catalysts prepared by one-step method. (f) Effects of adsorption and persulfate oxidation of Ni-Fe-C-600-acid/GO on PCA removal. Reaction conditions of (a-d): [catalysts] = 100 mg/L, [PCA] = 0.1 mmol/L, [PDS] = 1.0 mmol/L, pH 7.0, T = 25 ℃. Reaction conditions of (e, f): [catalysts] = 15 mg/L, [PDS] = 0.25 mmol/L, [PCA] = 0.15 mmol/L, pH 7.0, T = 25 ℃.

Figure 5 Metal ion leaching during the activation of PDS using GO-free catalyst and GO supported catalysts (two-step synthesis). Reaction conditions: [catalysts] = 100 mg/L, [PDS] = 1.0 mmol/L, [PCA] = 0.1 mmol/L, pH 7.0, T = 25 ℃. Metal ion leaching during the activation of PDS using GO supported catalysts (one-step synthesis). Reaction parameters: [catalysts] = 15 mg/L, [PDS] = 0.25 mmol/L, [PCA] = 0.15 mmol/L, pH 7.0, T = 25 ℃.

 扫一扫看文章

扫一扫关注我们
 DownLoad:
 下载:
下载: