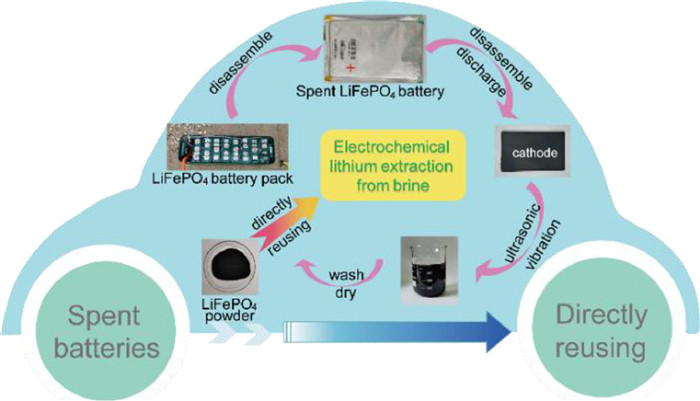
Figure 1.
Schematic diagram of recycling process for spent LiFePO4 powder.
Direct reuse of LiFePO4 cathode materials from spent lithium-ion batteries: Extracting Li from brine
Miao Du , Jin-Zhi Guo , Shuo-Hang Zheng , Yan Liu , Jia-Lin Yang , Kai-Yang Zhang , Zhen-Yi Gu , Xiao-Tong Wang , Xing-Long Wu

With the extensive application of lithium-ion batteries (LIBs) in portable devices, electric vehicles, smart grid and so on, the serious imbalance between demand and supply of lithium (Li) resources is becoming more pronounced [1,2]. The proportion of lithium consumed in batteries is predicted to increase from 43% in 2017 to 65% in 2025 [3], and residual lithium reserve on land will be depleted by 2080 as the demand for lithium resources increases sharply in the future [4,5]. It is clear that the existing lithium resources on land cannot satisfy ever-growing demands [6,7]. Therefore, making full use of existing lithium resources to extract and recycle lithium has important research prospect and significance [4]. Generally, commercial lithium products are obtained mainly from lithium minerals (e.g., spodumene, lepidolite, petalite, amblygonite) and Salt Lake brine (e.g., Qarhan Salt Lake, West Taijinar Salt Lake, Atacama Salt Lake) [1,8]. According to statistics, lithium resources in Salt Lake brine account for 83% of global proven [6]. Among them, China provides about 12% of the global brine lithium resources, which is more than 80% of the total domestic lithium resources [9]. Compared to lithium minerals, the Salt Lake brine with the characteristics of abundant reserves, high lithium content and low extraction cost. Therefore, extracting lithium from brine has become one of the best choices to solve the imbalance between limited supply and surging demand of lithium resources.
Normally, the brine contains different concentrations of Li+, K+, Ca2+, Na+, Mg2+ and other metal ions, and the hydration radius and chemical properties of Li+ and Mg2+ are similar, so it is more difficult to separate and extract lithium from salt lakes [1]. Various techniques have been developed for lithium extraction from brine, including chemical precipitation [10], solvent extraction [11,12], ion exchange adsorption [13,14], membrane separation [15,16] and electrochemical lithium extraction method (ELEM) [17,18]. Among them, ELEM with the advantages of high selectivity, friendly environment, simple operation, and non-requirement of additional chemical reagents is suitable for lithium extraction from salt lakes with different characteristic systems, arousing the widespread attention in recent years [19,20]. Various materials have been applied to electrochemical lithium extraction, for example, Kanoh et al. reported firstly the feasibility of electrochemical lithium extraction by λ-MnO2/Pt, and proved that only Li+ could de-intercalate/intercalate in λ-MnO2/Pt three-electrode system through cyclic voltammograms curves. Moreover, LiFePO4 type and LiMn2O4 type materials with Li+ intercalation/de-intercalation mechanism are mainly used materials under the consideration of the pH and working potential. LiFePO4 system has been widely studied in electrochemical lithium extraction due to its stable crystal structure, excellent adaptability to different brine, higher availability and friendly environment [21–24].
As one of the ideal cathode materials for commercial LIBs, LiFePO4 had been applied in new energy fields, especially in the field of electric vehicles, due to its high stability, cost-effective and high thermal safety [25–27]. Usually, the average age of LIBs is about 5–8 years, and the early industrial application of LiFePO4 cathode material will face earlier scrap problem [28–30]. At present, China's first power batteries for new energy vehicles have come into decommissioning period, moreover, with the arrival of the retirement peak of LiFePO4 batteries, recycling problems of spent batteries are to follow. If untreated/treated incomplete, hazardous substances of spent power batteries can enter the environment, which can cause heavy metal pollution and generate toxic chemical gasses, harming the environment and human health [31]. However, traditional recycling processes of spent LiFePO4 batteries are not economically feasible due to the tedious procedures, high cost and high energy consumption [32]. Therefore, the realization of efficient spent LiFePO4 batteries recovery and forming a virtuous cycle can not only save resources and alleviate the shortage of Li, but also help solve the problem of environmental pollution.
Considering that the phosphate material has stable structure, and the main problem of spent LiFePO4 is lithium loss, there is no obvious impurity except LiFePO4 and FePO4 phases. Herein, we propose firstly the strategy of extracting lithium from brine by spent LiFePO4, realizing the direct reuse of spent LiFePO4. The three electrodes system with spent LiFePO4 as working electrode has an appropriate lithium extraction performance, and the maximum lithium capacity is 14.62 mgLi/gLiFePO4 at 17 mA, the separation coefficient can reach up to 210.5, and the energy consumption in a complete lithium extraction process is only 0.768 Wh/gLi. In this work, a novel and effective strategy for directly reusing low cost spent LiFePO4 is proposed, which not only broadens the horizons of LIBs recovery, but also provides a new avenue for lithium extraction from Salt Lake brine.
Recovery of spent LiFePO4 powder: At first, the spent LiFePO4 battery pack is pretreated and disassembled, and then the LiFePO4 cathode obtained from the spent LiFePO4 battery after discharge and disassembly. Finally, after ultrasonic vibration, washing, filtration and drying, the spent LiFePO4 powder can be obtained for lithium extraction from simulated brine.
The crystal structure of spent LiFePO4 powder is determined by X-ray diffraction (XRD, Rigaku D/MAX-2500). The valence states are analyzed by X-ray photoelectron spectroscopy (XPS, ESCALab220iXL). Carbon content and elemental composition of material are performed by elemental analysis (EA3000) together with inductive coupled plasma atomic emission spectrometer (ICP-AES, Seiko Instruments). Raman spectroscopy (HORIBA) is used to characterize molecular vibration and carbon composition. As for morphology and the surface configuration, they are examined by scanning electron microscope (SEM, HITACHI SU8010) and transmission electron microscope (TEM, JEOL-2100F).
All the electrochemical properties are tested in electrolytic cell with three electrodes, where reusable Pt and saturated calomel electrode (SCE) are used as counter electrode (CE, 2.5 × 2.5 cm2) and reference electrode (RE), respectively. The major metal ions component (Li+, Na+, K+, Ca2+ and Mg2+) of real Zabuye Salt Lake brine is listed in Table S1 (Supporting information). Based on Na+ has the major effect, to clearly investigate the effect of Na+ on the extraction of Li+, the same as the previous reports [33,34], we extract lithium from the simulated brine (4.5 mol/L NaCl and 0.2 mol/L LiCl) by ELEM, which are corresponding to the concentrations of real Zabuye Salt Lake (South Lake). The solvent uses in the electrolyte is ultrapure water. The LiFePO4 working electrode (WE, 2.5 × 2.3 cm2) is prepared by mixing spent LiFePO4 powder, acetylene black and polyvinylidene fluoride at the mass ratio of 8:1:1 into N-methyl-2-pyrrolidones, and the coating area of slurry on carbon cloth is about 2.5 × 1.8 cm2. Finally, the electrodes are dried in vacuum oven at 120 ℃ for 24 h. The simulated brine (40 mL) is composed of 4.5 mol/L NaCl and 0.2 mol/L LiCl, and the recovery solution (30 mL) is 0.05 mol/L KCl. The cyclic voltammograms (CV) and chronopotentiometry (CP) tests in different voltage range are collected on the electrochemical workstation (CHI 660e). Before every experiment, the electrolyte resistance is tested by electrochemical impedance spectroscopy (EIS) in the range of 106-0.01 Hz, and it is conducted on PMC2000 from Princeton Applied Research. After extracting lithium from brine, wash the electrodes and put them into the recovery solution. When the de-lithiation is completed, wash the electrodes again and put them back into the original brine to start the next cycle. Before each electrochemical test, pumped Ar into the sealed electrolytic cell for 40 min to remove oxygen.
The lithium capacity could use the Eqs. 1 and 2 to calculate:
|
|
(1) |
|
|
(2) |
where CCP and CICP are the lithium capacity (mgLi/gLiFePO4) calculated according to the CP and ICP-AES test results, respectively; t is the time of releasing Li+ in the recovery solution (s); cICP is the concentration of Li+ in the recovery solution (mol/L); V is the volume of recovery solution (L); mLiFePO4 is the mass of LiFePO4 on WE (g).
The rejection rate of Na+ could be calculated by Eq. 3 [35]:
|
|
(3) |
where RNa is the rejection rate of Na+, cB and VB are the concentration and volume of Na+ in the brine, cR and VR are the concentration volume of recovery solution.
The separation coefficient could be calculated by Eq. 4 [35]:
|
|
(4) |
where α is the separation coefficient of Li+ and Na+, cLi-R and cNa-R are the concentration of Li+ and Na+ in the recovery solution, cLi-B and cNa-B are the concentration of Li+ and Na+ in the brine.
The energy consumption and ohmic losses of extracting and releasing Li+ are calculated by Eqs. 5 and 6 [36].
|
|
(5) |
|
|
(6) |
where W stands for the electrical energy consumption (Wh/gLi), WR is ohmic losses (Wh/gLi), U is the average voltage (V), I is electrolysis current (A), Rs is solution resistance (Ω).
The energy consumption (W = W1 + W2) for a complete lithium extraction process is composed of two parts, extracting Li+ from brine (W1) and releasing Li+ to recovery solution (W2). Both of W1 and W2 are calculate by Eq. 5, W is the energy consumption of extracting 1.0 g Li+. The ohmic losses (WΩ) is calculated by Eq. 6.
Fig. 1 is the schematic diagram of recycling process for spent LiFePO4 powder. Firstly, the spent LiFePO4 battery pack was disassembled into individual LiFePO4 batteries. Then the spent LiFePO4 battery was discharged to 2 V and disassembled to get the cathode electrode. Finally, the LiFePO4 electrode was treated by ultrasonic processing, washing, filtration and drying to obtain the spent LiFePO4 powder [37,38]. After three ICP-AES parallel experiments, the elemental composition and relative content of LiFePO4 was shown in Table S2 (Supporting information). The ICP-AES results show that the relative content of Fe (1.000±0.09) in the spent powder material is higher than that of Li (0.979 ± 0.07), which indicates that there is lithium loss in spent powder (LixFePO4). Therefore, we conclude that there may be FePO4 in spent powder material, which may be caused by conversion of part LiFePO4 [32]. Based on the relative content of Fe and Li, we determined that Fe is 0.021 more than Li and spent powder material (LixFePO4) may contain about 97.9% LiFePO4 and 2.1% FePO4. The recovered LiFePO4 powder was directly reused to prepare LiFePO4 electrode applied in electrochemical extracting lithium without any processing. The strategy of directly reusing the spent LiFePO4 greatly reduces the cost of lithium extraction and lays a solid foundation for the industrialization of lithium extraction from brine.
A variety of basic characterizations were conducted on the structure, composition and morphology of spent LiFePO4 powder. Firstly, XRD pattern of LiFePO4 is shown in Fig. 2a, all the diffraction peaks correspond to the standard card of LiFePO4 (Pnma, PDF#81–1173), it shows that the main peaks of the powder material are olivine-LiFePO4. This result also indicates that the LiFePO4 has good structural stability and the crystal structure, which has no obvious change after a long cycling. The elemental composition and valence state of spent LiFePO4 were studied by XPS. According to the full spectrum (Fig. S1 in Supporting information), there are six elements of Li, Fe, P, O, F and C in powder. The detected F element may be mainly from electrolyte and binder added during the preparation of LIBs due to direct recovery of LiFePO4 material without any treatment. Fig. 2b shows the XPS spectrum of Fe 2p, it can be seen that two characteristic peaks of Fe 2p3/2 at 711.2 eV and Fe 2p1/2 at 724.8 eV correspond to valence state of Fe2+. Moreover, the binding energy of characteristic peaks at 714.4 eV and 727.8 eV represent the Fe3+ of Fe 2p3/2 and Fe 2p1/2, the two main peaks may be attributed to Fe3+ indicative of FePO4 in the spent powder, which further proves the existence of FePO4 in spent powder material [32]. Raman result shows in Fig. 2c, the band at about 945 cm−1 correspond to the symmetric stretching of PO43−. There are two obvious strong peaks at about 1350 cm−1 and 1594 cm−1, which are attributed to the D-band (disorder carbon peak) and G-band (graphitic carbon peak), and the value of ID/IG is 0.71, illustrating that the recovered materials have appropriate graphitization. In addition, the inset in Fig. 2c shows the mass ratio of four elements in spent LiFePO4 powder. And based on the test result of elemental analysis, the carbon content of spent LiFePO4 material is about 8.40 wt%. According to the ICP-AES results, the mass fractions of Fe together with Li are 28.76 wt% and 3.50 wt%. It corresponds to the results in Table S2 (Supporting information), the molar ratio of iron and lithium is higher than 1, indicating the existence of FePO4.
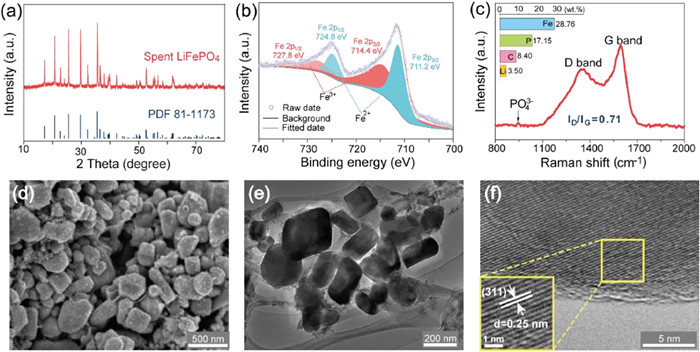
SEM and TEM were employed to reveal the morphology and microstructure of spent LiFePO4. As shown in Fig. 2d, spent LiFePO4 is irregular particles with a wide size observed ranging from 100–500 nm. Besides, EDX elemental mapping is used to characterize the element distribution (Fig. S2 in Supporting information), showing that the elements C, O, F, P and Fe are evenly distributed in LiFePO4 powder. TEM was carried out to further study the microstructure of spent LiFePO4. As shown in Fig. 2e, the spent LiFePO4 is nanomaterial, and the result is consistent with SEM image. In Fig. 2f and the inset, the high resolution TEM indicates the spent LiFePO4 material has good crystallinity, and the lattice spacing is 0.25 nm, corresponding to the (311) lattice plane of olivine-type LiFePO4. The coating layer on the surface of LiFePO4 particles may be carbon layer or cathode electrolyte interface [39]. In short, the recovered LiFePO4 powder is dominated by olivine LiFePO4, with relatively complete structure and normal morphology, which can be used for lithium extraction from brine by ELEM in the late-stage.
Fig. 3a shows the schematic diagram of the electrolytic cell for extracting lithium from simulated brine. The LixFePO4 (0 < x < 1) electrode was obtained by cycling LiFePO4 electrode for 1.5 cycles at 0.1 C in the three electrodes system of 0.25 mol/L Li2SO4. In the lithium extraction process, the WE changes between LixFePO4 and LiFePO4. In left, the lithium extraction stage, Li+ in brine will be selectively intercalated into LixFePO4 electrode (LixFePO4 + Li+ + e− → LiFePO4) during discharging process. In contrast, in the recovery solution (right), the LiFePO4 electrode releases Li+ and generates LixFePO4 (LiFePO4 → LixFePO4 + Li+ + e−), which can be used directly for the next cycle after washing and drying. By repeating this process, the continuous extract lithium from brine and the enrich lithium in the recovery solution can be realized.
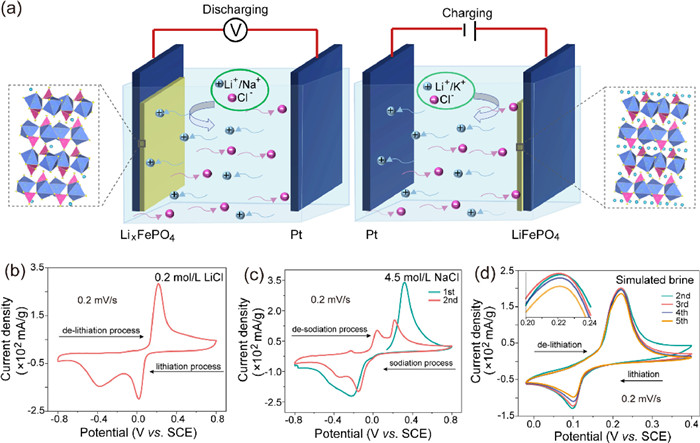
Firstly, to verify the influence of current collector (carbon cloth), CV test was carried out on the carbon cloth in 0.2 mol/L LiCl. As shown in Fig. S3 (Supporting information), the current density is ignorable, which indicates that the carbon cloth has no effect on the experimental results. It was reported that Na+ has great influence on lithium extraction and high concentration of Na+ can increase the viscosity of brine, leading to inferior lithium extraction performance and capacity degradation [33,40–42]. Therefore, to verify the high selectivity and broad feasibility, we simulate the brine containing nearly saturated impurity Na+ (4.5 mol/L NaCl and 0.2 mol/L LiCl). LiFePO4 is a selective electrode for lithium ions just under the premise of within a suitable voltage range, Na+ also can be de-intercalated/intercalated in LiFePO4 [43,44]. Thus, in order to determine the optimal voltage range of Li+ intercalation/de-intercalation, CV tests were carried out in three different solutions. The CV of LixFePO4 electrode in different solution were measured in the voltage range from −0.8 V to 0.8 V vs. SCE. As shown in Fig. 3b, the redox peaks of LiFePO4 electrode in 0.2 mol/L LiCl are located at 0.22 V and 0.018 V. The CV curves in 4.5 mol/L NaCl are shown in Fig. 3c, the oxidation peak of the first cycle is at 0.32 V, corresponding to the release of the Li+. Compared to Fig. 3b, the potential of Li+ extraction is higher, which may be caused by the higher concentration of NaCl. And the reduction peak locates at about −0.22 V, which is correspond to the Na+ intercalation. In the second cycle, the oxidation peaks at 0.04 V and 0.22 V, and the reduction peak locates in −0.15 V. Fortunately, LiFePO4 in the LiCl solution has a higher reduction peak potential and a lower oxidation peak potential than in NaCl solution, so it is determined that the voltage range of extracting lithium from simulated brine is −0.02 ~ 0.4 V. As shown in Fig. 3d, consistent with the intercalation/deintercalation of Li+, there is only a pair of redox peaks at 0.22 V and 0.1 V, meaning that there is no Na+ intercalation/deintercalation from simulated brine in this range. After five cycles, the redox peaks have no obvious change, indicating that the LiFePO4 electrode has appropriate reversibility even if the electrolyte contains high concentration of Na+ impurity. In addition, compared to the second cycle, the intensity of the oxidation peak increases in the third cycle, which indicates LiFePO4 electrode has an activation process due to the high loading mass.
CP curves of LiFePO4 electrode is shown in Fig. 4a, LixFePO4 electrode was obtained after 1.5 cycles, and this process not only activates the WE electrode, but also avoids initial irreversible reaction. In the process of preparing LixFePO4 electrode, the recovered Li+ is enriched in Li2SO4 solution, which can also be used to prepare commercial lithium products. To obtain the maximum productivity, WE with different areal densities were explored to determine the optimum loading mass. As shown in Figs. 4b and c, LiFePO4 electrodes with 5 and 10 mg/cm2 have similar de-lithiation duration in the recovery solution, and the lithium capacity of the latter is slightly higher than the former (14.67 vs. 14.46 mgLi/gLiFePO4). Compared with 5 mg/cm2, the LiFePO4 electrode with areal density of 10 mg/cm2 has higher loading mass and can obtain higher capacity. When the loading mass reaches 15 mg/cm2, WE cannot work properly, indicating that the areal density of 10 mg/cm2 is the optimal loading mass, and 1 g LiFePO4 can extract 14.67 mg Li+ with appropriate performance.
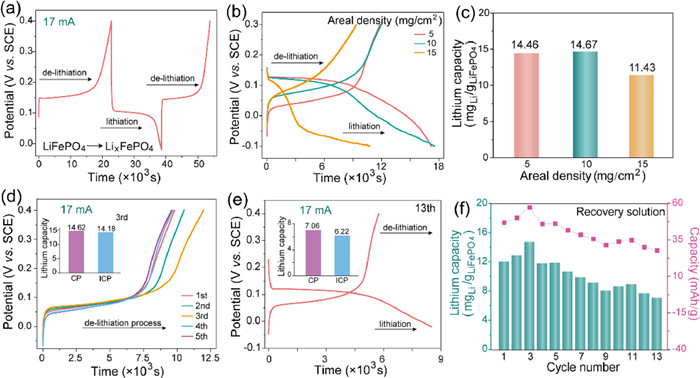
CP tests of LiFePO4 electrode with the areal density of 10 mg/cm2 were performed in the voltage range of −0.02 ~ 0.4 V. Fig. 4d shows the charging curves of LiFePO4 electrode in recovery solution for initial first five cycles. The lithium release time of the first cycle is close to 104 s, corresponding to lithium extraction capacity of about 12 mgLi/gLiFePO, and the maximum extraction capacity is 14.62 mgLi/gLiFePO4 at third cycle. Then the release time of the fourth and fifth cycles are close to the first one. Obviously, the lithium release time of the first three cycles increase successively, indicating that the LiFePO4 electrode has an activation process due to the high loading mass, which is consistent with the result of Fig. 3d. The result of lithium extraction from brine at 13th cycle is shown in Fig. 4e, and the lithium release time is approach to 6 × 10³ s, which is equivalent to the lithium extraction capacity of about 7 mgLi/gLiFePO4. To further verify the lithium capacity, we calculate the lithium extraction capacity of third cycle by both CP and ICP-AES results, respectively (the insert of Fig. 4d). The calculation formulas for lithium extraction capacity are shown in Eqs. 1 and 2. The capacity obtained by releasing time (14.62 mgLi/gLiFePO4) is basically consistent well with the acquired by measuring lithium concentration in the recovery solution (14.18 mgLi/gLiFePO4). The lithium capacity of 13th cycle measured by two ways are shown in the insert of Fig. 4e, and two results are also similar. As shown in Fig. 4f, the lithium extraction capacity and corresponding capacity are shown in detail. The capacity changing trend and value of each cycle can be clearly observed by the bar chart and line chart. After 13 cycles, the capacity retention is close to 60%, it shows that the recovered LiFePO4 from spent LIBs can be directly used as WE, and has appropriate lithium extraction capacity and capacity retention rate is comparable to the previous reports [5,36]. In addition, the lithium extraction capacity will be improved after calculated the mass of active material accurately, because the all component of spent LiFePO4 powder are regarded as active material including binder and acetylene black. The capacity and stability of the working electrode can be improved from two aspects: the first is the electrode fabrication technology, and the electrochemical performance of the thick electrode with high loading cannot be fully used [45]; the second is the modification of the spent LiFePO4 material, such as carbon coating [46], nanocrystallization, etc. In the subsequent work, we will improve the capacity and stability of the material by above various strategies. The spent LiFePO4 powder is expected to achieve large-scale application in lithium extracting from brine after improvement. Considering the economic benefits, the spent LiFePO4 is one of the best materials for lithium extraction from brine because of its large amount, low price and especially proper lithium extraction capacity. To further meet the practical application, in the subsequent work we will explore in depth the content related to lithium extraction from natural brine by using spent LiFePO4.
In order to verify the purity of the recovery solution, we measured the concentration of Na+ and Li+ in the recovery solution by ICP-AES test, and calculated the mass ratio of Na/Li in brine and recovery solution at the first cycle. As shown in Table 1, the concentration of Na+ and Li+ in recovery solution are 6.79 × 10⁻³ g/L and 1.92 × 10⁻² g/L, respectively. The Na/Li mass ratio decreases sharply from 74.43 of brine to 0.35 of recovery solution, which decreased by about 213 times, indicating that the purity of Li+ in the recovery solution is greatly improved. The purity of Li+ in recovery solution is 73.9%. Although there is still room for further improvement, the purity of the recovery solution has been significantly improved compared to the simulated brine (lithium purity is 1.3%). In the following work, we will work to further improve the purity of recovery solution.
 DownLoad:
CSV
DownLoad:
CSV

|
The rejection rate of Na+ calculated by Eq. 3 is greater than 99.99%, and the separation coefficient calculated by Eq. 4 can reach up to 210.5, showing that the LiFePO4 electrode still has good Li+ selectivity even in high Na+ concentration brine. And these separation parameters about Na+ are significantly better than previous reports [40]. All the results show that lithium extraction from brine by ELEM can well separate Na+ and Li+ to obtain high-purity lithium.
In addition, energy consumption is also one of parameters to be considered during the lithium extraction from brine progresses, which refers to large scale industrial production. Based on this, we discuss energy consumption in this section. Take the first cycle as an example, the energy consumption of extracting and releasing 1 g Li+ are assessed by Eq. 5, and they are 0.309 Wh/gLi and 0.459 Wh/gLi, respectively. Therefore, the total energy consumption in a complete lithium extraction process is 0.768 Wh/gLi, which is lower than that of some previous reports [47,48]. It is worth noting that the comparison of energy consumption with the previous literature is based on the premise of extracting lithium from brine by electrochemical method and the energy consumption of all the comparison is to extract 1 g Li+. Table 2 shows the comparison of electrochemical Li+ extraction system with reported systems. It is noteworthy that this experiment is the first to use spent LiFePO4 in lithium extraction from brine. Under the condition of low Li+ concentration and close to saturation Na+ concentration, we obtain excellent separation performance, appropriate capacity and energy consumption. This further shows that the scheme is expected to achieve large-scale application.
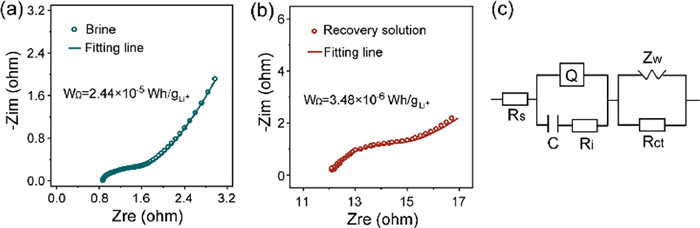
Before each experiment, the solution resistance (Rs) was tested by potentiostatic EIS to evaluate ohmic energy consumption (WΩ). As shown in Figs. 5a and b, the Nyquist plots consist of two semi-circles in the high and medium frequency and an inclined line in the low frequency, and Fig. 5c shows the equivalent circuit diagram fitted by EIS. WΩ is calculated by Eq. 6, the results of WΩ and fitting results are shown in Table 3. WΩ in the brine and the recovery solution are 2.44 × 10⁻⁵ and 3.48 × 10⁻⁶ Wh/gLi, respectively. Such small values indicate that lithium extraction from brine by ELEM has commendable feasibility. In the recovery solution, Rs value is significantly larger than that of in brine, because of its lower concentration [53]. Moreover, the WΩ in the recovery solution is lower than that of in brine due to the shorter time of lithium release than extraction.
 DownLoad:
CSV
DownLoad:
CSV

|
In summary, we propose a novel ELEM for lithium extraction from brine by directly reusing spent LiFePO4 powder. According to CV and CP tests, it is proved that spent LiFePO4 powder has appropriate lithium capacity and excellent separation performance in lithium extraction from brine. The maximum lithium capacity is 14.62 mgLi/gLiFePO4 at 17 mA and the rejection rate of Na+ and separation coefficient can reach up to 99.99% and 210.5, respectively. The energy consumption in a complete lithium extraction process is only 0.768 Wh/gLi. Electrochemical lithium extraction from brine by directly reusing spent LiFePO4 is expected to be used in large-scale industry from the perspectives of resource abundance, cost, selectivity, productivity and energy consumption, which not only provides a new strategy for the recovery of spent LIBs, but also develops a new avenue for lithium extraction from brine.
The authors declare that they have no known competing financial interests or personal relationships that could have appeared to influence the work reported in this paper.
This work was supported by the National Natural Science Foundation of China (Nos. 52173246, 91963118, and 52102213), and the Science Technology Program of Jilin Province (No. 20200201066JC).
Supplementary material associated with this article can be found, in the online version, at doi:
P. Xu, J. Hong, X.M. Qian, et al., J. Mater. Sci. 56 (2020) 16-63.
H.R. Yao, L. Zheng, S. Xin, Y.G. Guo, Sci. Chin. Chem. 65 (2022) 1076-1087. doi: 10.1007/s11426-022-1257-8
S.X. Yang, F. Zhang, H.P. Ding, P. He, H.S. Zhou, Joule 2 (2018) 1648-1651. doi: 10.1016/j.joule.2018.07.006
X. He, K. Sumanjeet, K. Robert, Joule 4 (2020) 1357-1358. doi: 10.1016/j.joule.2020.06.015
L. Wang, K. Frisella, P. Srimuk, et al., Sustain. Energy Fuels 5 (2021) 3124-3133. doi: 10.1039/d1se00450f
J.J. Wang, X.Y. Yue, P.F. Wang, et al., Renew. Sustain. Energy Rev. 154 (2022) 111813. doi: 10.1016/j.rser.2021.111813
Y. Liu, Z. Yu, J. Chen, et al., Chin. Chem. Lett. 33 (2022) 1817-1830. doi: 10.1016/j.cclet.2021.09.023
G.L. Zhou, L.L. Chen, X.W. Li, et al., Green Energy Environ. (2022) https://doi.org/10.1016/j.gee.2021.12.002. doi: 10.1016/j.gee.2021.12.002
Y. Sun, Q. Wang, Y.H. Wang, R.P. Yun, X. Xiang, Sep. Purif. Technol. 256 (2021) 117807. doi: 10.1016/j.seppur.2020.117807
D.F. Liu, Z. Li, L. He, Z.W. Zhao, Desalination 514 (2021) 115186. doi: 10.1016/j.desal.2021.115186
R.B. Bai, J.F. Wang, D.G. Wang, Y.Q. Zhang, J.J. Cui, Sep. Purif. Technol. 274 (2021) 119051. doi: 10.1016/j.seppur.2021.119051
Z.Q. Ren, X.Y. Wei, R.J. Li, et al., Sep. Purif. Technol. 269 (2021) 118756. doi: 10.1016/j.seppur.2021.118756
R. Marthi, Y.R. Smith, Sep. Purif. Technol. 254 (2021) 117580. doi: 10.1016/j.seppur.2020.117580
J. Zhong, S. Lin, J.G. Yu, Desalination 505 (2021) 114983. doi: 10.1016/j.desal.2021.114983
L. Wang, D. Rehman, P.F. Sun, et al., ACS Appl. Mater. Interfaces 13 (2021) 16906-16915. doi: 10.1021/acsami.1c02252
H.W. Peng, Q. Zhao, Adv. Funct. Mater. 31 (2021) 2009430. doi: 10.1002/adfm.202009430
J.J. Niu, W.J. Yan, X.Y. Song, et al., Sep. Purif. Technol. 274 (2021) 118995. doi: 10.1016/j.seppur.2021.118995
W.H. Xu, L.H. He, Z.W. Zhao, Desalination 503 (2021) 114935. doi: 10.1016/j.desal.2021.114935
Y. Zhang, W. Sun, R. Xu, L. Wang, H.H. Tang, J. Clean Prod. 285 (2021) 124905. doi: 10.1016/j.jclepro.2020.124905
G.L. Zhou, L.L. Chen, Y.H. Chao, et al., J. Energy Chem. 59 (2021) 431-445. doi: 10.1016/j.jechem.2020.11.012
H.J. Liang, Z.Y. Gu, X.Y. Zheng, et al., J. Energy Chem. 59 (2021) 589-598. doi: 10.1016/j.jechem.2020.11.039
J.M. Peng, Z.Q. Chen, Y. Li, et al., Rare Metals 41 (2021) 951-959. doi: 10.1002/nav.21979
C. Wu, Y. Zhou, X. Zhu, et al., Acta Phys. Chim. Sin. 2 (2020) 2008044. doi: 10.3866/pku.whxb202008044
X.X. Luo, W.H. Li, H.J. Liang, et al., Angew. Chem. Int. Ed. 61 (2022) e202117661.
J.L. Yang, X.X. Zhao, W.H. Li, et al., eScience 2 (2022) 95-101. doi: 10.1016/j.esci.2021.11.001
J.L. Zhang, J.T. Hu, Y.B. Liu, et al., ACS Sustain. Chem. Eng. 7 (2019) 5626-5631. doi: 10.1021/acssuschemeng.9b00404
N.Y. Muhammad, M.N. Mohtar, M.M. Ramli, et al., Int. J. Min. Met. Mater. 8 (2020) 126-130. doi: 10.18178/ijmmm.2020.8.3.494
K. He, Z.Y. Zhang, F.S. Zhang, J. Hazard. Mater. 395 (2020) 122614. doi: 10.1016/j.jhazmat.2020.122614
Y.L. Heng, Z.Y. Gu, J.Z. Guo, X.L. Wu, Acta Phys. Chim. Sin. 37 (2020) 2005013. doi: 10.3866/pku.whxb202005013
Z.Y. Gu, J.Z. Guo, J.M. Cao, et al., Adv. Mater. 34 (2022) 2110108. doi: 10.1002/adma.202110108
R.W. Zhang, S.J. Yang, H.B. Li, T.Y. Zhai, H.Q. Li, InfoMat 4 (2022) e12305.
M. Fan, Q.H. Meng, X. Chang, et al., Adv. Energy Mater. 12 (2022) 2103630. doi: 10.1002/aenm.202103630
M. Pasta, A. Battistel, F. La Mantia, Energy Environ. Sci. 5 (2012) 9487-9491. doi: 10.1039/c2ee22977c
J.S. Kim, Y.H. Lee, S. Choi, et al., Environ. Sci. Technol. 49 (2015) 9415-9422. doi: 10.1021/acs.est.5b00032
J.C. Xiong, L.H. He, D.F. Liu, W.H. Xu, Z.W. Zhao, Desalination 520 (2021) 115326. doi: 10.1016/j.desal.2021.115326
J.Z. Yu, D.L. Fang, H. Zhang, et al., ACS Mater. Lett. 2 (2020) 1662-1668. doi: 10.1021/acsmaterialslett.0c00385
G. Harper, R. Sommerville, E. Kendrick, et al., Nature 575 (2019) 75-86. doi: 10.1038/s41586-019-1682-5
Y.F. Meng, H.J. Liang, C.D. Zhao, et al., J. Energy Chem. 64 (2022) 166-171. doi: 10.1016/j.jechem.2021.04.047
H.J. Liang, Z.Y. Gu, X.X. Zhao, et al., Angew. Chem. Int. Ed. 60 (2021) 26837-26846. doi: 10.1002/anie.202112550
L. He, W.H. Xu, Y.F. Song, et al., Glob. Chall. 2 (2018) 1700079. doi: 10.1002/gch2.201700079
X.H. Shang, B. Hu, P.F. Nie, et al., Sep. Purif. Technol. 258 (2021) 118009. doi: 10.1016/j.seppur.2020.118009
X.X. Zhang, Y. Niu, F. Xue, et al., Korean J. Chem. Eng. 38 (2021) 2141-2149. doi: 10.1007/s11814-021-0862-9
W. Tang, X. Song, Y. Du, et al., J. Mater. Chem. A 4 (2016) 4882-4892. doi: 10.1039/C6TA01111J
B. Gangaja, S. Nair, D. Santhanagopalan, ACS Sustain, Chem. Eng. 9 (2021) 4711-4721. doi: 10.1021/acssuschemeng.0c08487
J.H. Kim, J.M. Kim, S.K. Cho, N.Y. Kim, S.Y. Lee, Nat. Commun. 13 (2022) 2541. doi: 10.1038/s41467-022-30112-1
X. Wang, Z. Feng, X. Hou, et al., Chem. Eng. J. 379 (2020) 122371. doi: 10.1016/j.cej.2019.122371
G.L. Luo, G. Zhou, J. Sun, L.L. Chen, W.S. Zhu, J. Energy Chem. 69 (2022) 244-252. doi: 10.1016/j.jechem.2022.01.012
Y.X. Mu, C.Y. Zhang, W. Zhang, Y.X. Wang, Desalination 511 (2021) 115112. doi: 10.1016/j.desal.2021.115112
R. Trocoli, A. Battistel, F.L. Mantia, Chem. Eur. J. 20 (2014) 9888-9891. doi: 10.1002/chem.201403535
Z. Zhao, X. Si, X. Liu, L. He, X. Liang, Hydrometallurgy 133 (2013) 75-83. doi: 10.1016/j.hydromet.2012.11.013
D.F. Liu, S.Y. Sun, J.G. Yu, Can. J. Chem. Eng. 97 (2018) 1589-1595.
X. Xu, Y. Zhou, Z. Feng, et al., ChemPlusChem 83 (2018) 521-528. doi: 10.1002/cplu.201800185
J.W. Fang, J. Wang, Z.Y. Guo, Y.Y. Zhao, J.S. Yuan, Sep. Purif. Technol. 280 (2022) 119726. doi: 10.1016/j.seppur.2021.119726

Figure 2 Characterization results of spent LiFePO4. (a) XRD pattern. (b) XPS spectra in Fe 2p region. (c) Raman spectrum (inset: mass fractions of Fe, P, C and Li). (d) SEM image. (e, f) TEM images under different magnifications.

Figure 3 (a) Schematic diagram of three-electrode system for extracting lithium from brine (left) and enriching lithium in the recovery solution (right). CV tests of LiFePO4 electrode in (b) 0.2 mol/L LiCl and (c) 4.5 mol/L NaCl. (d) Simulated brine of 0.2 mol/L LiCl and 4.5 mol/L NaCl.

Figure 4 CP results of LixFePO4/LiFePO4 lithiation/de-lithiation processes. (a) 1.5 cycles in Li2SO4 solution. (b, c) CP curves and lithium extraction capacity of LiFePO4 electrode with different areal densities. (d) The CP curves of first five cycles in recovery solution at the areal density of 10 mg/cm2 (inset: lithium capacity measured by CP and ICP in third cycle). (e) The CP curves of the 13th cycle (inset: lithium capacity in 13th cycle). (f) The lithium capacity and the corresponding capacity of first 13 cycles.

Figure 5 Potentiostatic electrochemical impedance spectroscopy. (a) In brine. (b) In recovery solution. (c) Equivalent circuit diagram.
Table 1. The concentration of Na+ and Li+ and mass ratio of Na+ and Li+ in the brine and recovery solution.
|
|
 下载: 导出CSV
Table 3. According to equivalent circuit, the fitted and tested values of lithiation/de-lithiation in brine and recovery solution, and the corresponding ohmic energy consumption.
|
|
下载: 导出CSV

 扫一扫看文章

扫一扫关注我们

