Scheme 1.
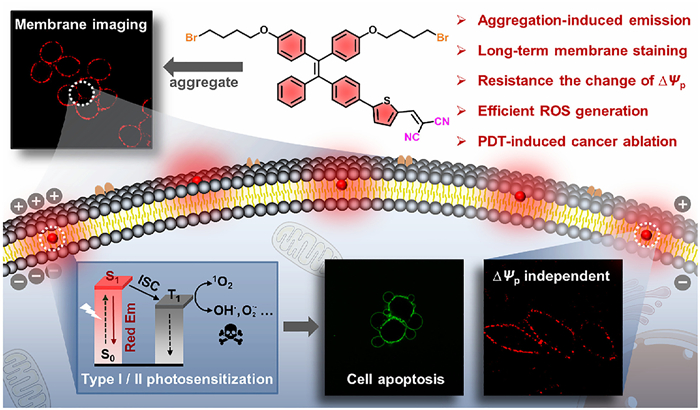
Illustration of chemical structure and bio-applications of desired AIEgen.
An AIE probe for long-term plasma membrane imaging and membrane-targeted photodynamic therapy
Hailing Zhao , Nan Li , Caixia Ma , Zhengwei Wei , Qiya Zeng , Keyi Zhang , Na Zhao , Ben Zhong Tang

Cell plasma membrane, the key barrier that protects cells from extracellular environment, plays indispensable roles in maintaining cellular homeostasis. Intact plasma membrane facilitates diverse important biological processes including immunologic response elicitation, signal transduction, inorganic ion trafficking, nutrient substances endocytosis and exocytosis [1, 2]. While ruptured plasma membrane usually considered as the hallmarks of cell necrosis and apoptosis [3]. Considering the crucial physiological and pathological roles of cell plasma membrane, tracing its long-term dynamics as well as regulating its integrity is of prior importance.
The development of advanced fluorescent probes greatly simplified the protocols of cell dynamic visualization without appreciably affecting cell viability [4, 5]. Meanwhile, compared to immunofluorescence assay [6] and covalent fluorescent labelling [7], small-molecule fluorescent probes are more conducive to real-time and in situ cell imaging with higher sensitivity [8-10]. Several novel fluorescent probes for cell plasma membrane have been reported in recent years, such as commercial membrane probes of DiI and its derivatives [11]. These carbocyanine based membrane probes generally rely on their lipophilic alkyl chains to insert into plasma membrane while use their hydrophilic groups to resist the internalization process. However, highly complex and ever-changing properties of plasma membrane make above amphiphilic probes readily penetrate the cell membrane and gradually diffuse within cytoplasm after a short period, resulting in the failure of long-term membrane dynamic tracking. In the meantime, annoying aggregation-caused quenching (ACQ) effect of these conventional membrane probes severely reduce their signal-to-noise ratio (SNR) and further limited their membrane imaging performance [12].
The emergence of the aggregation-induced emission luminogens (AIEgens) provides a brand-new molecular design concept to construct fluorescent probes that surpass the shortcomings arose from traditional ones [13]. Taking advantages of their "light-up" effect which originated from the restriction of intramolecular rotation, AIEgens present better imaging performance with higher SNR, wider concentration tolerance, and more superior photostability [14-16]. Recently, some AIEgens that favorable of labelling cell plasma membrane have been reported [17-23]. Additionally, benefiting from the enhanced reactive oxygen species (ROS) generation in the condensed state, some elegant AIE-active photosensitizers with regulating cell fate through membrane-targeted photodynamic therapy (PDT) have been developed [24-27]. Nevertheless, simple AIE probe that can realize long-term plasma membrane tracking and simultaneously present efficient membrane-targeted PDT is still rare.
In this report, two AIEgens (designated as TPTB and TPTH) with red emission were designed and synthesized by attaching dicyano vinyl-substituted thiophene group to the alkoxyl-branched tetraphenylethylene (TPE) moieties (Scheme 1). Benefiting from the excellent biocompatibility and suitable lipophilicity, TPTB could successfully embed in the cell plasma membrane and reside in the membrane for 4 h. Meanwhile, the electrically neutral feature enabled TPTB to resist the change of plasma membrane potential. By virtue of heavy atom effect, the TPTB that bearing Br atom presented higher ROS generation efficiency under white light irradiation, and could serve as an ideal probe to ablate cancer cells through membrane-mediated PDT process.
Both compounds were prepared according to the synthetic routes showing in Schemes S1 and S2 (Supporting information). They were fully characterized by NMR (Fig. S18–Fig. S31 in Supporting information), high resolution mass spectrometry, and single crystal X-ray diffraction to confirm the correct of their structures. The photophysical properties of synthesized compounds were studied initially. As shown in Fig. 1A, both compounds gave the longest absorption bands at 450 nm in pure DMSO solution with high molar absorptivity of ca. 2.3 × 10⁴ L mol−1 cm−1, which could be reasonably ascribed to the intramolecular charge transfer transition [28]. To evaluate the AIE properties, the photoluminescence of two compounds in DMSO/water mixtures with different water volumetric fraction (fw) was measured. Taking TPTB as an example, when it was dissolved in DMSO solution, faint emission was collected with fluorescence quantum yield (ØF) of 0.01 and fluorescence lifetime (τavg) of 1.14 ns. Increasing the fw, however, the emission at 625 nm gradually increased, and the emission intensity reached to the maximum at fw of 70% with 94-fold intensity enhancement (Figs. 1B and C). 73-fold emission increment still achieved with ØF of 0.18 and τavg of 3.03 ns at fw of 99% (Fig. S2, Table S1 in Supporting information). Similar fluorescent light-up phenomenon along with increasing of fw was observed for TPTH (Fig. S1 and Fig. S2, Table S1 in Supporting information). The particle size distribution of two compounds at fw 99% were measured to be 51 nm (TPTB) and 104 nm (TPTH), confirming the existence of nanoaggregates (Fig. S3 in Supporting information). Above results demonstrated both compounds are typical AIEgens. Notably, benefiting to the AIE features, the solid-state emission intensity of both AIEgens significantly boosted (ØF of 0.38 for TPTB and 0.29 for TPTH) compared to their solution state (Fig. S4, Table S1 in Supporting information).
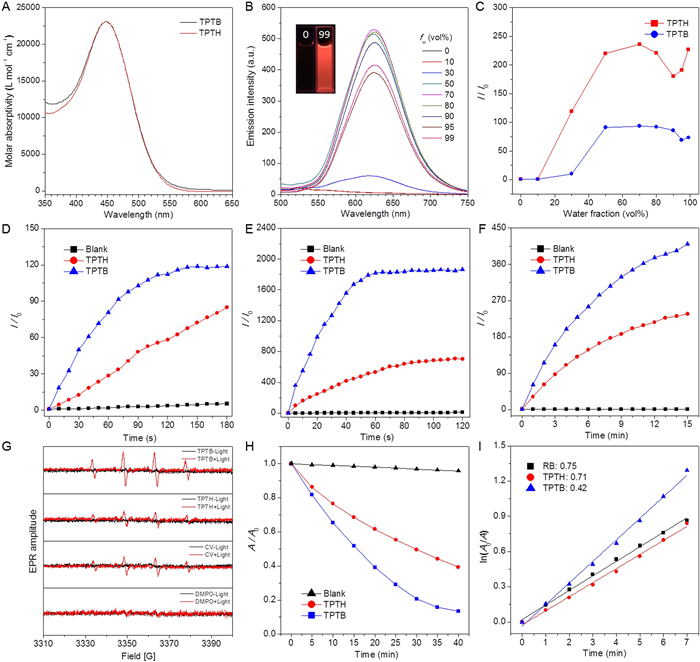
The commercial probe of 2′, 7′-dichlorodihydrofluorescein diacetate (DCF-DA) was employed to assess the ROS generation of AIEgens under white LED light irradiation (400−700 nm, 50 mW/cm2). As shown in Fig. 1D and Fig. S5 (Supporting information), upon exposing the solution containing AIEgens and DCF-DA to the white light, the emission intensity at 525 nm rapidly increased with increasing of irradiation time, giving 120 (TPTB) and 85-fold (TPTH) enhancement after 180 s, which indicated the efficient generation of ROS by both AIEgens. To prove the specific type of generated ROS, different commercial probes, such as dihydrorhodamine 123 (DHR123, O2•− probe), hydroxyphenyl fluorescein (HPF, •OH probe), and 9,10-anthracenediyl-bis(methylene) dimalonic acid (ABDA, 1O2 probe) were introduced [29, 30]. When mixture of AIEgens and DHR123 were irradiated under white light for 120 s, dramatically boosted emission intensities at 530 nm were observed, giving 1860 and 700-fold enhancement for TPTB and TPTH (Fig. 1E and Fig. S6 in Supporting information). Similarly, both AIEgens induced the emission enhancement of HPF (520 nm) with 410 and 237-fold after white light irradiation for 15 min (Fig. 1F and Fig. S7 in Supporting information). The existence of •OH was further validated by electron paramagnetic resonance (EPR) spectroscopy using 5,5-dimethyl-1-pyrroline-N-oxide (DMPO) as a radical trapping agent. The EPR intensity ratio of 1:2:2:1 induced by AIEgens was in good agreement with the literature (Fig. 1G) [31]. Above results distinctly revealed that AIEgens could produce •OH and O2•− radicals through the pathway of electron transfer. Additionally, when irradiating the mixture of ABDA and AIEgens with white light for 40 min, the absorption peak at 378 nm decreased about 87% and 60% for TPTB and TPTH, respectively, revealing AIEgens could also generate 1O2 through the pathway of energy transfer (Fig. 1H and Fig. S8 in Supporting information). The quantum yields of 1O2 were further measured to be 0.71 and 0.42 for TPTB and TPTH, respectively (Fig. 1I). Apparently, the ROS generation ability of TPTB is better than TPTH, which could be attributed to more efficient intersystem crossing of TPTB induced by the heavy atom of Br.
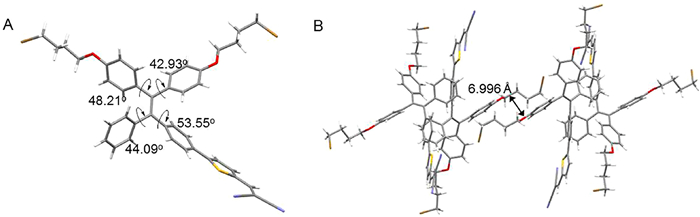
The single crystals of AIEgens were successfully obtained and fully characterized by X-ray diffraction (Table S2 in Supporting information). Taking TPTB as an example, it exhibited non-planer conformation due to the existence of TPE unit. The torsion angles between central vinyl and benzene rings ranged from 42.93o to 53.55o (Fig. 2A). The distance between adjacent molecules was measured to be 6.996 Å (Fig. 2B), which exceeded the standard π−π stacking interaction. Meanwhile, multiple C–H…π (2.704 and 2.719 Å) interactions within crystal lattices were observed (Fig. S9 in Supporting information). The distorted conformation, multiple C–H…π interactions as well as the lack of π−π stacking helped the excited molecules to avoid non-radiative decay and displayed enhanced emission in the aggregated state. Similar molecular conformation and packing mode were obtained for TPTH (Fig. S10 and Fig. S11 in Supporting information).
Based on the excellent optical properies of AIEgens, their cell imaging applications were next carried out using confocal laser scanning microscopy (CLSM). As shown in Fig. S12 (Supporting information), intense red fluorescent signals from cell plasma membrane were observed after incubating HeLa cells with both AIEgens (10 µmol/L) for 60 min. To further confirm their exact cellular locations, co-localization experiments using commercial membrane probe of DiD were conducted. As shown in Fig. 3A and Fig. S13 (Supporting information), both AIEgens overlapped well with DiD, giving Pearson's correlation coefficients of 0.90 and 0.80 for TPTB and TPTH, respectively. Further co-localization between TPTB and other organelle trackers, such as Hoechst 33342 (nucleus probe), MitoTracker Green (MTG, mitochondria probe), and LysoTracker Green (LTG, lysosome probe), were performed. Based on the CLSM images, TPTB presented little co-localizations with other organelle trackers while the corresponding Pearson's correlation coefficients were lower than 0.08. Beside HeLa cells, the imaging performance of TPTB towards other cell lines was also evaluated. As shown in Fig. S14A (Supporting information), the plasma membrane of MCF-7 and U87-MG cells could also be successfully stained by TPTB. Benefiting from the special AIE feature, TPTB stained the plasma membrane even without washing, favoring the in-situ tracking of membrane morphology change (Fig. S14B in Supporting information).
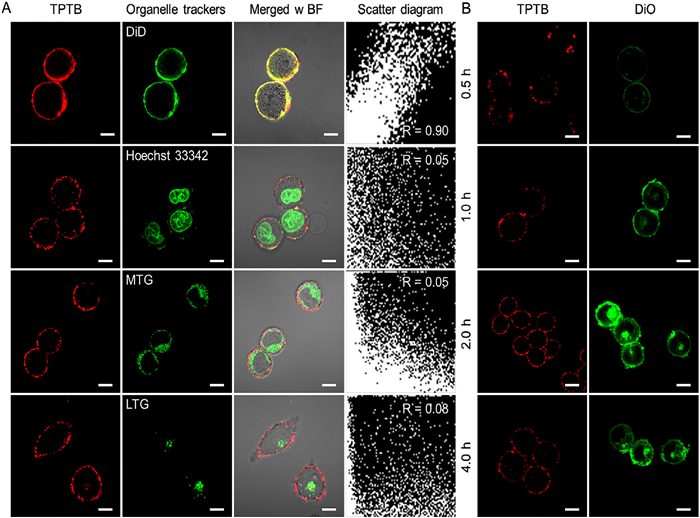
Long-term imaging the plasma membrane dynamics provides facile strategy to understand the physiological changes during cell signal transduction, cell division, adhesion and extension. Considering better membrane staining performance of TPTB, we next assessed its membrane retention abilities. As shown in Fig. 3B, the red fluorescent signals of TPTB form cell membrane emerged after staining for 0.5 h. The red fluorescent signals from membrane contour became more distinct when the incubation time extended to 1 h. Notably, the fluorescent signals from cell membrane maintained even the incubation time prolonged to 4 h. On the contrary, both DiO and DiD easily internalized into cytoplasm after 2 h (Fig. S15 in Supporting information). The imaging results revealed TPTB could act as a reliable membrane tracker for specific and long-term plasma membrane imaging. Additionaly, almost none signal loss was observed for TPTB after 150 s of continuous laser scans, suggesting its excellent photobleaching resistance (Fig. S16 in Supporting information).
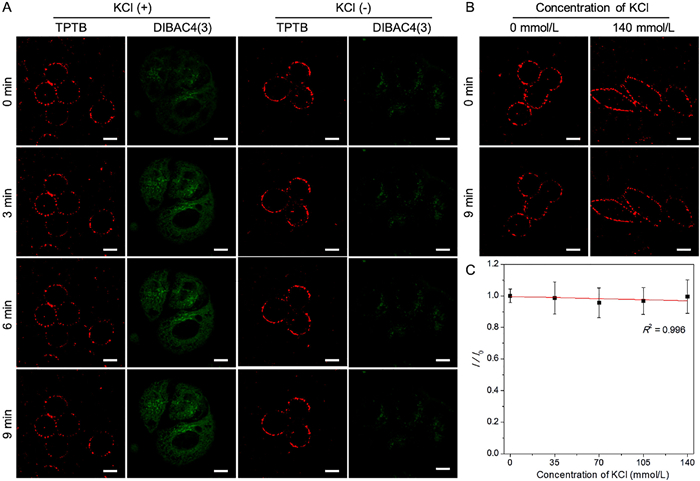
Cell plasma membrane potential (ΔΨPlasma), the voltage difference across the living cell membrane, plays indispensable roles in facilitating transmembrane ion transportation [32]. However, the ΔΨPlasma decreases during membrane depolarization, which usually makes the cationic membrane probes losing their membrane anchoring capabilities. To assess whether the desired lipophilic TPTB could resist the ΔΨPlasma changes, commercial ΔΨPlasma indicator of DiBAC4(3) was employed. As shown in Fig. 4A, when HeLa cells were depolarized by KCl solution (100 mmol/L), the red fluorescent intensity of TPTB almost unchanged whereas the green fluorescent intensity of DiBAC4(3) gradually increased after the incubation time prolonging to 9 min. Importantly, increasing the concentration of KCl from 0 to 140 mmol/L, negligible fluorescent intensity changes of TPTB were obtained (Figs. 4B and C, Fig. S17 in Supporting information), implying TPTB could be a promising ΔΨPlasma-independent membrane probe. The lipophilic nature of TPTB should be responsible for its excellent resistance towards the ΔΨPlasma.
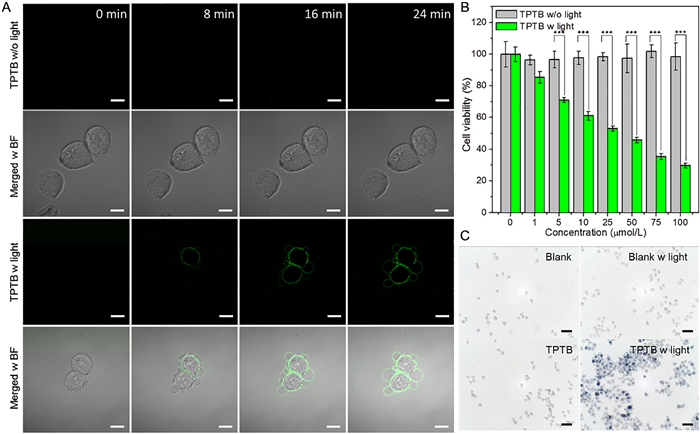
Passive disruption the plasma membrane integrity by harmful species from external environments usually results the cell death. Considering the long-term membrane anchoring and efficient ROS generation abilities of TPTB, we speculated it could rupture the plasma membrane through PDT process to induce cell death. As shown in Fig. 5A, the TPTB pre-stained HeLa cells were irradiated with white light for 30 min and then stained with Annexin V-FITC, the green fluorescent signals of Annexin V-FITC from cell membrane appeared at 8 min and became brighter with incubation time prolonged to 24 min. On contrary, silenced fluorescent signals were observed in the absence of light irradiation. Above results demonstrated TPTB could induce cell apoptosis under white light irradiation. The phototoxicity of TPTB was next evaluated by 3-(4,5-dimethyl-2-thiazolyl)-2,5-diphenyltetrazolium bromide (MTT) assay. As shown in Fig. 5B, a significant dose-dependent cytotoxicity was achieved after treating HeLa cells with both TPTB and white light irradiation, and the cell viability dropped to 33.27% ± 1.24% when concentration of TPTB was increased to 100 µmol/L. However, negligible cytotoxicity was observed and the cell viability still maintained at 93.47% ± 8.25% in the presence of TPTB alone (100 µmol/L). The phototoxicity of TPTB was further assessed by trypan blue staining method. As displayed in Fig. 5C, lots of blue nuclei from HeLa cells were obtained when the cells treated with TPTB (10 µmol/L) and white light, revealing TPTB could ablate the cancer cells through membrane-targeted PDT process.
In conclusion, two TPE-based AIEgens (TPTB and TPTH) were developed. The AIEgens efficiently generate ROS through both energy and electron transfer pathways. Due to the heavy atom effect of Br, TPTB exhibited higher ROS generation efficiency. Thanks to the proper lipophilicity, TPTB could image the cell plasma membrane with high specificity and long-term retention ability. Importantly, the proper lipophilicity of TPTB enabled it to resist the change of ΔΨPlasma. Efficient ROS generation of TPTB made it to ablate the cancer cells through membrane-targeted PDT effect. This study will provide a powerful molecular tool to explore the mechanisms of membrane-associated cellular homeostasis.
The authors declare that they have no known competing financial interests or personal relationships that could have appeared to influence the work reported in this paper.
We appreciate for financial support from National Natural Science Foundation of China (Nos. 22077077, 21975149, 21672135), and the Funded Projects for the Academic Leaders and Academic Backbones, Shaanxi Normal University (No. 18QNGG007).
Supplementary material associated with this article can be found, in the online version, at doi:
M.S. Bretscher, M.C. Raff, Nature 258 (1975) 43−49. doi: 10.1038/258043a0
H.E. Grecco, M. Schmick, P.I.H. Bastiaens, Cell 144 (2011) 897−907. doi: 10.1016/j.cell.2011.01.029
Y. Zhang, X. Chen, C. Gueydan, J. Han, Cell Res. 28 (2018) 9−21. doi: 10.1038/cr.2017.133
H. Zhu, J. Fan, J. Du, X. Peng, Acc. Chem. Res. 49 (2016) 2115−2126. doi: 10.1021/acs.accounts.6b00292
P. Gao, W. Pan, N. Li, B. Tang, Chem. Sci. 10 (2019) 6035−6071. doi: 10.1039/c9sc01652j
W.C.C. Tan, S.N. Nerurkar, H.Y. Cai, et al., Cancer Commun. 40 (2020) 135−153. doi: 10.1002/cac2.12023
Y. Zhang, K. Park, K. Suazo, M.D. Distefano, Chem. Soc. Rev. 47 (2018) 9106−9136. doi: 10.1039/c8cs00537k
L. Wang, M.S. Frei, A. Salim, K. Johnsson, J. Am. Chem. Soc. 141 (2019) 2770−2781. doi: 10.1021/jacs.8b11134
H.R. Jia, Y.X. Zhu, Q.Y. Duan, F.G. Wu, Chem. Soc. Rev. 50 (2021) 6240−6277. doi: 10.1039/d1cs00067e
K. Li, Y. Lyu, Y. Huang, et al., Proc. Natl. Acad. Sci. USA 118 (2021) e201803318.
M.G. Honig, R.I. Hume, Trends Neurosci. 12 (1989) 333−341. doi: 10.1016/0166-2236(89)90040-4
J. Mei, Y. Hong, J.W.Y. Lam, et al., Adv. Mater. 26 (2014) 5429−5479. doi: 10.1002/adma.201401356
J. Mei, N.L.C. Leung, R.T.K. Kwok, J.W.Y. Lam, B.Z. Tang, Chem. Rev. 115 (2015) 11718−11940. doi: 10.1021/acs.chemrev.5b00263
J. Liang, B.Z. Tang, B. Liu, Chem. Soc. Rev. 44 (2015) 2798−2811. doi: 10.1039/C4CS00444B
C.W.T. Leung, Y. Hong, S. Chen, et al., J. Am. Chem. Soc. 135 (2013) 62–65. doi: 10.1021/ja310324q
Y. Cui, R. Zhang, L. Yang, S. Lv, Chin. Chem. Lett. 30 (2019) 1078−1082. doi: 10.1016/j.cclet.2018.10.017
Y. Li, Y. Wu, J. Chang, et al., Chem. Commun. 49 (2013) 11335−11337. doi: 10.1039/c3cc46991c
G. Liu, D. Chen, L. Kong, et al., Chem. Commun. 51 (2015) 8555−8558. doi: 10.1039/C5CC02054A
W. Zhang, C.Y.Y. Yu, R.T.K. Kwok, J.W.Y. Lam, B.Z. Tang, J. Mater. Chem. B 6 (2018) 1501−1507. doi: 10.1039/c7tb02947k
Y. Zhang, Y. Yan, S. Xia, et al., ACS Appl. Mater. Interfaces 12 (2020) 20172–20179. doi: 10.1021/acsami.0c00903
L. Shi, Y. Liu, K. Li, et al., Angew. Chem. Int. Ed. 59 (2020) 9962−9966. doi: 10.1002/anie.201909498
J. Yang, J.J. Hu, J. Wei, et al. CCS Chem. 4 (2022) 464−475. doi: 10.31635/ccschem.021.202101349
S.M. Sayed, H. Jia, Y. Jiang, et al., J. Mater. Chem. B 9 (2021) 4303−4308. doi: 10.1039/d1tb00049g
W. Zhang, Y. Huang, Y. Chen, et al., ACS Appl. Mater. Interfaces 11 (2019) 10567–10577. doi: 10.1021/acsami.9b00643
Z. Long, J. Hu, L. Yuan, et al., Nano Today 41 (2021) 101312. doi: 10.1016/j.nantod.2021.101312
M. Wu, M. Gu, J. Leung, et al., Small 17 (2021) 2101770. doi: 10.1002/smll.202101770
M. Wu, X.G. Liu, H. Chen, et al., Angew. Chem. Int. Ed. 60 (2021) 9093−9098. doi: 10.1002/anie.202016399
J.N. Zhang, H. Kang, N. Li, et al., Chem. Sci. 8 (2017) 577−582. doi: 10.1039/C6SC02875F
Z. Zhuang, J. Dai, M. Yu, et al., Chem. Sci. 11 (2020) 3405−3417. doi: 10.1039/d0sc00785d
X. Hou, F. Yi, X.L. Han, et al., Chem. Eng. J. 432 (2022) 134327. doi: 10.1016/j.cej.2021.134327
F.A. Villamena, E.J. Locigno, A. Rockenbauer, C.M. Hadad, J.L. Zweier, J. Phys. Chem. A 110 (2006) 13253−13258. doi: 10.1021/jp064892m
H.J. Apell, Curr. Opin. Cell Biol. 2 (1990) 708−713. doi: 10.1016/0955-0674(90)90114-T

Figure 1 (A) Absorption spectra of AIEgens (10 µmol/L) in DMSO solution. (B) The emission spectra of TPTB in DMSO/water mixtures with different fw. (C) Plots of I/I0 of AIEgens versus fw. I0 represents the emission intensity in DMSO, I represents the emission intensity at different fw. (D−F) Plots of I/I0 in the presence of AIEgens versus irradiation times. I0 and I in (D), (E), and (F) are the emission intensity of DCF-DA at 525 nm, DHR123 at 530 nm, and HPF at 520 nm before and after white light irradiation (400−700 nm, 50 mW/cm2), respectively. (G) EPR spectra of AIEgens, CV, and DMPO with or without white light irradiation (400−700 nm, 50 mW/cm2, 5 min). (H) Plots of A/A0 in the presence of AIEgens versus irradiation times. A0 and A are the absorbance of ABDA at 378 nm before and after white light irradiation (400−700 nm, 50 mW/cm2). (I) The decomposition rate constants of AIEgens and Rose Bengal (RB).

Figure 3 (A) CLSM images of HeLa cells co-stained with TPTB (10 µmol/L) and different organelle trackers. (B) The long-term images of HeLa cells treated with TPTB or DiO. Scale bar: 10 µm.

Figure 4 (A) Time-dependent CLSM images of TPTB (10 µmol/L) or DIBAC4(3) (5 µmol/L) stained HeLa cells after treating with (or without) KCl solution (100 mmol/L). (B) CLSM images of TPTB (10 µmol/L) stained HeLa cells after treating with various concentrations of KCl solution for 0 and 9 min. (C) Plot of I/I0 of TPTB versus the concentrations of KCl. I0 and I represent the intensity of TPTB at 0 and 9 min, respectively. Scale bar: 10 µm.

Figure 5 (A) Real-time cell apoptosis tracking after TPTB prestained-HeLa cells were exposed to white light (400−700 nm, 50 mW/cm2, 30 min). (B) Cell viability of HeLa cells treated with TPTB in the presence or absence of white light irradiation (400−700 nm, 50 mW/cm2, 30 min). Mean ± SD (n = 5). *** P < 0.001. (C) Trypan blue staining assay for HeLa cells treated with or without TPTB in the presence or absence of white light irradiation (400−700 nm, 50 mW/cm2, 30 min). Scale bars in (A) and (C) are 10 and 50 µm, respectively.

 扫一扫看文章

扫一扫关注我们
 DownLoad:

 下载:
下载:
