Citation:
Shuai Xie, Hongchang Jin, Chao Wang, Huanyu Xie, Ying-Rui Lu, Ting-Shan Chan, Wensheng Yan, Song Jin, Hengxing Ji. A comparison study on single metal atoms (Fe, Co, Ni) within nitrogen-doped graphene for oxygen electrocatalysis and rechargeable Zn-air batteries[J]. Chinese Chemical Letters,
2023, 34(6): 107681.
doi:
10.1016/j.cclet.2022.07.024
A comparison study on single metal atoms (Fe, Co, Ni) within nitrogen-doped graphene for oxygen electrocatalysis and rechargeable Zn-air batteries
English
A comparison study on single metal atoms (Fe, Co, Ni) within nitrogen-doped graphene for oxygen electrocatalysis and rechargeable Zn-air batteries
School of Chemistry and Material Sciences, CAS Key Laboratory of Materials for Energy Conversion, University of Science and Technology of China, Hefei 230026, China
b.
National Synchrotron Radiation Laboratory, University of Science and Technology of China, Hefei 230026, China
c.
National Synchrotron Radiation Research Center, 300 Hsinchu, Taiwan, China
Received Date:
07 April 2022 Accepted Date:
12 July 2022 Revised Date:
05 May 2022 Available Online:
15 June 2023
Abstract:
Single atom catalysts (SACs) with atomically dispersed transition metals on nitrogen-doped carbon supports have recently emerged as highly active non-noble metal electrocatalysts for oxygen reduction reaction (ORR) and oxygen evolution reaction (OER), showing great application potential in Zn-air batteries. However, because of the complex structure-performance relationships of carbon-based SACs in the oxygen electrocatalytic reactions, the contribution of different metal atoms to the catalytic activity of SACs in Zn-air batteries still remains ambiguous. In this study, SACs with atomically dispersed transition metals on nitrogen-doped graphene sheets (M-N@Gs, M = Co, Fe and Ni), featured with similar physicochemical properties and M-N@C configurations, are obtained. By comparing the on-set potentials and the maximum current, we observed that the ORR activity is in the order of Co-N@G > Fe-N@G > Ni-N@G, while the OER activity is in the order of Co-N@G > Ni-N@G > Fe-N@G. The Zn-air batteries with Co-N@G as the air cathode catalysts outperform those with the Fe-N@G and Ni-N@G. This is due to the accelerated charge transfer between Co-N@C active sites and the oxygen-containing reactants. This study could improve our understanding of the design of more efficient bifunctional electrocatalysts for Zn-air batteries at the atomic level.
Rechargeable metal-air batteries have been becoming a promising candidate for the next-generation high energy density energy storage device [1-6]. Among them, Zn-air batteries have attracted much attention because of the potential of low cost and high safety [7-11]. The electrochemical performance of the Zn-air batteries is highly dependent on the electrocatalytic activity of the air cathode resembled from bifunctional catalysts for both the oxygen reduction reaction (ORR) and the oxygen evolution reaction (OER) in the discharge and charge processes, respectively [12,13]. Noble metal based electrocatalysts have been well studied in academia owing to their excellent electrocatalytic activities and durability but the high price limits the commercial application of Zn-air batteries [14-16]. An attractive alternative among the bifunctional catalysts is the transition metal and nitrogen co-doped carbon (M-N@C) material that is electrically conductive, chemically robust, and low cost with high metal atom-utilization efficiency [17,18].
A variety of transition metals have been applied to coordinate with nitrogen atoms and embedded in the carbon matrix to form the M-N@C active sites, such as the Mn-N-C [19], Fe-N-C [20], Co-N-C [21], Ni-N-C [22] and Cu-N-C [23], which presented excellent electrochemical performance regarding the on-set potential, exchange current density, reaction pathway selectivity, and cycling durability. Previous researches indicate that the ORR and OER activities are closely related to the electronic structure of the active sites. The energy level of a metal atom's d-band center succeeded in serving as the activity descriptor for metal surface [24]. The intrinsic OER activity exhibits a volcano-dependence on the occupancy of the 3d electron with an eg symmetry of surface transition metal cations of the perovskite oxides [25]. And the difference between the lowest valence orbital energy of the active center and the highest valence orbital energy of the graphene substrate has been introduced as the activity descriptor for metal-free catalysts [26]. The type of the metal element should play an important role in the electrochemical catalytic activity of the M-N@C for both the ORR and OER, but the effect of the metal atoms on the electrochemical catalytic activities are still elusive because those multiple parameters of the catalyst affect the electrocatalytic performance, thus the comparative studies are still challenging. The parameters of the M-N@C materials that are critical to the electrocatalytic activities includes the atom ratio of the metal atoms, the bonding configuration of the metal and nitrogen atoms in the carbon matrix, the graphitization level of the carbon matrix, and the electrical conductivity and specific area of the composite.
It is known that the catalytic activity for a carbon-based single atom catalyst is governed by both the activity of monodispersed active sites and the structure of carbon supports. The catalytic efficiency is directly affected by the number of single metal sites within the carbon supports. Besides, the intrinsic catalytic activities of M-N@C catalysts originate from the whole M-N@C actives moieties, the M-N@C catalysts with different local configuration of M-N@C actives sites are likely to display obvious differences in their catalytic performances [27]. In addition, the structure of carbon supports is also a key factor that determines the catalytic performance of M-N@C catalysts. During the oxygen electrocatalytic reactions, high specific area carbon supports with a hierarchical pore structure are more favorable for the transportation of oxygen and electrolyte. Furthermore, since the electrical conductivity of carbon materials is proportional to its graphitization degree, carbon supports with high graphitization degree are able to accelerate the internal electron transfer of the catalysts. With an optimized structure of carbon supports, greater exposure of M-N@C active sites to the electrolyte, oxygen and electron and an improved utilization efficiency of active sites can be achieved. Considering the complex relationship between the catalytic performances and the structural features of M-N@C catalysts, it is difficult to distinguish the contribution of different metal atoms to the oxygen electrocatalytic activities.
Herein, we prepared three types of transition metal atoms (Fe, Co and Ni) co-doped with nitrogen atoms in graphene sheets with identical physicochemical characters, containing well-defined M-N@C coordination center. The dopants concentration and the physical properties of the materials are controlled for the comparative studies to understand the effect of metal atom dopants on the ORR/OER catalytic activities and the Zn-air battery performances. The ORR catalytic activity was observed in the order of Co-N@G > Fe-N@G > Ni-N@G, while the OER catalytic activity was in the order of Co-N@G > Ni-N@G > Fe-N@G. The rechargeable Zn-air batteries with Co-N@G as catalyst delivered a small charge-discharge voltage gap and high stability, which is attributed to the fast charge transfer between Co-N@C sites and the oxygen-containing species, as evidenced by the electrochemical impendence spectroscopy (EIS). These findings will provide a guideline to develop more efficient and durable bifunctional electrocatalysts in Zn-air batteries.
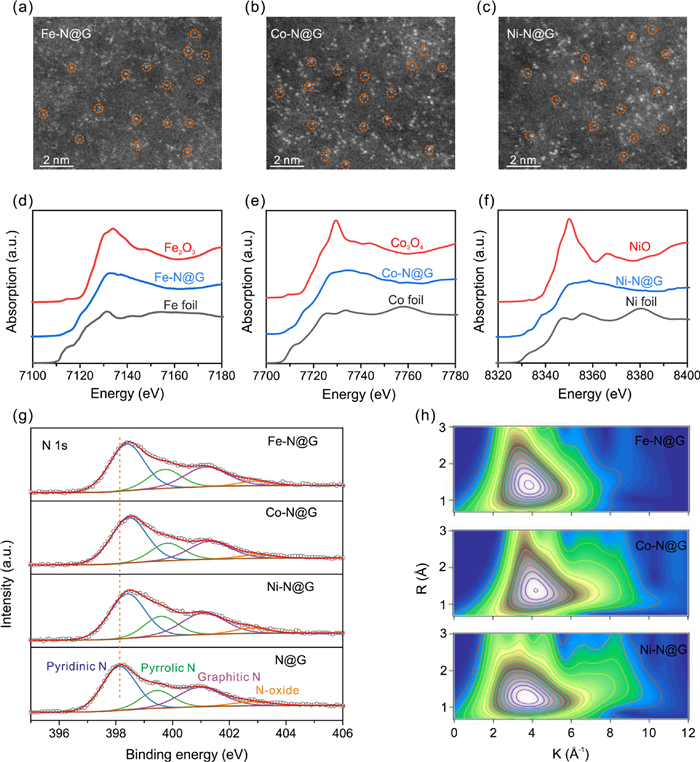
The M-N@Gs were prepared through the direct thermal treatment of a mixture of graphene oxide (GO) and metal precursors in an NH3 atmosphere (see Experimental Section). The scanning electron microscopy (SEM) and transmission electron microscopy (TEM) images (Figs. S1 and S2 in Supporting information) of the M-N@Gs show typical sheet-like structures without nanoparticles on the graphene sheets. But bright dots with size of 2–3 Å representing heavy metal atoms (Figs. 1a-c) are observed on the graphene sheets using high-angle annular dark-field scanning transmission electron microscope (HAADF-STEM). The corresponding energy dispersive spectroscopy (EDS) mappings presented a uniform distribution of C, N and metal elements over the entire graphene sheet (Fig. S2).
Figure 1
Figure 1.
Structure characterizations of M-N@Gs. (a–c) HAADF-STEM images of Co-N@G, Fe-N@G and Ni-N@G. (d–f) The experimental K-edge XANES spectra of M-N@Gs with their reference samples (metal foil and metal oxide). (g) High resolution N 1 s XPS spectra of M-N@Gs and N@G. (h) Wavelet transforms for the k2-weighted EXAFS signal of M-N@Gs.
Meanwhile, all M–N@Gs exhibit the typical Raman spectra with obvious D (1359 cm−1) and G (1588 cm−1) bands (Fig. S3 in Supporting information), revealing the intrinsic feature of defective graphene sheets [28]. And the N2 adsorption–desorption isotherms (Fig. S4 in Supporting information) further revealed that all the M-N@Gs samples exhibit a typical type-Ⅳ isotherm, a close specific surface area (SSA), and a similar mesoporous structure [29]. X-ray photoelectron spectroscopy (XPS) analysis, together with inductively coupled plasma-atomic emission spectroscopy (ICP-AES), provided the atom concentrations of dopants in the M-N@Gs samples, indicating that the atom concentrations of metal and nitrogen are very close in the three different types of samples. And the high-resolution C 1 s spectra of M-N@Gs presented that they have the same sp3/sp2 hybridization ratio, demonstrating their equally high graphitization level (Fig. S6 in Supporting information), which renders a high electrical conductivity of 2.2 × 10² S/m, 2.4 × 10² S/m and 2.0 × 10² S/m for Fe-N@G, Co-N@G and Ni-N@G, respectively (Fig. S7 in Supporting information). The information of the porous structure and chemical composition of the M-N@Gs are summarized in Table 1.
Table 1
Table 1.
Structure features and chemical composition of M-N@Gs.
In addition, high resolution XPS spectra of Fe 2p, Co 2p and Ni 2p (Figs. S8a-c in Supporting information), with no peaks assigned to zero-valent metals founded, indicated that all the metals in M-N@Gs were positively charged. The binding energy of Fe 2p3/2 located between Fe2+ (709.6 eV) and Fe3+ (711.4 eV), suggesting the co-existence of Fe2+ and Fe3+ [30]. The Co 2p exhibited two main peaks at 780.3 eV and 796.0 eV, assigned to Co 2p3/2 and Co 2p1/2 respectively. The peak separation of 15.7 eV between the two peaks indicated the presence of both Co2+ and Co3+ [31]. And the binding energy of Ni 2p3/2 were 854.5 eV, lower than that of Ni2+ (856.0 eV), implying its low-valent state. N 1s spectra of the as-prepared samples were analyzed in Fig. 1g. N 1s of nitrogen-doped graphene (N@G) can be divided into several characteristic peaks at 398.0 eV, 399.4 eV, 401.1 eV and 402.8 eV, corresponding to pyridinic N, pyrrolic N, graphitic N and N-oxide, respectively [32]. In comparison, the peaks assigned to pyridinic N in M-N@Gs all shift towards higher binding energy, which is attributed to the electron transfer from pyridinic N to the doped metal single atoms, implying the strong coordination between metal atoms and pyridinic N [33,34]. The X-ray absorption near edge structure (XANES) profiles of M-N@Gs (Figs. 1d-f) show distinguished differences from those of their reference samples. The absorption edge position of M-N@Gs is located between that of their metal foil and oxide references, suggesting that those single atoms are in intermediate oxidation states, in agreement with the above XPS analysis. It is noteworthy that the XANES profiles of all M-N@Gs are nearly the same, strongly suggesting their similar local coordination environment around the metal centers. And a weak pre-edge shoulder peak emerged at approximately 7115, 7715 and 8338 eV for Fe-N@G, Co-N@G and Ni-N@G, respectively, which implied that the metal centers in M-N@Gs (M = Co, Fe and Ni) were confined to distortional porphyrin-like M-N4 planar structure [35-37]. In order to determine the coordination environment of the metals in the M-N@Gs, we performed the extended X-ray absorption fine structure (EXAFS) analysis on the composites. The Fourier transform analyses of EXAFS (FT-EXAFS, Fig. S12a in Supporting information) presents major peaks that can be assigned to the Fe-N (1.45 Å), Co-N (1.40 Å), and Ni-N (1.41 Å) bonds in the Fe-N@G, Co-N@G, and Ni-N@G, respectively, while the peaks associated with the M-M and M-O bonds are only observed in the metal and metal oxides that served as control samples. Wavelet transform (WT) analysis were carried out on the EXAFS data to further demonstrate the atomic dispersion of metal atoms. The WT contour plots of the M-N@Gs (Fig. 1h), presents only one intensity maximum at approximately 4.0 Å–1 that can be assigned to M-N coordination, which are quite different from those of their metal foil and oxide references (Figs. S9-S11 in Supporting information). These analyses suggest that the metal atoms are coordinated with nitrogen atoms and embedded in the graphene lattice. The formation of metal cluster or metal oxides are not detected (Fig. S12a). Quantitative EXAFS fitting (Fig. S11b and Table S1 in Supporting information) demonstrates that the metal atoms are coordinated with four N atoms, proving the existence of M-N4 moieties within the graphene sheets. To sum up, the three types of single atom catalysts with identical atomic-scaled M-N4@C species uniformly dispersed on graphene were successfully synthesized.
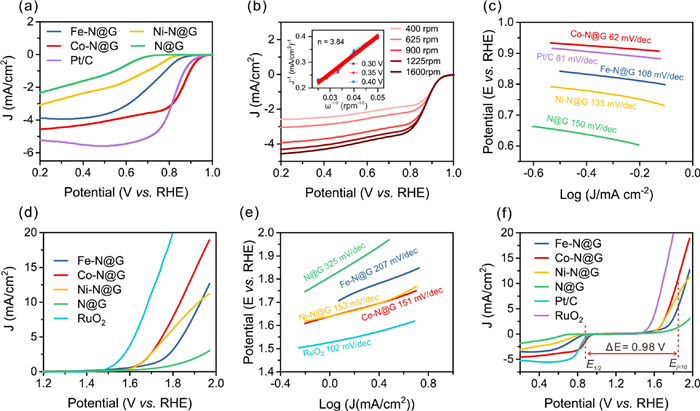
The ORR/OER activities of the prepared samples were evaluated on a rotating disk electrode (RDE) in O2-saturated 0.1 mol/L KOH solution. The contact angle measurements indicated a similar hydrophobic surface of M-N@Gs in 0.1 mol/L KOH solution (Fig. S13 in Supporting information), which generates a favorable triple-phase boundary region of oxygen, electrolyte and electrode for oxygen electrocatalysis reactions. We then investigated the electrocatalytic ORR activities of M-N@Gs by linear sweep voltammetry (LSV) measurements (Fig. 2a). It reveals the most positive onset potential (0.96 V) and half-wave potential (0.85 V) for Co-N@G, which are even superior to Pt/C (onset potential of 0.95 V and half-wave potential of 0.82 V), followed by Fe-N@G, Ni-N@G and N@G. The comparison results imply the ORR occurs more easily catalyzed by Co-N@G. To gain information on electron transfer route during ORR process, LSV curves at different rotating speed are explored and the accordingly Koutecky–Levich (K–L) plots (Fig. 2b) show that the value of electron transfer number for Co-N@G is 3.84, indicating a four-electron pathway for ORR, while the electron transfer number (n) for Fe-N@G, Ni-N@G and N@G is 2.61, 2.38 and 1.69, respectively (Fig. S14 in Supporting information), suggesting their rather poor ORR selectivity towards hydroxide ions. In addition, we calculated the exchange current density (J0) for different electrocatalysts. Despite the fact that Pt/C exhibits the highest value of J0 (Fig. S15 in Supporting information), the J0 of Co-N@G was calculated to be 9.5 × 10⁻⁶ mA/cm2, higher than that of Fe-N@G (8.5 × 10⁻⁶ mA/cm2), Ni-N@G (3.2 × 10⁻⁶ mA/cm2) and N@G (1.6 × 10⁻⁶ mA/cm2), proving the higher intrinsic catalytic activity of Co-N@G. It should be noted that the calculated value of J0 for N@G is very close to the reported one under similar experimental conditions, indicating the reliability of our calculation results [26]. The Tafel slope (Fig. 2c) for Co-N@G is 65 mV/dec, which is superior to that of Pt/C (81 mV/dec), much lower than Fe-N@G (85 mV/dec), Ni-N@G (87 mV/dec) and N@G (110 mV/dec). The above results reveal that Co-N@G possesses more excellent ORR activity with faster reaction kinetics. The OER catalytic activities of the as-prepared samples were presented in Fig. 2d. Compared to the corresponding state-of-the-art catalyst RuO2, M-N@Gs exhibit inferior electrocatalytic activities, which might be ascribed to their relatively low specific area and limited amounts of active sites. Nonetheless, among M-N@Gs, Co-N@G exhibits a much lower onset potential and higher catalytic current. And the smallest Tafel slopes of the Co-N@G (151 mV/dec) in contrast to other samples (Ni-N@G: 153 mV/dec; Fe-N@G: 207 mV/dec; N@G: 325 mV/dec) demonstrates its best kinetic process for OER (Fig. 2e). The above results indicate that metal-free N@G presents a much lower electrocatalytic activity than that of the M-N@Gs. Considering the very close content of different nitrone types in M-N@Gs and N@G (Table S1), we infer that it is the single metal sites that plays a predominant role in the electrocatalytic conversion of oxygen species. Besides, the electrochemical active surface area (ECSA) was determined by calculating the double layer capacitance (Cdl) based on the CV curves at different scan rates (Fig. S16 in Supporting information). The M-N@G catalysts owns similar electrochemical surface areas (Fe-N@G: 1.04 mF/cm2; Co-N@G: 1.10 mF/cm2; Ni-N@G: 0.91 mF/cm2), while the metal-free N@G has a much smaller Cdl of 0.09 mF/cm2, which emphasized the important roles of metals in the interaction with hydroxide ions and confirmed that the catalytic activities of M-N@Gs mainly stem from the discrete M-N@C sites within graphene sheets. To evaluate the intrinsic activities of every M-N-C active site, we estimated the turn over frequency (TOF) at a specific potential. At 1.8 V during the OER process, Co-N@G owns a largest TOF value of 0.24 s–1, whereas the TOF of Ni-N@G is 0.16 s–1, higher than Fe-N@G (0.097 s–1). Therefore, the ORR catalytic activities of M-N@Gs decreases in the order of Co-N@G > Fe-N@G > Ni-N@G, and the OER catalytic activities of M-N@Gs decreases in the order of Co-N@G > Ni-N@G > Fe-N@G. Furthermore, as shown in Fig. 2f, the Co-N@G has the best ORR/OER catalytic activity determined from the smallest potential difference (0.98 V) between ORR potential at half-wave and OER potential at 10 mA/cm2. Depending on all the above results, we can conclude that the differences in catalytic activities of M-N@Gs for ORR and OER lies in the type of metal atoms within the M-N@C active sites.
Figure 2
Figure 2.
Electrocatalytic activities of M-N@Gs for ORR and OER. (a) LSV curves of M-N@Gs and N@G for ORR in 0.1 mol/L KOH at 1600 rpm. (b) LSV curves of Co-N@G for ORR at different rotation rates in rpm. Inset is the corresponding K-L plots at different potentials including the calculated number of electron transfer (n). (c) Tafel slopes derived from (a). (d) LSV curves of different catalysts for OER in 0.1 mol/L KOH. (e) Tafel slopes derived from (d). (f) LSV curves of different catalysts for both ORR and OER in 0.1 mol/L KOH.
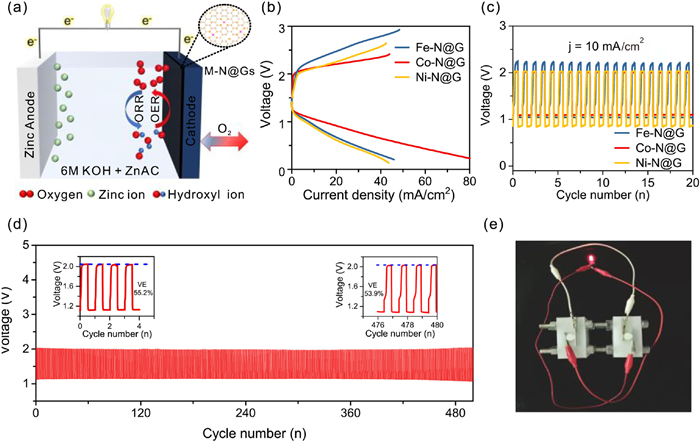
To further evaluate the electrochemical performances of three types of M-N@Gs as catalysts in a full-cell, a rechargeable liquid Zn-air battery was built, in which Zn foil was used as anode and M-N@Gs catalysts loaded on carbon paper as cathode, using 6 mol/L KOH with 0.2 mol/L zinc acetate as the electrolyte (Fig. 3a). The open-circuit voltage of the Zn-air battery (Fig. S17 in Supporting information) using Co-N@G as the cathode catalyst was demonstrated to be 1.43 V, which is higher than that of the Fe-N@G (1.37 V) and the Ni-N@G (1.34 V). Fig. 3b displays the charge and discharge polarization curves for Zn-air battery catalyzed by Co-N@G in comparison with the Fe-N@G and Ni-N@G. A much lower charge-discharge voltage gap was obtained for the Zn−air battery catalyzed by Co-N@G due to its robust bifunctional catalytic activity, suggesting a superior rechargeability. Additionally, at the same current density, the Zn-air battery with Fe-N@G as catalyst exhibits a higher discharge voltage and a higher charge voltage than Ni-N@G. We noted that the voltage gaps for Zn-air batteries using M-N@Gs as catalysts are all higher than the Pt/C + RuO2 electrode (Fig. S19 in Supporting information), consistent with the ORR/OER results. The galvanostatic discharge/charge cycling experiment was performed at a constant current density of 10 mA/cm2 (Fig. 3c). As expected, the Zn-air battery driven by Co-N@G shows a lower charge-discharge voltage gap (0.9 V) with a high voltage efficiency of 55% (discharge potential of 1.1 V and charge potential of 2 V). Interestingly, both the charge and discharge potential plateaus of the Zn-air battery using Ni-N@G as catalyst are lower than those of Fe-N@G, which is in good agreement with the charge-discharge polarization curves. Moreover, a long cycling test of Zn-air batteries with Co-N@G as catalyst was performed at a current density of 5 mA/cm2 (20 min per cycle). As shown in Fig. 3d, the Zn-air battery based on Co-N@G could operate stably for 160 h (480 cycles) without obvious fluctuation of voltage. Throughout the whole 480 cycles of charging and discharging, the voltage efficiency (VE) of the Zn-air battery with Co-N@G as catalysts decreased only by 1.3%, further demonstrating its excellent catalytic stability and rechargeability. Notably, even after a long cycling, single Co sites can still be stably monodispersed in the graphene lattice (Fig. S18 in Supporting information). Remarkably, two Zn-air batteries connected in series with Co-N@G as catalyst could power a red-light emitting diode (LED, 1.8 V) with sparkling light, proving the utility of our home- made Zn-air battery (Fig. 3e). In addition, the Zn-air batteries using Co-N@G as catalysts can achieve an energy density of 366 Wh/kg with a power density of 31 mW/cm2 (Fig. S21 in Supporting information), proving its potential for practical applications.
Figure 3
Figure 3.
Electrochemical performance of Zn-air batteries with M-N@Gs as cathode catalysts. (a) Schematic representation of the rechargeable Zn−air battery. (b) Charge and discharge polarization curves. (c) Galvanostatic discharge–charge cycling curves at 10 mA/cm2 of the rechargeable Zn-air batteries with different catalysts. (d) Long time cycling test at 5 mA/cm2 with Co-N@G as the cathode catalyst. Inset is the voltage efficiency (VE) of Zn-air batteries during the cycling test. (e) Photograph of a red LED (1.8 V) powered by two Zn–air batteries connected in series with Co-N@G as catalysts.
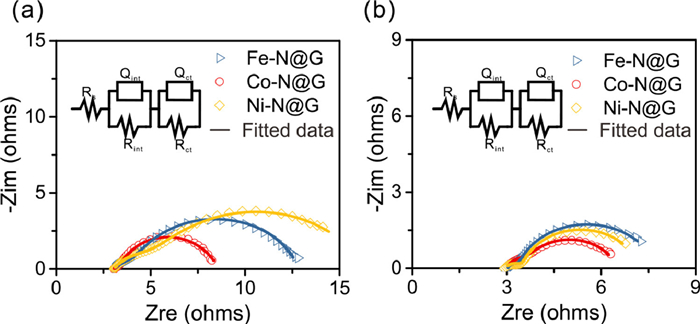
The electrochemical impendence spectroscopy (EIS) technique was further performed to fully understand the reason for the differences in Zn-air battery performance of M-N@Gs during discharging or charging process, As shown in Fig. 4, all Nyquist plots consists of two semicircles at high and low frequency regions, which can be modeled by an equivalent circuit with five elements Rs, Rint, Rct, Qint and Qdl. Rs and Rint represent solution resistance and solid-liquid interface resistance, respectively. Qint and Qdl are constant phase elements representing the capacitance arising from solid-electrolyte interface. Rct represents charge transfer resistance of the air cathode, which reflects the kinetics of the electrochemical reaction and is directly related to catalytic activities of the catalysts [38-40]. When battery discharging at 1 V (Fig. 4a), The fitted data according to the equivalent circuit are reported in Table S2 (Supporting information). The air cathode coated with M-N@Gs exhibits similar value of Rs and Rint. It was found out that Co-N@G has the lowest Rct followed by Fe-N@G and Ni-N@G, which can be a reason for the highest discharge current observed in Fig. 3b. The Rct value of Co-N@G is 53% lower than Fe-N@G and 64% lower than Ni-N@G. Similar impedance study was also conducted during battery charging at 2.3 V (Fig. 4b). The values of different circuit elements are listed in Table S3 (Supporting information). We noted that Co-N@G displays the lowest Rct value followed by Ni-N@G. And Fe-N@G demonstrates the greatest Rct value, which impedes the battery charge process with the highest charge voltage. Based on the above analysis, we can see that the Rct value of the air cathode coated with M-N@Gs in the order of increasing value is Co-N@G, Fe-N@G and Ni-N@G during battery discharging at 1 V, while the Rct value of the air cathode coated with M-NGs in the order of increasing value is Co-N@G, Ni-N@G and Fe-N@G during battery charging at 2.3 V. The trend in the Rct value during battery discharging/charging process agrees well with the charge transfer capabilities of M-N@Gs in single ORR/OER processes (Fig. S20 in Supporting information), reflecting exactly the electrocatalytic activities of M-N@Gs for ORR/OER. The lowest Rct value of Co-N@G under battery operation leads to superior battery performance with the lowest voltage gap and an outstanding stability, strongly indicates its excellent ORR/OER catalytic activity.
Figure 4
Figure 4.
Nyquist plots obtained by EIS of the zinc−air batteries with Co-N@G, Fe-N@G and Ni-N@G as catalysts during battery (a) discharging at 1 V and (b) charging at 2.3 V, respectively. Inset is the equivalent circuit.
In summary, we successfully synthesized three types of single atom catalysts with atomically dispersed transition metals on nitrogen-doped graphene sheets (M-N@Gs, M = Co, Fe and Ni) via a simple thermal treatment method. The M-N@Gs catalytic materials with similar physicochemical properties contains identical M-N@C coordination configuration yet exhibit distinctly different catalytic activities. The ORR catalytic activity follows the trend Co-N@G > Fe-N@G > Ni-N@G, while the OER catalytic activity follows the trend Co-N@G > Ni-N@G > Fe-N@G. The favorable charge transfer between Co-N@C active sites and the oxygen-containing intermediates, demonstrated by electrochemical impendence spectroscopy, leads to its superior ORR/OER bifunctional electrocatalytic activity and its remarkable Zn-air battery performance. This work not only designs an efficient bifunctional electrocatalyst but also shed lights on the understanding of the electrocatalytic activities of different central metal atoms in M-N@C active moieties embedded in graphene, which provides important references for fabricating more efficient and robust non-noble metal electrocatalysts applied in energy conversion and storage devices.
Declaration of competing interest
The authors declare that they have no known competing financial interests or personal relationships that could have appeared to influence the work reported in this paper.
Acknowledgments
We appreciate funding support from the National Natural Science Foundation of China (Nos. U2032202, 22125902 and 21975243), DNL cooperation Fund, CAS (No. DNL202020), Fundamental Research Funds for the Central Universities (Nos. WK2060000013 and YD3430002001), Users with Excellence Program of Hefei Science Center CAS (No. 2021HSC-UE002).
Supplementary materials
Supplementary material associated with this article can be found, in the online version, at doi:10.1016/j.cclet.2022.07.024.
[1]
F. Cheng, J. Chen, Chem. Soc. Rev. 41 (2012) 2172-2192. doi: 10.1039/c1cs15228a
[2]
K.W. Leong, Y. Wang, M. Ni, et al., Renew. Sust. Energ. Rev. 154 (2022) 111771.
[3]
M. Wu, G. Zhang, M. Wu, J. Prakash, S. Sun, Energy Stor. Mater. 21 (2019) 253-286.
Z. Chen, A. Yu, D. Higgins, et al., Nano Lett. 12 (2012) 1946-1952. doi: 10.1021/nl2044327
[39]
D.U. Lee, M.G. Park, H.W. Park, et al., ChemSusChem 8 (2015) 3129-3138. doi: 10.1002/cssc.201500609
[40]
D.U. Lee, H.W. Park, M.G. Park, V. Ismayilov, Z. Chen, ACS Appl. Mater. Interfaces 7 (2015) 902-910. doi: 10.1021/am507470f
Figure 1
Structure characterizations of M-N@Gs. (a–c) HAADF-STEM images of Co-N@G, Fe-N@G and Ni-N@G. (d–f) The experimental K-edge XANES spectra of M-N@Gs with their reference samples (metal foil and metal oxide). (g) High resolution N 1 s XPS spectra of M-N@Gs and N@G. (h) Wavelet transforms for the k2-weighted EXAFS signal of M-N@Gs.
Figure 2
Electrocatalytic activities of M-N@Gs for ORR and OER. (a) LSV curves of M-N@Gs and N@G for ORR in 0.1 mol/L KOH at 1600 rpm. (b) LSV curves of Co-N@G for ORR at different rotation rates in rpm. Inset is the corresponding K-L plots at different potentials including the calculated number of electron transfer (n). (c) Tafel slopes derived from (a). (d) LSV curves of different catalysts for OER in 0.1 mol/L KOH. (e) Tafel slopes derived from (d). (f) LSV curves of different catalysts for both ORR and OER in 0.1 mol/L KOH.
Figure 3
Electrochemical performance of Zn-air batteries with M-N@Gs as cathode catalysts. (a) Schematic representation of the rechargeable Zn−air battery. (b) Charge and discharge polarization curves. (c) Galvanostatic discharge–charge cycling curves at 10 mA/cm2 of the rechargeable Zn-air batteries with different catalysts. (d) Long time cycling test at 5 mA/cm2 with Co-N@G as the cathode catalyst. Inset is the voltage efficiency (VE) of Zn-air batteries during the cycling test. (e) Photograph of a red LED (1.8 V) powered by two Zn–air batteries connected in series with Co-N@G as catalysts.
Figure 4
Nyquist plots obtained by EIS of the zinc−air batteries with Co-N@G, Fe-N@G and Ni-N@G as catalysts during battery (a) discharging at 1 V and (b) charging at 2.3 V, respectively. Inset is the equivalent circuit.

 DownLoad:


 下载:
下载:


