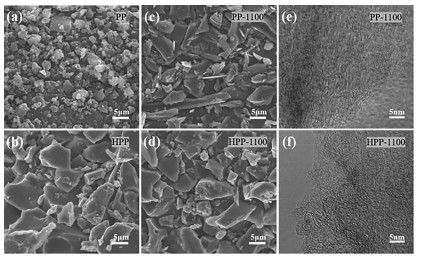
Figure 1.
SEM images of (a) PP (pristine pitch), (b) HPP (HNO3 pre-oxidation pitch), (c) PP-1100, (d) HPP-1100. HRTEM images of (e) PP-1100, (f) HPP-1100.
A solvothermal pre-oxidation strategy converting pitch from soft carbon to hard carbon for enhanced sodium storage
Jing Wang , Lei Yan , Binhua Liu , Qingjuan Ren , Linlin Fan , Zhiqiang Shi , Qingyin Zhang

Lithium-ion batteries (LIBs) with high energy density, no memory effect and low self-discharge performance have been widely used in various energy storage systems. However, the limited and uneven distribution of lithium resources gradually makes it difficult to meet the future requirements for large-scale energy storage [1, 2]. With a similar mechanism to LIBs, sodium-ion batteries (SIBs) are considered potential replacements due to their abundant materials and lower cost [3, 4].
The discovery of possible anode materials is slightly delayed compared to the recent extensive research on suitable cathode materials, which has greatly inhibited the commercialization of SIBs. In particular, the commercial anode graphite for LIBs exhibits a very low capacity of 35 mAh/g in SIBs, with no practical significance [5]. Among various anode materials, hard carbon (HC) with a unique disordered structure is considered the most commercially promising material. Due to large interlayer distance and lattice defects, it exhibits a high reversible capacity and cycling stability [6, 7]. However, HC precursors generally show very low yields during carbonization (< 40%), inadvertently increasing the cost of SIBs. Moreover, HC indicates poor rate capability in conventional ester-based electrolytes, which is also a major problem hindering commercialization. Fortunately, recent studies have shown that ether-based electrolytes can improve this problem significantly [8].
As a by-product of the petroleum/coal industry, the pitch is readily available, inexpensive, and possesses high carbonization yields, making it a widely used precursor for soft carbon anodes in LIBs. However, the soft carbon obtained by direct pyrolysis pitch exhibits a high order degree, small interlayer spacing, and few defect sites, resulting in unsatisfactory sodium storage performance [9]. Recently, studies have shown that the high order degree of pitch pyrolytic carbon is related to the high H/C ratio in the precursor [10]. At the same time, the introduction of a large number of heteroatoms such as O and N can neutralize the excess H atoms in the precursor and inhibit its excessive graphitization [11].
Here, we propose a dilute HNO3 solvothermal pre-oxidation strategy to suppress pitch graphitization and prepare highly disordered carbons. The oxygen atoms generated by the decomposition of HNO3 form a stable cross-linked structure with the pitch molecules, thereby inhibiting its rearrangement. The results show that the pre-oxidized pitch-based carbon (HPP-1100) indicates a higher degree of disorder, larger interlayer spacing and more defects than the direct pyrolysis pitch samples (PP-1100), realizing the miraculous transformation from soft carbon precursor to hard carbon. When evaluated as an anode for SIBs, HPP-1100 exhibits a reversible capacity of 306.7 mAh/g at 0.1 C, far exceeding that of PP-1100 (120.3 mAh/g), and displays excellent rate and long-term performance (116.5 mAh/g at 10 C). Moreover, when assorted with an O3-Na(NiFeMn)1/3O2 cathode, the full cell delivers a high reversible capacity of 274.0 mAh/g at 0.1 C with superb cycle life. This work provides new insights and solutions for the fabrication of highly disordered carbon SIBs anodes from low-cost soft carbon precursors.
The morphology of the samples was observed by SEM, as shown in Fig. 1. The pristine pitch (PP) particle size increases significantly after direct pyrolysis at 1100 ℃, and the particle surface is smoother (Figs. 1a and c). It is due to the melting and rearrangement process of the pitch during pyrolysis [12]. However, similar morphology appeared after pre-oxidation (HPP), indicating that the pitch underwent similar melting and solidification processes during the solvothermal process (Fig. 1b). The difference is that the oxygen atoms generated by the decomposition of nitric acid will cross-link with the molten pitch molecules, inhibiting their ordering rearrangement. The fact that the morphology of the pre-oxidized bitumen before and after pyrolysis hardly changes also confirms this view (Fig. 1d).
The TG-DTG curves (Fig. S1 in Supporting information) compared the pyrolysis processes of PP and HPP. For the PP, significant weight loss occurs only in the temperature range of 400–550 ℃, corresponding to the violent reformation carbonization process of the pitch [13]. In contrast, the curve for the HPP sample presents a marked difference. First, the pyrolysis process expands from a narrower temperature range to a wider range. Secondly, the main weight loss zone appears in a lower temperature range (250–400 ℃), corresponding to the removal of small molecules. Such results are very similar to the thermogravimetric curves of hard carbon precursors. The above changes indicate that the HNO3 pre-oxidation process can improve the cross-linking degree of the pitch molecules, thereby effectively inhibiting its graphitization. The higher carbonization yield of HPP also supports this view. Fortunately, a higher carbonization yield means lower production costs.
The microstructure structural variation of PP-1100 and HPP-1100 can be observed visually and effectively in the HRTEM diagram. As shown in Fig. 1e, the PP-1100 derived from the pristine pitch exhibits an ordered graphite-like structure with long-range well-arranged carbon layers. On the contrary, the HPP-1100 displays a different microstructure shown in Fig. 1f. A lot of curved disordered graphite-like crystallite stacking structures appeared, and many closed voids and defects were formed between them. These are typically structural features of hard carbon. In addition, the interlayer spacing is also significantly larger than that of PP-1100. These changes all indicate that the HNO3 pre-oxidation strategy achieves the effect of converting the soft carbon precursor into hard carbon.
The microstructures of the PP-1100 and HPP-1100 samples were characterized by XRD patterns (Fig. 2a). Both samples show two diffraction peaks around 23° and 43°, corresponding to the 002 and 100 crystal planes, respectively. Different from the high and sharp peak of PP-1100, the 002 peak of HPP-1100 is gentler and shifted to a low angle, proving that the pre-oxidation process effectively inhibits the graphitization of pitch. For an accurate comparison, the d002 value of the two samples was further calculated. Unlike PP-1100, which shows a typical soft carbon eigenvalue of 0.352 nm, HPP-1100 achieves an astonishing d002 value of 0.378 nm, which is within the typical interlayer spacing range of hard carbon [14]. The significantly increased d002 suggests that the HNO3 pre-oxidation strategy retarded the graphitization of the pitch, which will enhance the sodium storage. The above XRD analysis is also supported by the Raman spectroscopy results presented in Fig. 2b. The Raman spectra of both samples present a D peak located at ~1350 cm−1 and a G peak at ~1580 cm−1, corresponding to the disordered and graphitized structures in the carbon materials, respectively. The Raman spectra were deconvoluted into four Lorentz peaks [15], with the ID1/IG usually used to describe the degree of disorder of carbon materials. Compared with PP-1100, HPP-1100 shows a higher ID1/IG value, suggesting the presence of more disordered structures.
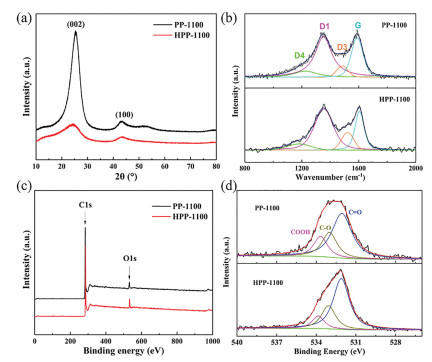
The XPS test was performed to analyze further the surface elemental distribution and oxygen functional groups of these two samples. As shown in Fig. 2c, the content of O in HPP-1100 was significantly higher than that in PP-1100, with 7.21 at% and 3.84 at%, respectively. It proves that the pre-oxidation strategy successfully introduces additional oxygen atoms and cross-links with pitch molecules. The high-resolution O 1s spectra can be deconvoluted into C=O, C-O, and COOH at 532.0, 533.2 and 534.0 eV (Fig. 2d) [16]. The results indicate that PP-1100 displays a higher C=O content than PP-1100, which is beneficial to the reversible reaction with Na+, thus improving sodium storage [17].
Fig. 3a shows the first cycle galvanostatic discharge/charge curves between 0 and 2.8 V at a rate of 0.1 C (1 C = 200 mA/g). Compared with PP-1100, the reversible capacity and initial coulombic efficiency (ICE) of the HPP-1100 were significantly improved (120.3 mAh/g to 306.7 mAh/g, 56.7% to 79.2%). Furthermore, the full capacity of PP-1100 is almost represented by the slope section. In contrast, the reversible capacity of the HPP-1100 sample consists of two regions: the plateau (< 0.1 V) and the slope (> 0.1 V), which is a typical curve for hard carbon sodium storage [18]. It is mainly due to replacing the long-range ordered graphite layers with the shorter large interlayer graphite-like crystallites, allowing the intercalation and deintercalation of Na+. The above results were verified in cyclic voltammetry curves: HPP-1100 exhibits a smaller irreversible area in the first cycle and a stronger redox peak at 0.1 V than PP-1100 (Fig. S2 in Supporting information). Compared with pitch-based carbon anodes in other literature, HPP-1100 also leads the way in reversible capacity and ICE (Table S1 in Supporting information). These data suggest that the HNO3 pre-oxidation strategy can indeed suppress the excessive graphitization of the pitch and convert the soft carbon to hard carbon, thereby greatly enhancing sodium storage.
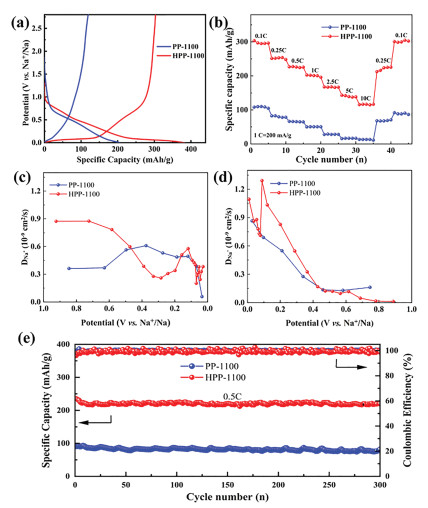
In terms of rate performance, the advantages of the HPP-1100 electrode are further highlighted (Fig. 3b). Evidently, HPP-1100 offers a higher sodium storage capacity than PP-1100 under all rates, indicating excellent Na+ transport kinetic performance and stability. Even at 10 C, HPP-1100 can still maintain a reversible capacity of 116.5 mAh/g, while PP-1100 barely provides capacity at this time. It is closely related to the larger interlayer spacing and abundant pore in HPP-1100.
To better explore the kinetic process and sodium storage mechanism, a galvanostatic intermittent titration technique (GITT) test was performed (Fig. S3 in Supporting information). The apparent sodium diffusion coefficient (DNa+) was calculated by the GITT curve according to Fick's second law [19]. As shown in Fig. 3c, the DNa+ of PP-1100 maintained a decreasing trend throughout the sodiation and desodiation process. Differently, the DNa+ of HPP-1100 decreases rapidly around 0.1 V during the sodiation process, with a slight increase in DNa+ upon further sodiation. The variation of DNa+ in the slope and plateau regions indicates lower diffusion kinetics in the low-voltage plateau region, corresponding to the intercalation of Na+ in the carbon layers. In contrast, the larger DNa+ at high potentials originates from the surface capacitive response [20, 18]. The increase in DNa+ below 0.1 V should be related to the filling of sodium ions in the nanopores [21, 22]. These are typical characteristics of composite hard carbon sodium storage [23].
Furthermore, the long-term cycling stability of the two electrodes was compared at 0.5 C (Fig. 3e). After 300 cycles, HPP-1100 still exhibits an excellent reversible capacity of 213.6 mAh/g with a capacity retention of 90.7%, which is much higher than that of PP-1100 (84.1 mAh/g, 74.8%). It indicates that increasing the interlayer spacing of graphite-like crystallites by pre-oxidation can improve the sodium storage kinetics and expand the cycling stability of the material.
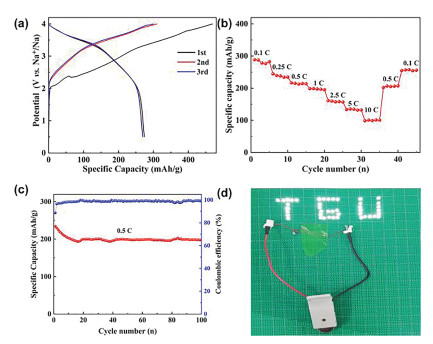
Based on the excellent electrochemical performance of the HPP-1100 electrode in the half-cell, the full cell was assembled with O3-Na(NiFeMn)1/3O2 as the cathode to evaluate its practical application in SIBs. Fig. 4 illustrates the electrochemical performance of the HPP-1100//O3-Na(NiFeMn)1/3O2 full cell in the voltage range of 0.5–4 V. It exhibits a reversible capacity of 274.0 mAh/g at a current density of 0.1 C and maintains a specific capacity of 101.3 mAh/g at a large rate of 10 C. After 100 cycles at 0.5 C, the reversible capacity can remain 199.7 mAh/g with a capacity retention of 85.5%, indicating the excellent rate and cycle stability of the full cell. Meanwhile, the full cell lights up the TGU-type LED bulb array, further proving the practical value (Fig. 4d).
In conclusion, a solvothermal pre-oxidation strategy is proposed to introduce additional oxygen atoms into the pitch to form a stable cross-linked structure that effectively suppresses excessive graphitization during pyrolysis. This strategy prepared amorphous carbon with a high degree of disorder and large carbon interlayer spacing, successfully achieving the magical effect of soft carbon becoming hard carbon. Compared with soft carbon obtained by direct pyrolysis of pitch, HPP-1100 exhibits superior sodium storage performance with a high reversible capacity of 306.7 mAh/g, excellent rate performance and long cycle stability (116.5 mAh/g at 10 C). When matched with an O3-Na(NiFeMn)1/3O2 cathode, the full cell manifests superb capacity and cycle life. The preparation of pitch-based amorphous carbon materials with a solvothermal pre-oxidation strategy deepens the understanding of inhibiting the graphitization of soft carbon precursors and develops a new idea for the design of low-cost, high-capacity and rate-performing carbon anodes.
The authors declare that there is no interest for this manuscript.
This work was supported by the National Natural Science Foundation of China (No. 22179094). We would like to thank the Analytical &Testing Center of Tiangong University for our work on the morphology and structure characterization of samples.
Supplementary material associated with this article can be found, in the online version, at doi:
P.K. Nayak, L.T. Yang, W. Brehm, P. Adelhelm, Angew. Chem. Int. Ed. 57 (2018) 102–120. doi: 10.1002/anie.201703772
K. Chayambuka, G. Mulder, D.L. Danilov, P.H.L. Notten, Adv. Energy Mater. 8 (2018) 1800079. doi: 10.1002/aenm.201800079
H. Zhang, I. Hasa, S. Passerini, Adv. Energy Mater. 8 (2018) 1702582. doi: 10.1002/aenm.201702582
J.Y. Hwang, S.T. Myung, Y.K. Sun, Chem. Soc. Rev. 46 (2017) 3529–3614. doi: 10.1039/C6CS00776G
Y.E. Zhu, L. Yang, X. Zhou, F. Li, J. Wei, Z. Zhou, J. Mater. Chem. A 5 (2017) 9528–9532. doi: 10.1039/C7TA02515G
X.W. Dou, I. Hasa, D. Saurel, et al., Mater. Today 23 (2019) 87–104. doi: 10.1016/j.mattod.2018.12.040
H. Hou, X. Qiu, W. Wei, Y. Zhang, X. Ji, Adv. Energy Mater. 7 (2017) 1602898. doi: 10.1002/aenm.201602898
J. Pan, Y.Y. Sun, Y. Yan, et al., JACS Au 1 (2021) 1208–1216. doi: 10.1021/jacsau.1c00158
Y. Lu, C. Zhao, X. Qi, et al., Adv. Energy Mater. 8 (2018) 1800108. doi: 10.1002/aenm.201800108
J.J. Kipling, J.N. Sherwood, P.V. Shooter, N.R. Thompson, Carbon 1 (1964) 315–320. doi: 10.1016/0008-6223(64)90285-4
Y. Qi, Y. Lu, L. Liu, et al., Energy Storage Mater. 26 (2020) 577–584. doi: 10.1016/j.ensm.2019.11.031
D. Saurel, B. Orayech, B.W. Xiao, et al., Adv. Energy Mater. 8 (2018) 1703268. doi: 10.1002/aenm.201703268
Y.R. Qi, Y.X. Lu, F.X. Ding, et al., Angew. Chem. Int. Ed. 58 (2019) 4361–4365. doi: 10.1002/anie.201900005
N. Sun, Z. Guan, Y. Liu, et al., Adv. Energy Mater. 9 (2019) 1901351. doi: 10.1002/aenm.201901351
Q.Q. Shi, D.P. Liu, Y. Wang, et al., Small 15 (2019) 1901724. doi: 10.1002/smll.201901724
C. Yu, H. Hou, X. Liu, et al., Int. J. Hydrogen Energy 43 (2018) 3253–3260. doi: 10.1016/j.ijhydene.2017.12.151
H. Wang, F. Sun, Z. Qu, et al., ACS Sustain. Chem. Eng. 7 (2019) 18554–18565. doi: 10.1021/acssuschemeng.9b04676
S. Qiu, L. Xiao, M.L. Sushko, et al., Adv. Energy Mater. 7 (2017) 1700403. doi: 10.1002/aenm.201700403
J. Wang, L. Yan, Q. Ren, et al., Electrochim. Acta 291 (2018) 188–196. doi: 10.1111/are.13447
W. Luo, Z.L. Jian, Z.Y. Xing, et al., ACS Central Sci. 1 (2015) 516–522. doi: 10.1021/acscentsci.5b00329
Y.M. Li, Y.S. Hu, M.M. Titirici, L.Q. Chen, X.J. Huang, Adv. Energy Mater. 6 (2016) 1600659. doi: 10.1002/aenm.201600659
Q. Jin, K. Wang, P. Feng, et al., Energy Storage Mater. 27 (2020) 43–50. doi: 10.1016/j.ensm.2020.01.014
Q. Ren, J. Wang, L. Yan, et al., Chem. Eng. J. 425 (2021) 131656. doi: 10.1016/j.cej.2021.131656

Figure 1 SEM images of (a) PP (pristine pitch), (b) HPP (HNO3 pre-oxidation pitch), (c) PP-1100, (d) HPP-1100. HRTEM images of (e) PP-1100, (f) HPP-1100.

Figure 2 (a) XRD patterns, (b) Raman spectra, (c) XPS spectra, and (d) deconvoluted O 1s spectra of PP-1100 and HPP-1100.

Figure 3 (a) Initial discharge/charge curves and (b) rate performance of PP-1100 and HPP-1100. The Na+ apparent diffusion coefficient by GITT during (c) sodiation and (d) desodiation process. (e) Long cycle performance of PP-1100 and HPP-1100.

 扫一扫看文章

扫一扫关注我们
 DownLoad:
 下载:
下载:
