Figure 1.
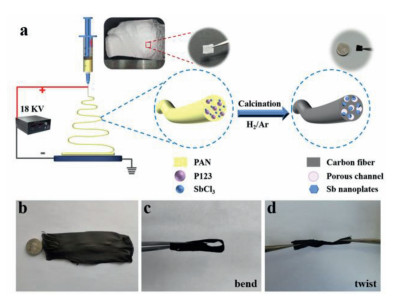
(a) Schematic diagram of the preparation process of Sb@PCNFs. (b-d) Digital photos of Sb@PCNFs at different states.
Freestanding film formed with Sb-nanoplates embedded in flexible porous carbon nanofibers as a binder-free anode for high-performance wearable potassium-ion battery
Qi Chen , Hongbao Li , Hao Li , Rui Wang , Quanwei Ma , Longhai Zhang , Chaofeng Zhang

The ever-growing demand for wearable electronic devices has motivated related research to free-standing and flexible film electrode with high capability and good wearability [1, 2]. Among them, the development of lithium-ion batteries (LIBs) is restricted due to the limited and uneven distribution of the earth's lithium resources and the high cost [3, 4]. Therefore, the development of alternative energy storage systems with rich resource and environmental friendliness has becoming urgent [5-7]. Potassium ion batteries (PIBs) have attracted much attention due to abundant raw resources of K and low redox potential [8-10]. However, large radius of K+ (1.38 Å) will cause slow diffusion kinetics and large volume expansion during charging and discharging, leading to poor rate capability and cycle stability [11, 12]. Therefore, to obtain high-performance PIBs, it is essential to develop suitable electrode materials with stable structures [13, 14].
Up to now, high-capacity anode materials with alloying reactions have attracted more and more attentions [15]. Alloy-based materials, such as Sn [16] and Sb [17] have been extensively studied in LIBs and sodium-ion batteries (SIBs) due to their high capacities. Among the alloying elements, Sb can store three potassium ions to form K3Sb [18], and has the characteristics of low electrode potential [19], low cost [20], and high theoretical capacity (660 mAh/g) [21], thus becoming a promising candidate as anode for PIBs. However, the huge volume expansion (300%) during cycling can cause the active material to be crushed, resulting in capacity decay [22]. One of the useful methods to solve the problem is to introduce active/inactive materials to buffer the volume change during the cycling [23]. In addition, highly porous structure can provide large contact area for active materials and electrolyte, and huge space for accommodating the volume change during charging/discharging [24, 25]. Moreover, N-doping can also provide electroactive sites for K+, enhancing K+ adsorption and improving capacity and reaction kinetics [26, 27]. Furthermore, one dimensional structure can effectively improve the conductivity and structural stability [28]. Therefore, the freestanding film with Sb nanoplates embedded in porous N-dopped carbon nanofibers might demonstrate synergistic properties, showing high reversible capacity and long cycling stability with enhanced ion/electronic transfer kinetics.
Herein, we report a simple and fast way to synthesize Sb nanoplates embedded in flexible porous N-dopped carbon nanofibers (Sb@PCNFs) by using ESD method and carbonization. In this structure, porous N-dopped carbon nanofibers were designed to improve electronic/ionic conductivity and structural stability, and accommodate the volume expansion during cycling. The freestanding film was directly applied as an anode of PIBs, avoiding the redundant quality of conductive agent and binder [29]. When evaluated as anode for PIBs, the Sb@PCNFs freestanding film shows good electrochemical performance with a reversible capacity of 314 mAh/g after 2000 cycles at 500 mA/g. The high performance is better than those of most reported anode materials for PIBs.
Fig. 1a shows the preparation process of Sb@PCNFs, in which P123, SbCl3 and polyacrylonitrile (PAN) were selected as precursors. Figs. 1b–d show the digital photos of Sb@PCNFs. As can be seen from Fig. 1b, the carbonization product of Sb@PCNFs is a black film with good flexibility. Whether bent or twisted (Figs. 1c and d), the film can remain intact and flexible. The morphology and structure of the nanofibers were characterized by SEM and TEM. Without the precursor of SbCl3, PAN derived carbon nanofibers (CNFs) showed a tangled morphology similar to a braid (Figs. S1a and b in Supporting information). After adding suitable SbCl3 in process and removing P123 during the heat treatment, the interconnecting fibers of Sb@PCNFs with several microns in length can be found (Figs. 2a and b). Also, porous structure can be clearly found in the nanofibers (Fig. 2b). Fig. S2 (Supporting information) shows that the decomposition temperature of P123 is lower than the carbonization temperature in the experiment. With the increase of Sb precursor, more Sb plates can be found in the fibers of Sb-H@PCNFs when compared with Sb@PCNFs, as shown in Figs. S1c and d (Supporting information). And it can be seen from the figures that the diameter of Sb-H@PCNFs is a bit larger and the curvature of the fiber is reduced.
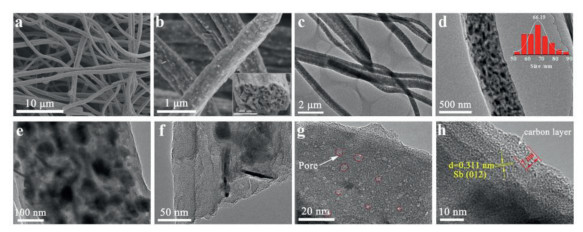
As shown in Fig. 2c, porous structure of Sb@PCNFs can be clearly observed, which is consistent with the SEM image (Fig. 2b). As shown in Figs. 2d–f, Sb can be found uniformly distributed in the carbon nanofiber in the form of flakes. At the same time, many pores with diameter of several nanometers can be observed in the fibers (Fig. 2g). High magnification TEM image (Fig. 2h) revealed that Sb nanoplates were covered by amorphous carbon with the thickness of about 7 nm. For Sb-H@PCNFs, large plates can be clearly observed in the fibers (Figs. S3a–c in Supporting information). Without using SbCl3, CNFs can be found to be porous structure (Figs. S3d–f in Supporting information).
To provide insight into the crystalline structure of the obtained nanofiber membranes, X-ray diffraction (XRD) was used to characterize the samples. As shown in Fig. 3a, all peaks of Sb@PCNFs can be indexed to the diffraction peaks of hexagonal Sb (JCPDS card No. 35–0732). Four intensive peaks at around 28.69°, 40.08°, 41.95° and 51.59° can be well indexed to the (012), (104), (110) and (202) planes of hexagonal Sb phase. The XRD results of CNFs and Sb-H@PCNFs are shown in Figs. S4a and b (Supporting information). The XRD result of Sb-H@PCNFs is consistent with that of hexagonal Sb (JCPDS card No. 35-0732). The Raman spectrum is utilized to further evaluate the nature of Sb@PCNFs nanofiber. The intensity ratio of D and G bands (ID/IG) can indirectly reflect the order degree of carbon [30]. D band corresponds to the structural defects and G band relates to sp2-hybridized graphitic carbon [23]. As shown in Fig. 3b, the Raman spectrum displays typical D band (~1355 cm‒1) and G band (~1588 cm‒1) with high I/I ratio (1.35), suggesting the multiple defects in the nanofibers.
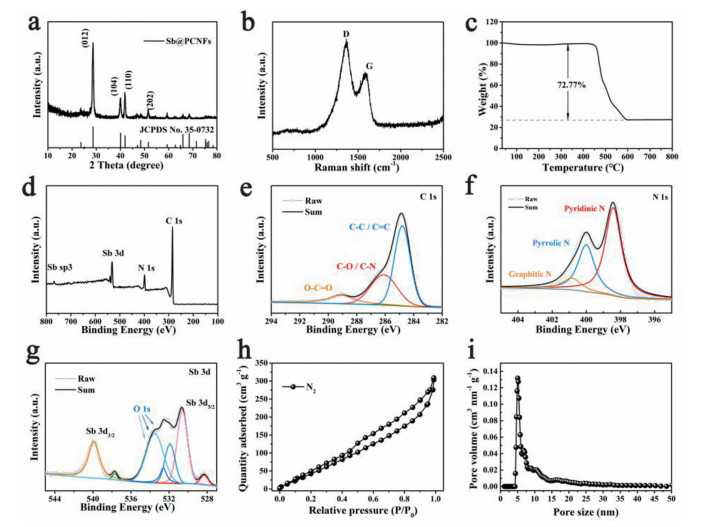
In order to determine the carbon content of these nanofibers, thermogravimetric analysis (TGA) was further performed. As displayed in Fig. 3c, a dramatic weight loss was observed after 450 ℃, which could be attributed to the weight loss of carbon combustion. Sb nanoplates underwent an increase in weight due to the oxidation [31]. XRD result demonstrates that the thermogravimetric product in the air atmosphere was Sb2O4 (JCPDS No. 78-2066) (Fig. S5a in Supporting information). Therefore, the Sb contents in Sb@PCNFs and Sb-H@PCNFs (Fig. S5b in Supporting information) are calculated to be 21.6% and 35.94%, respectively. CNFs burn off between 500 ℃ and 700 ℃ (Fig. S5c in Supporting information).
In order to further study the surface chemical compositions and element valences, X-ray photoelectron spectroscopy (XPS) analysis of Sb@PCNFs was performed (Fig. 3d), As seen in Fig. 3e, the C 1s spectra mainly present three peaks, which could be assigned to C‒C/C=C (284.8 eV), C‒N/C‒O (286.1 eV), and O‒C=O (289.1 eV) bonds, respectively [23, 32]. The N 1s spectrum in Fig. 3f shows three peaks centered at 398.4, 400.0, and 401.0 eV, which can be ascribed to pyridinic N, pyrrolic N, and graphitic N, respectively [33-36]. Fig. 3g demonstrates that the peaks of Sb 3d and O 1s. The binding energies of Sb at 539.9 and 537.7 eV can be corresponding to Sb 3d3/2, and the peaks located at 530.6 and 528.3 eV can be corresponding to Sb 3d5/2 [32, 37, 38]. For O 1s, the region at 531~533 eV can be deconvoluted into O‒C‒H, O‒Sb, and O‒O peaks, originating from the absorbed oxygen and surface oxidation of the samples [38, 39].
To further determine the porous structure of the Sb@PCNFs nanofibers, N2 adsorption/desorption isotherm was measured (Fig. 3h). The nanofibers possess a high Brinauer-Emmett-Teller (BET) specific surface area of 309.25 m2/g. As can be seen from Fig. 3h, the nitrogen adsorption/desorption curves can be classified as the type Ⅳ isotherm with an obvious hysteresis loop at high relative pressure, indicating the existence of mesoporous structure [40-42]. Fig. 3i displays the pore size distribution under DFT method, which shows that the main pore size is 5.012 nm.
The cyclic voltammetry (CV) profiles of the first three cycles at a scan rate of 0.1 mV/s between 0.01 V and 3.0 V (vs. K+/K) were shown in Fig. 4a. In the first cathodic scan, there was a broad peak at 0.80~0.47 V, which was owing to the alloying reaction of Sb with K+ (Sb-KSb-K3Sb) [30]. Several peaks in the voltage range of about 0.2~0.5 V can be observed in the first cycle, then gradually weaken in the subsequent cycles until disappeared in the third cycle, which may be caused by some irreversible reactions [43]. The cathodic peak at 0.05 V could be attributed to the intercalation of K ions into the porous structure [43]. Simultaneously, the anodic peaks were attributed to the dealloying reaction and the deintercalation of K ions [44]. In the subsequent cycles, there were two cathodic peaks at 0.6 V and 0.05 V, and all anodic peaks nearly overlapped [32]. The above results revealed good cycling reversibility of Sb@PCNFs as the anode for PIBs.
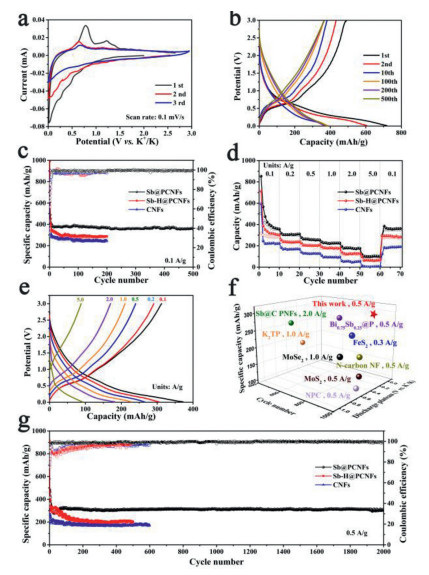
The charge-discharge curves of Sb@PCNFs electrode under the current density of 100 mAh/g was presented in Fig. 4b. The first discharge capacity was 719.26 mAh/g, whereas the first charge specific capacity was 489.98 mAh/g. The low initial Coulombic efficiency (ICE, 68.12%) might be caused by the decomposition of the electrolyte and the formation of the SEI layer on the surface of Sb@PCNFs electrode [45-48]. After 10 cycles, the CE was stable above 99%. The electrochemical cycling stability of the Sb@PCNFs electrode at the current density of 100 mA/g was displayed in Fig. 4c. The electrode can hold a specific capacity of 390 mAh/g even after 500 cycles. As shown in Fig. 4c, Sb-H@PCNFs and CNFs showed specific capacities of 290 and 245 mAh/g at 100 mA/g after 100 cycles, respectively.
Rate capability is significant to evaluate the electrode for PIBs. As shown in Fig. 4d, the rate capabilities of Sb@PCNFs, Sb-H@PCNFs, and CNFs were tested under the current densities of 100, 200, 500, 1000, 2000 and 5000 mA/g. Clearly, Sb@PCNFs anode shows highest specific capacity among the three electrodes. When the current density returned to 100 mA/g, the discharge capacity of Sb@PCNFs could be restored to 370 mAh/g, suggesting that Sb@PCNFs electrode has good rate performance and reversibility. Fig. 4e shows the charge-discharge profiles of rate performance, which demonstrate similar plateaus at different current densities, suggesting excellent reversibility of the anode.
The comparison of electrochemical performance between Sb@PCNFs nanofibers and the state-of-the-art anodes reported for PIBs with at least 500 cycles is illustrated in Fig. 4f and Table S1 (Supporting information) [29, 49-55]. It can be found that Sb@PCNFs show comparative electrochemical performance. Furthermore, the long cycling tests of the three electrodes at 500 mA/g are evaluated. As demonstrated in Fig. 4g, Sb@PCNFs show outstanding cycling stability without appreciable fluctuation over the whole period, particularly, a specific capacity of 314 mAh/g was still retained after 2000 cycles. For comparison, Sb-H@PCNFs and CNFs exhibit declining specific capacities with 203 and 170 mAh/g, respectively. These above results show that a small amount of Sb cannot only maintain the structural integrity of electrode materials, but also demonstrate excellent cycling stability and comparative reversible capability.
Fig. S6 (Supporting information) shows the ex-situ XRD patterns of electrode materials under different charge and discharge states. The peak at 28.8° is a characteristic peak of Sb in the fresh electrode. Along with discharging process, the intensity of the peak at 28.8° gradually decreased and almost disappeared. At the same time, the new peaks of KSb (20.1°) and K3Sb (34.2°) appeared during discharging process, indicating that Sb is gradually undergoing an alloying reaction (Sb → KSb → K3Sb). During the subsequent charging process, the alloy phases of KSb and K3Sb gradually disappeared, accompanied by the formation of amorphous structures [31]. In addition, the morphology characterization after cycling in Fig. S7 (Supporting information) shows that the microstructure of the electrode does not change significantly after 1000 cycles at a current density of 100 mA/g, which indicates that the electrode has good cycling stability.
Fig. 5a displays the CV curves at different sweep rates from 0.1 mV/s to 2.0 mV/s. The CV curves showed similar shapes and evident cathodic-anodic peaks. Fig. 5b shows the relationship of log(i) versus log(v) obtained by calculating the relevant CV data. Based on this relationship, capacitive behavior can be derived according to Eqs. 1 and 2 [41, 56]:
|
|
(1) |
|
|
(2) |
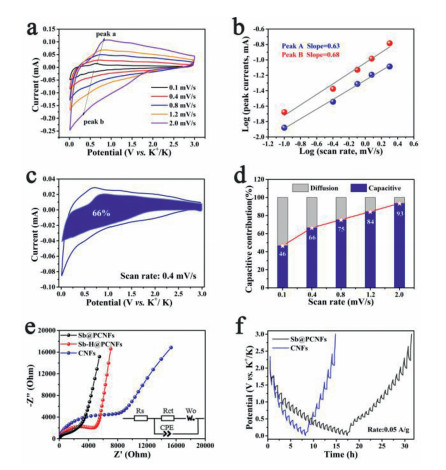
where a and b are adjustable parameters, i is peak current and v represents sweep rate. When b value is equal to 1, the charge storage is completely controlled by the surface limited capacitance process, and the value of b is close to 0.5, corresponding to the diffusion control process [57, 58]. The calculated b-values of the Sb@PCNFs electrode for the marked peaks a and b in Fig. 5b are 0.63 and 0.68, respectively.
In addition, the ratio of capacitance-controlled contribution can also be further calculated by defining the k and v via the following Eqs. 3 and 4 [53]:
|
|
(3) |
|
|
(4) |
where k1 and k2 are the constants. As shown in Figs. 5c and d, as the sweep rate changes from 0.1 mV/s to 2.0 mV/s, the contribution of the capacitive-controlled (blue region) apparently increases from 46% to 93%, which occupies a large fraction of the total K-storage in comparison with the diffusion mechanism, especially at larger sweep rate (Fig. 5d). Such remarkable feature is highly beneficial to the fast K-storage kinetics, therefore resulting in the prominent rate capability [29, 31].
To further analyze the electrochemical kinetics, electrochemical impedance spectroscopy (EIS) and galvanostatic intermittent titration technique (GITT) were tested. The Nyquist diagram of the Sb@PCNFs electrode was shown in Fig. 5e. The inset in Fig. 5e is the simulated equivalent circuit model, in which Rs is the resistance in electrolyte solution, Rct represents the charge transfer resistance, W corresponds to the Warburg diffusion resistance, and CPE is the constant phase element related to the electrical double-layer interface resistance [23, 56]. The Nyquist plots are composed of two parts, one of which is a semicircle at high frequencies, corresponding to the charge transfer [59]. The other is an oblique line at low frequencies, which related to the ion diffusion resistance [60]. It can be seen from Fig. 5e that Sb@PCNFs electrode has relatively smaller charge transfer resistance than CNFs and Sb-H@PCNFs, as can be seen in Table S2 (Supporting information) [47, 61]. Subsequently, GITT after 10 cycles activation were measured to analyze the electrochemical kinetics of Sb@PCNFs and CNFs, as indicated in Fig. 5f. The DK+ was calculated via the following equation [57, 62, 63].
|
|
(6) |
where L is the K-ions transfer distance, τ indicates the relaxation time, ∆Es is the charge of the equilibrium potential, ∆E represents the charge of the voltage. Fig. S8 (Supporting information) shows DK+ of Sb@PCNFs (10‒7~10‒8) in the potassiation and de-potassiation process, which is relatively higher than that of CNFs (10‒7.5~10‒8.5).
In addition, the full cell performance was tested using PTCDA and Sb@PCNFs as cathode and anode (Fig. S9 in Supporting information), respectively. The rate capability is very important for full cell. As shown in Fig. S9c, the capacity decreases as the current density increases. When the current density returned to 100 mA/g, the capacity can also maintain about 105 mAh/g. In addition, the full cell shows a reversible capacity of about 93 mAh/g after 37 cycles at a current density of 100 mA/g (Fig. S9e).
In summary, Sb nanoplates embedded in porous N-dopped carbon nanofibers (Sb@PCNFs) were synthesized by using a simple ESD method. Sb@PCNFs freestanding film formed with 1D nanofibers demonstrates highly flexible and porous structure, thus providing space for accommodating the volume change during charging/discharging and enhanced ion/electronic transfer kinetics. When evaluated as an anode without using conductive agent and binder for PIBs, Sb@PCNFs demonstrate a specific capacity of 390 mAh/g at the current density of 100 mA/g. It still maintains 310 mAh/g after 2000 cycles at a high current density of 500 mA/g. This work provides an effective strategy for the design of high-performance Sb-based freestanding electrodes with high reversible capacity and long cycling stability for energy storage devices.
We have no conflicts of interest to declare.
We thank the financial support from the National Natural Science Foundation of China (Nos. 51872071, 52172173), Anhui Provincial Natural Science Foundation for Distinguished Young Scholar (No. 2108085J25), and Natural Science Research Projects of Universities in Anhui Province (No. KJ2020A0021).
Supplementary material associated with this article can be found, in the online version, at doi:
W. Liu, W. Liu, Y. Jiang, et al., Chin. Chem. Lett. 32 (2021) 1299–1308. doi: 10.1016/j.cclet.2020.08.032
X. Lang, Z. Hu, C. Wang, Chin. Chem. Lett. 32 (2021) 999–1009. doi: 10.1016/j.cclet.2020.10.005
J. Cui, Z.W. Guo, J. Yi, et al., ChemSusChem 13 (2020) 2160–2185. doi: 10.1002/cssc.201903265
Q. Ma, J. Zheng, H. Kang, et al., ACS Appl. Mater. Interfaces 13 (2021) 43002–43010. doi: 10.1021/acsami.1c14973
J. Cui, X. Liu, Y. Xie, et al., Mater. Today Energy 18 (2020) 100563. doi: 10.1016/j.mtener.2020.100563
C. Wu, C. Liao, L. Li, J. Yang, Chin. Chem. Lett. 27 (2016) 1485–1489. doi: 10.1016/j.cclet.2016.03.023
H. Huang, X. Luo, Y. Yao, et al., InfoMat 3 (2021) 421–431. doi: 10.1002/inf2.12176
L. Yang, W. Hong, Y. Tian, et al., Chem. Eng. J. 385 (2020) 123838. doi: 10.1016/j.cej.2019.123838
Y. Xia, W. Jin, Y. Qi, et al., Chin. Chem. Lett. 32 (2021) 2433–2437. doi: 10.1016/j.cclet.2021.01.025
W. Zhang, Y. Liu, Z. Guo, Sci. Adv. 5 (2019) eaav7412. doi: 10.1126/sciadv.aav7412
H. Li, J. Wu, H. Li, et al., Chem. Eng. J. 430 (2022) 132704. doi: 10.1016/j.cej.2021.132704
X. Xie, S. Qi, D. Wu, et al., Chin. Chem. Lett. 31 (2020) 223–226. doi: 10.1016/j.cclet.2019.10.008
Y. Li, Q. Zhang, Y. Yuan, et al., Adv. Energy Mater. 10 (2020) 2000717. doi: 10.1002/aenm.202000717
M. Ma, S. Zhang, L. Wang, et al., Adv. Mater. 33 (2021) 2106232. doi: 10.1002/adma.202106232
Y. Tang, H. Kang, J. Zheng, et al., J. Power Sources 520 (2022) 230895. doi: 10.1016/j.jpowsour.2021.230895
X. Bie, K. Kubota, T. Hosaka, K. Chihara, S. Komaba, J. Mater. Chem. A 5 (2017) 4325–4330. doi: 10.1039/C7TA00220C
T. Yang, J. Zhong, J. Liu, et al., Adv. Funct. Mater. 31 (2021) 2009433. doi: 10.1002/adfm.202009433
W.D. McCulloch, X. Ren, M. Yu, Z. Huang, Y. Wu, ACS Appl. Mater. Interfaces 7 (2015) 26158–26166. doi: 10.1021/acsami.5b08037
Y. An, Y. Tian, L. Ci, et al., ACS Nano 12 (2018) 12932–12940. doi: 10.1021/acsnano.8b08740
W. Zhang, Q. Zhang, Q. Shi, et al., ACS Appl. Mater. Interfaces 11 (2019) 29934–29940. doi: 10.1021/acsami.9b09056
H. Ding, J. Wang, L. Fan, et al., Chem. Eng. J. 395 (2020) 125147. doi: 10.1016/j.cej.2020.125147
N. Wang, Z. Bai, Y. Qian, J. Yang, Adv. Mater. 28 (2016) 4126–4133. doi: 10.1002/adma.201505918
Z. Wang, K. Dong, D. Wang, et al., Chem. Eng. J. 384 (2020) 123327. doi: 10.1016/j.cej.2019.123327
H. Yang, W. Cui, Y. Han, B. Wang, Chin. Chem. Lett. 29 (2018) 842–844. doi: 10.1016/j.cclet.2017.09.024
M. Cai, H. Zhang, Y. Zhang, et al., Sci. Bull. 67 (2022) 933–945. doi: 10.1016/j.scib.2022.02.007
Z. Yan, Q.W. Yang, Q. Wang, J. Ma, Chin. Chem. Lett. 31 (2020) 583–588. doi: 10.1016/j.cclet.2019.11.002
J. Zhou, S. Guo, SmartMat 2 (2021) 176–201. doi: 10.1002/smm2.1042
T. Hou, A. Fan, X. Sun, et al., Chin. Chem. Lett. 32 (2021) 2459–2462. doi: 10.1016/j.cclet.2021.01.049
K. Cao, H. Liu, Y. Jia, et al., Adv. Mater. Technol. 5 (2020) 2000199. doi: 10.1002/admt.202000199
L. Yang, W. Hong, Y. Tian, et al., Chem. Eng. J. 385 (2020) 123838. doi: 10.1016/j.cej.2019.123838
X. Ge, S. Liu, M. Qiao, et al., Angew. Chem. Int. Ed. 58 (2019) 14578–14583. doi: 10.1002/anie.201908918
D. Liu, L. Yang, Z. Chen, et al., Sci. Bull. 65 (2020) 1003–1012. doi: 10.1016/j.scib.2020.03.019
Y. Liu, N. Zhang, C. Yu, L. Jiao, J. Chen, Nano Lett. 16 (2016) 3321–3328. doi: 10.1021/acs.nanolett.6b00942
Y. Liu, N. Zhang, X. Liu, et al., Energy Storage Mater. 9 (2017) 170–178. doi: 10.1016/j.ensm.2017.07.012
Y. Liu, N. Zhang, L. Jiao, J. Chen, Adv. Mater. 27 (2015) 6702–6707. doi: 10.1002/adma.201503015
Y. Liu, F. Wang, L.Z. Fan, Nano Res. 11 (2018) 4026–4037. doi: 10.1007/s12274-018-1985-0
Y. Du, Y. Zhang, L. Li, N. Wang, Y. Chai, Appl. Surf. Sci. 543 (2021) 148870. doi: 10.1016/j.apsusc.2020.148870
Z. Yi, Y. Qian, S. Jiang, et al., Chem. Eng. J. 379 (2020) 122352. doi: 10.1016/j.cej.2019.122352
Y. Han, T. Li, Y. Li, et al., Energy Storage Mater. 20 (2019) 46–54. doi: 10.1016/j.ensm.2018.11.004
M. Zhang, J. Zhong, W. Kong, et al., Energy Environ. Mater. 4 (2020) 413–420.
H. Liu, Z. Wang, Z. Wu, et al., J. Alloy. Compd. 833 (2020) 155127. doi: 10.1016/j.jallcom.2020.155127
Z. Huang, S. Ding, P. Li, C. Chen, M. Zhang, Nanotechnology 32 (2021) 025401. doi: 10.1088/1361-6528/abbb4d
H. Wang, X. Wu, X. Qi, W. Zhao, Z. Ju, Mater. Res. Bull. 103 (2018) 32–37. doi: 10.1016/j.materresbull.2018.03.018
X. Yang, R. Zhang, J. Alloy. Compd. 834 (2020) 155191. doi: 10.1016/j.jallcom.2020.155191
H. Huang, J. Wang, X. Yang, et al., Angew. Chem. Int. Ed. 59 (2020) 14504–14510. doi: 10.1002/anie.202004193
L. Fan, Y. Hu, A.M. Rao, et al., Small Methods 5 (2021) 2101131. doi: 10.1002/smtd.202101131
Y. Hu, Y. Gao, L. Fan, et al., Adv. Energy Mater. 10 (2020) 2002780. doi: 10.1002/aenm.202002780
L. Fan, R. Ma, Q. Zhang, X. Jia, B. Lu, Angew. Chem. Int. Ed. 58 (2019) 10500–10505. doi: 10.1002/anie.201904258
B. Jia, Q. Yu, Y. Zhao, et al., Adv. Funct. Mater. 28 (2018) 1803409. doi: 10.1002/adfm.201803409
W. Wang, B. Jiang, C. Qian, et al., Adv. Mater. 30 (2018) 1801812. doi: 10.1002/adma.201801812
Y. Zhao, J. Zhu, S.J.H. Ong, et al., Adv. Energy Mater. 8 (2018) 1802565. doi: 10.1002/aenm.201802565
X. Qi, K. Huang, X. Wu, et al., Carbon 131 (2018) 79–85. doi: 10.1016/j.carbon.2018.01.094
K.T. Chen, H.Y. Tuan, ACS Nano 14 (2020) 11648–11661. doi: 10.1021/acsnano.0c04203
Y. Xu, C. Zhang, M. Zhou, et al., Nat. Commun. 9 (2018) 1720. doi: 10.1038/s41467-018-04190-z
K. Lei, F. Li, C. Mu, et al., Energy Environ. Sci. 10 (2017) 552–557. doi: 10.1039/C6EE03185D
J. Wang, M. Cao, F. Xu, et al., New J. Chem. 45 (2021) 993–1000. doi: 10.1039/D0NJ05160H
R. Zhao, H. Di, C. Wang, et al., ACS Nano 14 (2020) 13938–13951. doi: 10.1021/acsnano.0c06360
R. Xu, G. Wang, T. Zhou, et al., Nano Energy 39 (2017) 253–261. doi: 10.1016/j.nanoen.2017.07.007
B. Sheng, L. Wang, H. Huang, et al., Small 16 (2020) 2005272. doi: 10.1002/smll.202005272
P. Feng, Z. Cui, S.A. He, et al., J. Mater. Chem. A 7 (2019) 24292–24300. doi: 10.1039/C9TA09093B
J. Ge, L. Fan, A.M. Rao, J. Zhou, B. Lu, Nat. Sustain. 5 (2022) 225–234.
J. Zheng, Y. Yang, X. Fan, et al., Energy Environ. Sci. 12 (2019) 615–623. doi: 10.1039/C8EE02836B
S.G. Zhang, L.F. Qiu, Y. Zheng, et al., Adv. Funct. Mater. 31 (2021) 2006425. doi: 10.1002/adfm.202006425

Figure 1 (a) Schematic diagram of the preparation process of Sb@PCNFs. (b-d) Digital photos of Sb@PCNFs at different states.

Figure 2 Morphological characterization of Sb@PCNFs. (a, b) SEM images, (c-g) TEM and (h) HRTEM images.

Figure 3 Structural characterization of the Sb@PCNFs electrode: (a) XRD pattern, (b) Raman, (c) TG, and (d) XPS. (e–g) High-resolution XPS spectra of C 1s, N 1s and Sb 3d, respectively. (h) The N2 adsorption/desorption isotherm and (i) the corresponding pore size distribution.

Figure 4 Electrochemical performance characterization. (a) CV curves of the Sb@PCNFs electrode at a scanning rate of 0.1 mV/s from 0.01 V to 3.0 V. (b) Charge-discharge voltage profiles of the different cycles for the Sb@PCNFs electrode at a current density of 100 mA/g. (c) Comparative cycling performance at 100 mA/g and (d) rate capabilities of the as-prepared Sb@PCNFs, Sb-H@PCNFs, and CNFs electrodes. (e) Charge-discharge voltage profiles at different current densities of the Sb@PCNFs electrode. (f) Comparison of the rate capability of Sb@PCNFs and the representative KIBs anodes reported in the literature. (g) Cycling performance of Sb@PCNFs, Sb-H@PCNFs and CNFs electrodes at 500 mA/g.

Figure 5 Kinetics analysis. (a) CV curves at different scan rates and (b) relationship between log(i) vs. log(v) for the Sb@PCNFs anode. (c) Capacitive and diffusion-controlled process contributions at 0.4 mV/s and (d) normalized ratio of capacitive-controlled contribution at various scan rates for the Sb@PCNFs anode. (e) Impedance results of the coin cells with Sb@PCNFs, Sb-H@PCNFs, and CNFs in the frequency ranging from 105 Hz to 10‒2 Hz. (f) GITT curves of the Sb@PCNFs and CNFs electrodes.

 扫一扫看文章

扫一扫关注我们
 DownLoad:
 下载:
下载: