National Laboratory of Solid State Microstructures, Collaborative Innovation Center of Advanced Microstructures, College of Engineering and Applied Sciences, Nanjing University, Nanjing 210093, China
b.
Dalian National Laboratory for Clean Energy & State Key Laboratory of Catalysis, Dalian Institute of Chemical Physics, Chinese Academy of Sciences (CAS), Dalian 116023, China
c.
State Key Laboratory of Multiphase Complex Systems, Institute of Process Engineering, Chinese Academy of Sciences, Beijing 100190, China
d.
Nanjing IPE Institute of Green Manufacturing Industry, Nanjing 211100, China
Received Date:
11 May 2021 Accepted Date:
29 June 2021 Revised Date:
13 June 2021 Available Online:
15 January 2022
Abstract:
Sodium (Na) O2 batteries have high energy density and low cost. However, high polarization, complex discharge products, and low Coulombic efficiency (CE) lead to poor cyclability. Here, we proposed an atomically dispersed Ru catalyst on nitrogen-doped graphene for Na-O2 batteries. The catalysts enable the discharge to proceed via a surface-mediated route, which leads to uniform deposition of Na2-xO2 and low polarization during recharge. The first-principle calculation revealed that Ru-N4 complex in the catalyst has strong chemical adsorption to intermediate superoxides, facilitating uniform deposition and enhancing rapid kinetics. In contrast, Ru nanoparticles, despite the catalytic activity, induce bulk deposition via a solution-mediated route because the exposed graphene surface shows weak interaction to superoxides, thereby lowering CEs and cyclability. In brief, the atomically-dispersed Ru catalyst endows Na-O2 batteries with excellent electrochemical properties via a surface-mediated discharge.
Electrochemical energy storage systems are receiving increasing attention to realize the clean energy blueprint. A variety of batteries (Li/Na-ions, flow, metal-sulfur, metal-oxygen, etc.) have been developed to meet the ever-increasing demands of energy storage [1-7]. Among them, metal-air systems demonstrate the highest energy density and arouse the intensive interests of researchers. Especially, sodium-oxygen (Na-O2) batteries have been recently recognized because of their low cost and high energy density [8-16]. Despite modest progress, the theoretical energy density was hardly reached mainly because Na-O2 batteries usually have high charge overpotentials [17-21]. and/or low Coulombic efficiencies (CEs) [22-25]. Upon cycling, Na-O2 batteries exhibit a variety of complex discharge components, which may change with electrochemical conditions and pose difficulty to capture the formation mechanism of discharge intermediate and products [25-29].
Sodium superoxide (NaO2) has been regarded as the stable discharge product in Na-O2 batteries [22, 27, 28, 30, 31]. For example, Hartmann [30], Xia [32] and Sun et al. [27] reported NaO2 as the dominant reaction product of Na-O2 batteries, showing lower overpotentials and low CEs. Liu [33], Hu [34] and Ma et al. [35]. revealed that sodium peroxide (Na2-xO2), which is more thermodynamically stable at room temperature, could also be observed as the discharge products in air electrodes at a similar electrochemical condition. As compared to NaO2, Na2-xO2 has higher energy density and CEs, which may be more suitable for large-scale energy storage [21, 29, 36-38]. It has been found that the decomposition of Na2-xO2 is challenging in Na-O2 batteries. Wu et al. argued that micrometer-sized RuO2 could reduce overpotentials significantly owing to the catalytic effects on boron-doped reduced graphite oxide (rGO) [38]. The discharge products grew into nano-spheres on the surface of the air electrode because of the strong adsorption of oxygen on RuO2. The close contact of discharge products on RuO2 could lead to the complete decomposition of Na2-xO2 at lower voltages. Ma et al. developed a new composite of Pd nanoparticles and ZnO-passivated porous carbon, which could generate Na2O2·2H2O with porous structure after discharge [21]. The Pd catalyst promoted the formation and decomposition of Na2O2·2H2O, thereby leading to the reduction of charge overpotential by ~0.5 V. The co-growth of discharge products on catalyst could greatly improve the reversible decomposition of discharge products. On the contrary, bulk discharge products (usually showing cubic morphology) could also be produced via a solution-mediated route, which readily decreases the CEs and damages the stable surface of anodes because products were separated from the conductive contact of catalyst. The co-growth of discharge products may cover and inactivate the catalyst, decreasing the energy density of Na-O2 batteries [31, 39, 40].
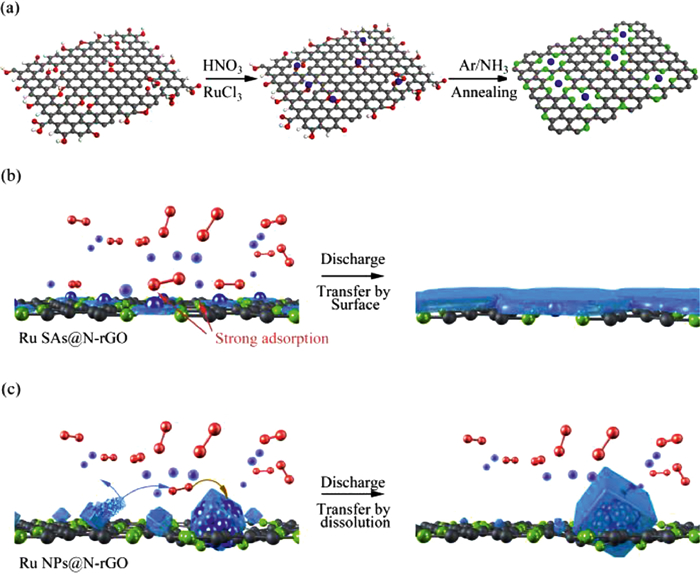
In this work, we prepared atomically dispersed ruthenium (Ru) catalysts for Na-O2 batteries, in which Ru single atoms (Ru-SAs) were anchored on nitrogen (N) doped rGO (Ru-SAs@N-rGO), forming Ru-N4 coordination sites (Fig. 1a). The resulting Ru-N sites show strong adsorption toward the intermediates (NaO2). Such a strong absorption will suppress the dissolution and transportation of NaO2 in the electrolyte, thus inhibiting the growth of cubic discharge products caused by the solution-mediated process (Fig. 1b). In other words, the strong adsorption of NaO2 on Ru-N sites facilitates the in-situ conversion of NaO2 to Na2-xO2 owing to the good contact with electrons and Na ions. It is simply deduced that the energy density of Na-O2 batteries is related to the number of catalytic sites. Highly dispersed Ru SAs provide more catalytic active sites with less Ru content. In contrast, Ru nanoparticles anchored on N-rGO (Ru-NPs@N-rGO) not only show the weak adsorption of NaO2, but also have relatively few catalytic sites, which can readily be passivated by discharge products (Fig. 1c). Owing to the exposure of catalytic sites, Ru-SAs@N-rGO exhibits a high energy density. The co-growth of discharge products can be completely decomposed under 3.7 V because of the good contact with the conductive scaffold. The resultant Na-O2 battery can be cycled 100 times with a capacity of 500 mAh/g.
Figure 1
Figure 1.
Schematic illustration of (a) the preparation procedure of Ru-SAs@N-rGO and Ru-N4 coordination structure; (b) Ru SAs induced a surface-mediated discharge through the strong adsorption of the intermediate NaO2; (c) The solution-mediated discharge leads to cubic morphology of bulk Na2-xO2 on Ru-NPs@N-rGO.
Graphene oxide (GO) was prepared according to Hummer's method [49]. Approximately 50 mg GO powder was dispersed in 50 mL HNO3 by ultrasonication and stirring. After 3 h, 3 mg RuCl3 was added into the as-obtained GO suspension. The mixed suspension was stirred for 24 h and transferred to an autoclave, which was heated at 180 ℃ for 3 h. The obtained powder was dehydrated in a freeze dryer and further reduced by NH3 at 600 ℃ in a tube furnace to form the Ru-SAs@N-rGO. The Ru-NPs@N-rGO was reduced at 900 ℃ while the other processes were as same as Ru-SAs@N-rGO. Without adding RuCl3, the GO power was converted to N-rGO using the same synthetic procedure.
Morphological and elemental mapping images were obtained with a filed-emission scanning electron microscopy (SEM) (ZEISS Ultra 55, 3 kV) and scanning transmission electron microscope (STEM) (Tecnai G2 20, 200 kV). X-ray photoelectron spectroscopy (XPS) spectra were analyzed on a K-Alpha (Thermo Scientific) photoelectron spectrometer using monochromatic Al Kα radiation (1486.6 eV). X-ray diffraction (XRD) patterns were collected on a Rigaku D/Max Ⅲ X-ray diffractometer with Cu-Kα radiation (λ = 1.5418 Å). Ru K-edge (22 117 eV) data were collected at the Hard X-ray MicroAnalysis (HXMA) beamline of Shanghai Synchrotron Radiation Facility (SSRF). The samples were loaded into a polyimide film cell and collected using flsorescence mode. The catalysts, Super P and poly(1, 1-difluoroethylene) were mixed with 8:1:1 mass ratio and sprayed on carbon paper to prepare the air diffusion cathode. The loading mass of catalysts was about 1.5 mg/cm2. All samples were assembled into 2032 coin cells with mesh window in an Ar-filled glovebox. Celgard 2400 membrane was used as the separator. The electrolyte was 0.5 mol/L NaSO3CF3 in diethylene glycol dimethyl ether. The assembled cells were rested for 12 h before electrochemical tests. The cyclic voltammetry (CV) is run at 0.2 mV/s and the current density of cells for cycling is 150 mA/g. Galvanostatic cycling was conducted with a battery tester system (LAND Corp. China). CV and electrochemical impedance spectroscopy (EIS) measurements were conducted with a potentiostat (Bio-logic, France).
DFT calculation: The binding energy of NaO2 to various substrates was calculated using the commercial cambridge sequential total energy package program in Material Studios. Generalized gradient approximation with the Perdew–Burke–Ermzerh of functional was adopted for the total energy calculations. The ultrasoft pseudopotential was used to treat core electrons. The energy cutoff was set to 550 eV. The vacuum region between slabs is 15 Å. The Brillouin zone of the surface unit cell was sampled by Monkhorst–Pack grids. The MP grids were set as 4 × 4 × 1 for all the surfaces and slabs, respectively.
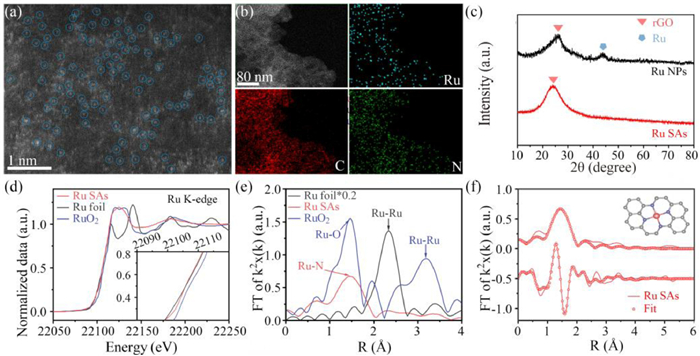
Fig. 2a presents the STEM image of Ru-SAs@N-rGO. The bright dots in the high angle annular dark field (HAADF) image have an average size of ~0.2 nm, indicating the uniformly distributed Ru SAs. The energy-dispersive X-ray spectroscopy (EDX) mapping images in Fig. 2b shows the uniform distribution of Ru, N and C elements in Ru-SAs@N-rGO, which can be further verified by SEM and EDX images in Figs. S1a-c (Supporting information). The XRD pattern of Ru-SAs@N-rGO in Fig. 2c shows only a broad peak around 26°, which results from rGO. In contrast, Ru-NPs@N-rGO shows an additional peak at 44°, which is ascribed to the (101) reflection of hexagonal Ru (JCPDF card No. 06-0663). As show in Fig. S1d (Supporting information), there are a large number of Ru nanoparticles loading on N-rGO, which can explain the source of diffraction peak in Ru-NPs@N-rGO. The uniform distribution of Ru in the HAADF-STEM image (Fig. 2a) and no observable Ru peaks in the XRD pattern (Fig. 2c) provide consistent evidence that confirms the formation of Ru SAs on N-rGO. To further study their coordination structure at the atomic scale, the X-ray absorption spectroscopy (XAS) measurements were conducted on Ru K-edge (Fig. 2d). The X-ray absorption near edge structure (XANES) spectra (Fig. 2e) show that the absorption edge of Ru-SAs@N-rGO resides between RuO2 and Ru Foil, indicating that the oxidation state of Ru is between Ru0 and Ru4+. Wavelet transform (WT) could be also used to investigate the Ru K-edge EXAFS oscillations of Ru-SAs@N-rGO and the references. As shown in Fig. S2 (Supporting information), there is one major intensity maximum of WT analysis in Ru-SAs@N-rGO shows at about 6.0 Å–1, which is very close to that in RuO2 (~6.2 Å–1), but distinct from the feature of Ru foil (10.0 Å–1). As shown in Fig. 2f, the Fourier transform (FT) of the extended XAS fine structure (EXAFS) curve of Ru-SAs@N-rGO shows one peak at 1.6 Å, which corresponds to the closest shell coordination of Ru-N bonds. For Ru foil and RuO2, there are distinct peaks at ~2.3 and 3.2 Å, which are attributed to the Ru-Ru coordination, respectively. No peaks at those positions rule out the presence of Ru nanoclusters and Ru oxides in Ru-SAs@N-rGO. The fitting results in Fig. 2f show that the main coordination peak is originated from Ru-N complexes in the form of Ru1-N4 configuration. The average Ru-N bond length is 2.07 Å, indicating that Ru SAs are coordinated with four adjacent N atoms in N-rGO. In conjunction with the above structure analyses, we may conclude that Ru SAs were successfully introduced into the N-rGO.
Figure 2
Figure 2.
Structural characterization of Ru-SAs@N-rGO: (a) HAADF-STEM image and (b) EDX mapping images of Ru-SAs@N-rGO. (c) XRD patterns of Ru-SAs@N-rGO and Ru-NPs@N-rGO. (d) Normalized K-edge XANES and (e) K-edge FT-EXAFS in R space for Ru-foil, RuO2 and Ru-SAs@N-rGO, respectively. (f) EXAFS fitting curves at R space for Ru-foil, RuO2 and Ru-SAs@N-rGO.
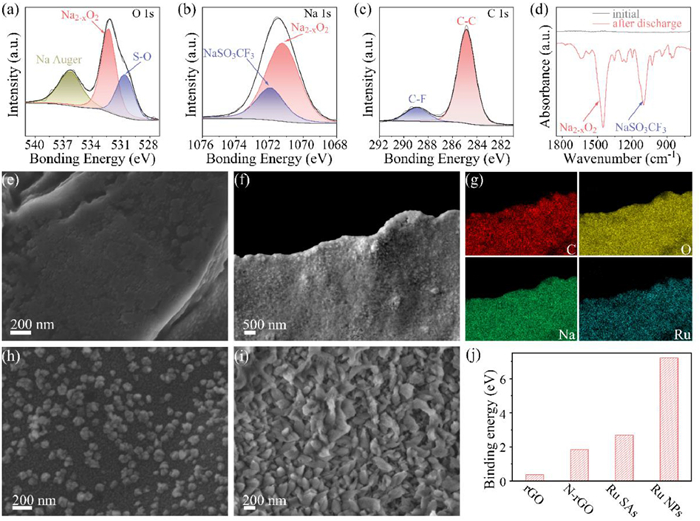
Figs. 3a-c show the XPS analysis of discharged cathodes. A broad peak of the O 1s signal between 528.00 eV and 534.00 eV in Fig. 3a could be fitted into two peaks at 530.60 and 532.35 eV, which are attributed to the S-O bonds in NaSO3CF3 [41] and the O-O bonds of Na2-xO2, respectively. A low amount of NaSO3CF3 mainly results from the electrolyte residual. Na2-xO2 was formed owing to the discharge reaction. The peak at 536.35 eV is originated from the Auger signal of Na [42]. The Na 1s spectrum (Fig. 3b) shows two peaks at 1071.75 and 1071.12 eV, which correspond to Na2-xO2 and NaSO3CF3, respectively [42]. The C 1s signals in Fig. 3c exhibits two peaks at 284.80 eV and 288.98 eV, which result from C-C bonds (carbon paper and N-rGO) [43] and C-F bonds in NaSO3CF3 [41], respectively. The Fourier transform infrared (FTIR) spectra in Fig. 3d confirm the presence of Na2-xO2 and NaSO3CF3 according to previous reports [17, 44]. Therefore, the spectroscopic analyses lead to the conclusion that a large amount of Na2-xO2 is formed in the cathode after discharge. Na2-xO2 as the main discharge product has a slightly higher potential via a two-electron reaction than NaO2via a single-electron reaction, showing higher energy density.
Figure 3
Figure 3.
XPS spectra of (a) O 1s, (b) Na 1s and (c) C 1s of cathodes after discharge. (d) FTIR spectra before and after discharge. SEM images of Ru-SAs@N-rGO after discharged at (e) 500 and (f) 5000 mAh/g. (g) EDX elemental mapping images of C, O, Na and Ru in (f). SEM images of Ru-NPs@N-rGO at (h) 500 and (i) 5000 mAh/g. (j) The binding energy of NaO2 with rGO, N-rGO, Ru-SAs@N-rGO and Ru-NPs@N-rGO.
To understand how catalysts affect the discharge process, we first discharged two Na-O2 batteries at low and high capacities (500 and 5000 mAh/g), respectively, and disassembled them to observe the morphology of discharged products. Fig. 3e presents the SEM image of Ru-SAs@N-rGO after discharge at 500 mAh/g. At such a low discharge capacity, the surface of Ru-SAs@N-rGO was evenly covered by fine nanoparticles without protrusions or aggregation, implying a surface-mediated mechanism. The discharge products generated at the early stage of discharge can be dissolved by the electrolyte owing to the relatively high solubility, which helps to transfer discharge products homogeneously inside the cathode through the electrolyte. Fig. 3f shows that at a high discharge capacity (5000 mAh/g), the Ru-SAs@N-rGO cathode was fully and evenly covered by discharge products, indicating a uniform co-deposition of superoxides, which is further confirmed by the uniform distribution of C, O, Na and Ru in Fig. 3g.
To study the reversibility of the discharge products, we recharged batteries to a cut-off voltage of 3.7 V and observed the cathode surface to see if the discharge products were decomposed. Fig. S3 (Supporting information) shows that the surface of Ru-SAs@N-rGO became smooth again after charge, indicating a reversible decomposition of the discharge products. Therefore, it can be concluded that Ru-SAs@N-rGO enables the Na-O2 reaction with excellent homogeneity and reversibility upon cycling.
Furthermore, we compared the discharge products of Ru-SAs@N-rGO with Ru-NPS@N-rGO. Figs. 3h and i show that Ru NPs induced island-like morphology of discharge products on N-rGO. A small amount of ultra-fine nanodots surround these islands. The deposition sites of discharge products at the initial stage are mainly determined by the accessibility of electrons, ions, catalytic sites. Given the poor electron conductivity of Na2-xO2, the further growth into bulk "islands" may proceed with a dissolution-and-deposition route (namely, the solution-mediated mechanism). Therefore, how the intermediate products interact with the surface plays a key role in the growth mode, which may further determine the overall electrochemical properties of Na-O2 batteries.
To further understand the interaction between intermediates and various surfaces, we calculated the adsorption property of the intermediate product on cathodes using the density functional theory (DFT). Previous reports argued that NaO2 is the intermediate product in Na-O2 batteries [45-47]. As the formation and transport of NaO2 determine the composition and morphology of the final discharge products in Na-O2 batteries, we calculated the adsorption energy of NaO2 on N-rGO and Ru-SAs@N-rGO. Following the modeling strategies in previous reports [48], we adopted the adsorption models of NaO2 (Fig. S4 in Supporting information) on various sites of N-rGO and Ru-SAs@N-rGO. Fig. 3j presents that the binding energy of NaO2 follows the trend, rGO < N-rGO < Ru-SAs@N-rGO < Ru-NPs@N-rGO. The optimized model in Fig. S4a shows that without Ru atoms, NaO2 is attracted to N atoms owing to the electrostatic interaction between N sites of N-rGO and Na of NaO2 (Fig. S4b). When Ru atom is anchored by four N atoms, Ru SAs serve as the active site to attract NaO2 (Fig. S4c) because Ru SAs can form a chemical bonding with O atoms of NaO2 (see the electron accumulation between Ru and O in Fig. S4d). The strong interaction between Ru and NaO2 could also be observed on the (001) surface of Ru NPs (Figs. S4e and f). The DFT modeling allows us to conclude that the adsorption between N-rGO and NaO2 is contributed by the relatively weak interaction between N and Na whereas strong chemisorption occurs between Ru and O.
The modeling results could assist in interpreting morphologic change in Figs. 3e-i. During discharge, the initial products would deposit around the catalytic sites if the surface of cathodes has a strong interaction with intermediate products, resulting in a surface-mediated route. Ru-SAs@N-rGO follows this model and shows the uniform deposition of Na2-xO2 as illustrated in Fig. 1b and shown in Fig. 3f. Such a uniform deposition may also reduce the local polarization so that the discharge products can be decomposed completely during recharge. For Ru-NPs@N-rGO, Ru-NPs have the strongest adsorption to intermediate products whereas N-rGO has relatively low binding energy. Under a similar Ru loading, the sample of Ru-NPs@N-rGO shows a non-uniform Ru distribution because of the large particle size of Ru NPs as compared to Ru SAs. The exposed N-rGO may not bind the intermediate products strongly and allow them dissolved in the electrolyte. As a result, the discharge products will accumulate towards Ru NPs and not deposit on N-rGO, leading to the island-like morphology (namely, solution-mediated mechanism). The dissolved intermediate may also migrate towards anodes and lower the discharge capacity and CEs. As the bulk island-like Na2-xO2 on Ru-NPs@N-rGO was formed via the dissolution-and-deposition instead of direct electrodeposition, a similar recharge process may encounter high resistance for electron and ion transfer. Fig. S5 (Supporting information) shows that after recharge, some residuals are not completely decomposed. Thus, a solution-mediated process should be avoided. Ru-SAs@N-rGO could realize the surface-mediated mechanism and demonstrate uniform discharge behavior with the expectation of long-term cyclability.
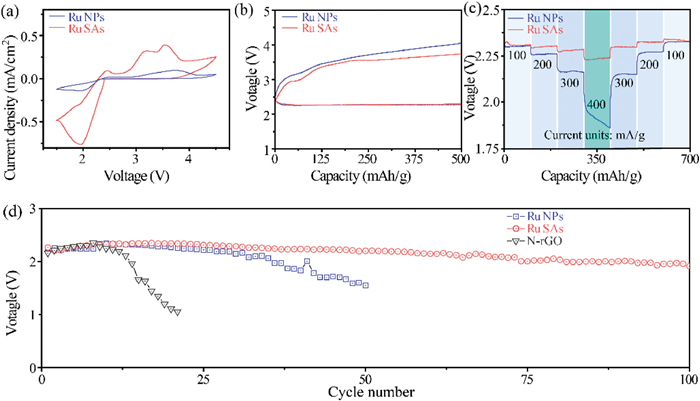
Fig. 4 shows the electrochemical properties of Na-O2 batteries using Ru-SAs@N-rGO, Ru-NPs@N-rGO and N-rGO as the cathodes, respectively. Ru-SAs@N-rGO exhibits a higher current response than Ru-NPs@N-rGO because almost all Ru atoms in Ru-SAs@N-rGO could act as the active center owing to the uniformly dispersed Ru SAs. In contrast, only the Ru atoms on the surface of Ru NPs have catalytic activity for the Ru-NPs@N-rGO cathode. Fig. 4b presents the discharge/charge profiles at 150 mA/g with a discharge capacity limit of 500 mAh/g. The discharge curves of Ru-SAs@N-rGO and Ru-NPs@N-rGO are overlapped at the same capacity. However, the that of Ru-NPs@N-rGO. Ru-SAs@N-rGO exhibits two voltage platforms at 2.9 V and 3.6 V, which correspond to the two peaks of CV curves in Fig. 4a, respectively. Such a double-stage decomposition process has been reported in some Na-O2 batteries which show Na2-xO2 as the discharge product [17]. Fig. S6 (Supporting information) shows that N-rGO has a much higher charge curve than Ru-SAs@N-rGO and Ru-NPs@N-rGO, indicating that the N-rGO does not lead to effective growth of products (Na2-xO2). The relatively high charge voltage for Ru-NPs@N-rGO may result from the inhomogeneity of discharge products. Fig. 4c presents the rate properties. With the increase of discharge current, the discharge voltage of Ru-SAs@N-rGO decreases slightly, indicating that Ru-SAs@N-rGO has good reaction kinetics. A high current density is highly related to the abundant active sites. In contrast, the discharge voltage of Ru-NPs@N-rGO decreases dramatically at high current density. Fig. 4d presents the cycling properties of Ru-SAs@N-rGO, Ru-NPs@N-rGO, and N-rGO with a capacity limit of 500 mAh/g. The average discharge voltages of N-rGO drop rapidly after about 10 cycles owing to a dramatically increased impedance. Ru NPs could improve the voltage retention for Ru-NPs@N-rGO. After 50 cycles, the voltage drops to 1.7 V. Ru SAs could stabilize the discharge voltage above 2.1 V more than 100 cycles for Ru-SAs@N-rGO.
Figure 4
Figure 4.
Electrochemical properties of Ru SAs and NPs. (a) The CV curves of Ru-SAs@N-rGO and Ru-NPs@N-rGO at 0.2 mV/s. (b) The charge/discharge profiles of Ru-SAs@N-rGO and Ru-NPs@N-rGO at 150 mA/g. (c) The rate performances of Ru-SAs@N-rGO and Ru-NPs@N-rGO. (d) Cycling properties of Ru-SAs@N-rGO and Ru-NPs@N-rGO at 150 mA/g.
Despite the catalytic activity of Ru, it should be noted that Ru NPs exhibit less exposure of active sites, leading to a weak overall activity as compared to Ru-SAs@N-rGO. As a result, the discharge products precipitate around Ru NPs and form an island-like deposition instead of a uniform coating like Ru-SAs@N-rGO. Such a mechanism in turn accelerates the deactivation of the Ru-NPs sites, leading to low cyclability and rate capability. Therefore, Ru SAs significantly improve the rate and cycling properties of Na-O2 batteries as compared to Ru NPs and/or N-rGO.
In summary, we developed an atomically dispersed Ru catalyst for Na-O2 batteries. The resultant Ru-SAs@N-rGO shows strong adsorption with the discharge intermediate, NaO2. The high binding energy inhibits the dissolution of NaO2 in the electrolyte, thereby suppressing the bulk growth of discharge products (Na2-xO2) through a solution-mediated mechanism that Ru nanoparticles usually follow. In stark contrast, Ru SAs enable a surface-mediated mechanism, which yields a uniform deposition of Na2-xO2 and reduces the local polarization. More importantly, the strong adsorption of NaO2 prevents its migration toward anodes. As a result, the charge voltage of Ru-SAs@N-rGO is maintained at 3.7 V. The average discharge voltage is higher than 2.1 V after 100 cycles. The atomically-dispersed Ru catalyst endows Na-O2 batteries with excellent electrochemical properties.
Declaration of competing interest
The authors declare that they have no known competing financial interests or personal relationships that could have appeared to influence the work reported in this paper.
Acknowledgments
The authors acknowledge the financial support of the National Natural Science Foundation of China (Nos. 22075131, 21776121) and National Key R & D Program of China (No. 2020YFA0406104). The numerical calculations were carried out at the computing facilities in the High-Performance Computing Center (HPCC) of Nanjing University.
Supplementary materials
Supplementary material associated with this article can be found, in the online version, at doi:10.1016/j.cclet.2021.06.090.
Figure 1
Schematic illustration of (a) the preparation procedure of Ru-SAs@N-rGO and Ru-N4 coordination structure; (b) Ru SAs induced a surface-mediated discharge through the strong adsorption of the intermediate NaO2; (c) The solution-mediated discharge leads to cubic morphology of bulk Na2-xO2 on Ru-NPs@N-rGO.
Figure 2
Structural characterization of Ru-SAs@N-rGO: (a) HAADF-STEM image and (b) EDX mapping images of Ru-SAs@N-rGO. (c) XRD patterns of Ru-SAs@N-rGO and Ru-NPs@N-rGO. (d) Normalized K-edge XANES and (e) K-edge FT-EXAFS in R space for Ru-foil, RuO2 and Ru-SAs@N-rGO, respectively. (f) EXAFS fitting curves at R space for Ru-foil, RuO2 and Ru-SAs@N-rGO.
Figure 3
XPS spectra of (a) O 1s, (b) Na 1s and (c) C 1s of cathodes after discharge. (d) FTIR spectra before and after discharge. SEM images of Ru-SAs@N-rGO after discharged at (e) 500 and (f) 5000 mAh/g. (g) EDX elemental mapping images of C, O, Na and Ru in (f). SEM images of Ru-NPs@N-rGO at (h) 500 and (i) 5000 mAh/g. (j) The binding energy of NaO2 with rGO, N-rGO, Ru-SAs@N-rGO and Ru-NPs@N-rGO.
Figure 4
Electrochemical properties of Ru SAs and NPs. (a) The CV curves of Ru-SAs@N-rGO and Ru-NPs@N-rGO at 0.2 mV/s. (b) The charge/discharge profiles of Ru-SAs@N-rGO and Ru-NPs@N-rGO at 150 mA/g. (c) The rate performances of Ru-SAs@N-rGO and Ru-NPs@N-rGO. (d) Cycling properties of Ru-SAs@N-rGO and Ru-NPs@N-rGO at 150 mA/g.

 DownLoad:

 下载:
下载:


