Guangzhou Key Laboratory of Environmental Catalysis and Pollution Control, Guangdong Key Laboratory of Environmental Catalysis and Health Risk Control, School of Environmental Science and Engineering, Institute of Environmental Health and Pollution Control, Guangdong University of Technology, Guangzhou 510006, China
Received Date:
23 March 2021 Accepted Date:
23 June 2021 Revised Date:
16 April 2021 Available Online:
15 January 2022
Abstract:
Explore the photo-piezoelectric synergistic micro-mechanism by density functional theory (DFT) calculations at the electronic and atomic level is important. In this work, to understand the synergistic mechanism, atomic and electronic properties of typical piezoelectric and photocatalytic material BaTiO3 were initially investigated with different strains. Subsequently, the adsorption of volatile organic compounds (VOCs) on the BaTiO3 (001) surface was determined during the piezoelectric process. In addition, the relationship between deformation ratio, the electronic structure and adsorption energy was understood in the deformation ratio range of 7%-12% for the optimal catalytic effect. The results of charge density differences and Born effective charge reveal the synergistic mechanism of piezoelectric photocatalysis. The built-in electric field formed by polarization results in the enhanced separation of charges, which makes the surface charges aggregation, enhancing the adsorption of VOCs, and benefiting the subsequent photocatalytic degradation. This work can provide significant theoretical guidance for the piezoelectric photocatalytic degradation of pollutants with the optimal strain range.
Volatile organic compounds (VOCs) are one type of the most toxic air pollutants in atmosphere [1, 2] and have been attracting intensive attention due to the serious threats to the ecological environment, the global climatic conditions and human health [3, 4]. The majority of emitted VOCs, such as aldehydes, polycyclic aromatic hydrocarbons (PAHs), alcohols and halohydrocarbons (e.g., HCHO, C6H6, CH3OH, C2HCl3) [5-8], are linked with the precursors to photo-chemical fumes and other environmental hazards. Therefore, considerable efforts have been made to remove VOCs before releasing to the environment.
Due to its excellent oxidation and purification capabilities, photocatalytic technology is considered as a highly promising and efficient procedures for VOCs elimination [9-11]. ZnO [12], g-C3N4/TiO2 [13], Au/TiO2 [14] and Fe doped WO3 [15] have been reported to degrade VOCs via ultraviolet irradiation. Although such systems have photocatalytic performance, unfortunately the rapid recombination of electron-hole pairs of the semiconductor photocatalysts results in a low photocatalytic efficiency for the practical removal of VOCs [16]. New technology is thus urgently required to overcome the shortcoming of the photogenerated carrier recombination during the photocatalytic reaction.
Numerous attempts have been made to improve the photocatalytic efficiency, including precious metals and aromatic compounds loading [17-19], heterojunctions and Z-scheme constructions [20] and material structure modifiers [21-23]. In addition to these methods, the piezoelectric effect has been explored to improve the charge separation [24]. Extensive research has been performed on the role of the polarization field in promoting the photocatalytic performance [25-27]. The piezoelectric catalytic degradation of organic pollutants under the action of ultrasound have extended the piezoelectric catalytic effects to the field of environmental purification [28, 29]. Piezo-photocatalytic effects to the system (e.g., ZnO nanowires [30], ZnSnO3 nanowires [31] and CuS/ZnO [32]) have demonstrated a favorable degradation efficiency of methylene blue (MB). The enhancement is mainly ascribed to the bending and polarization fields generated by alternating ultrasonic vibration, which can reduce the recombination of electrons and holes induced by photo irradiation and subsequently increase the mobility of these charge carriers. However, experimental results only revealed the improvement of the photocatalytic degradation of pollutants due to the piezoelectric effect, while the micro mechanism of the photo-piezoelectric synergistic degradation process remains unclear.
Recently, BTO (BaTiO3) has been widely used as a typical photo-piezoelectric material due to its high dielectric constant [33] and the appropriate energy band gap of 3.2 eV [34]. In addition, the BTO structure is highly sensitive to external deformation [35] due to the presence of the mixed ionic covalent chemical bonding for both of the Ba and O atoms and as well as the strong hybridization between the d and p states of the Ti and O atom, respectively. Therefore, BTO has significant piezoelectric effect. Li et al. developed a new hybrid photocatalyst by integrating BTO nanocrystals with Ag2O semiconductor nanoparticles [26]. In this hybrid photocatalyst, the piezoelectric effect was combined with photoelectric conversion for Rhodamine B degradation. However, the majority of the aforementioned studies focus solely on the modification of photocatalytic materials, while research on the mechanism underlying the photo-piezoelectric synergistic effect and the corresponding influencing factors is limited. Density functional theory (DFT) is an effective strategy for the deep exploration of the synergistic mechanism.
Piezoelectric polarization is sensitive to structure deformation/vibration and the adsorption process is extremely important during photocatalytic system. Therefore, in this study, the effect of BTO deformation on the change of electronic structure of tetragonal BTO crystal and the adsorption performance of BTO for typical VOCs were discussed by DFT calculation. We first investigated the relationship between the structural parameter variations and the polarization degree and subsequently predicted the strain ratio with respect to the photocatalytic performance. Therefore, the adsorption of several typical VOCs species on the BTO (001) surface was calculated and the optimal strain ratio for the photo-piezoelectric synergistic effect was identified. Results revealed the relationship between the deformation of BTO and the adsorption performance, therefore providing theoretical guidance for the optimum strain range of piezoelectric materials during the photo-piezoelectric synergistic process.
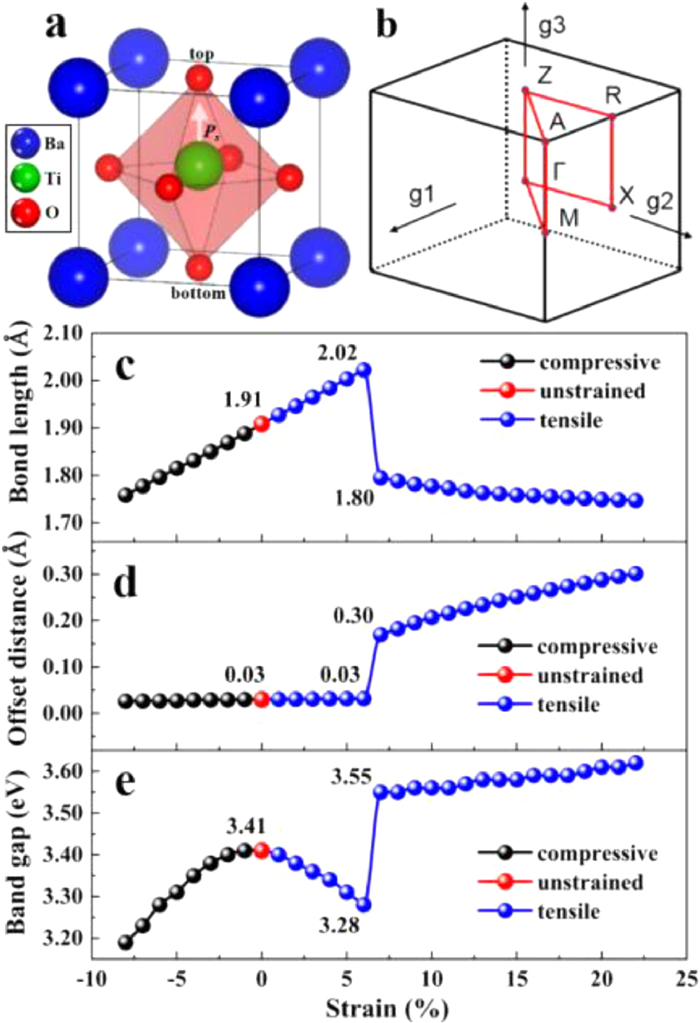
The calculation details are shown in Text S1 (Supporting information). The BTO unit was optimized via the hybrid Heyd-Scuseria-Ernzerhof (HSE06) functional, with optimized lattice constants of a = b = 3.83 Å and c = 3.82 Å. This agrees well with the experimental data a = b = 3.95 Å and c = 3.96 Å [36]. Fig. 1a presents the crystal structure of BTO, where the blue, green and red spheres represent Ba, Ti and O atoms, respectively. The BTO crystal phase is a regular oxygen octahedral structure, in which the titanium is located approximately in the center of the oxygen octahedron structure. Previous work has demonstrated that the off-centering displacement of Ti4+ cation within the oxygen octahedral results in the spontaneous polarization along the (001) axis [37]. This indicates that deformations in this direction would produce potential differences. Thus, we focused on the variation of (001) direction bond length with different strain ratio. The unstrained bond length of Ti−O (top) and Ti−O (bottom) in BTO were 1.91 Å and 1.92 Å, respectively. Fig. 1b depicts the Brillouin region of the optimized BTO structure with its reciprocal lattice as pseudopotential. From this, we can determine the path along high symmetry directions in the reciprocal lattice for the following band structure calculations, which is consistent with previous study [38].
Figure 1
Figure 1.
(a) Crystal structure of the perovskite BaTiO3. Blue, green, and red spheres represent barium, titanium and oxygen atoms, respectively. The white arrow indicates the direction of polarization Ps. (b) Corresponding first Brillouin zone and the selected high-symmetry k-points as marked. Variations in (c) the bond length of Ti−Otop, (d) the offset distance of the central Ti atom, and (e) the band gap (Eg) under different strain ratios.
Thus, we have identified that the polarization direction is along the (001) axis in BTO. This indicates that the shift of the Ti ion would affect the degree of polarization. Fig. 1c presents the trend in Ti−Otop bonding length variations in the BTO structure with respect to the deformation ratio. The strain range is determined by the sum of radii of Ti and O ions [39]. The distance of the Ti−Otop bonding length is defined as dTi-O, while the red dot represents the distance of dTi-O without strain. dTi-O decreases gradually as the compression increases, indicating the gradual increase of the Ti−Otop bond strength. In contrast, an increase in tension would elongate dTi-O, while dTi-O reaches the maximum (dTi-O = 2.02 Å) when the tension equals 6%. The tension strain continues to increase and the bond length exhibits a rapid drop to 1.80 Å when the tensile strain ratio increases from 6% to 7%. After checking the BTO structure, it is found that the Ti is away from the central site. Further increase in the tension results in very slow reduction of dTi-O. Prior to reaching dTi-O peak at the tensile strain of 6%, dTi-O length is observed to be proportional to the strain ratio. The results show that the tensile strain would induce the Ti atoms to shift away from the center along the polarization direction.
To assess the effect of strain on the electronic structure of BTO and understand the corresponding photo-response properties, the band gap of BTO with different strain ratios was calculated and shown in Fig. 1e. The band gap exhibits gradual decrease as the compressive strain ratio changing from 0% to 8%. This agrees with the trend of the bond length variation. The variation in the band gap contrasts to that of the Ti-Otop bond length under tensile strain, where band gap decreases first along a curve and jumps high sharply at the same points (6% to 7%) under tensile strain, then increases slightly and linearly.
Figs. S1a-d (Supporting information) present four typical points in order to further understand the band structure. The band gap of the BTO without strain is 3.41 eV (Fig. S1a) with an indirect band gap, while the conduction band minimum (CBM) and the valence band maximum (VBM) are respectively located at Γ and A points. The HSE calculation result agrees well with the experimental band gap 3.2 eV [34]. At the compression ratio of 8%, the band gap decreases to 3.19 eV, mimicking the trend of dTi-O. Compared to the system without strain, the band gap decreases due to the overall downward shift of the conduction band electron energy level under the compressive strain. Similar to the compression trend, slight band gap decrease is observed prior to the 6% tensile ratio. This contrasts with the slight increase trend of dTi-O. Figs S1c and d indicate an abrupt increase in the band gap for the enhanced conduction band energy, attributed to the center site charge transfer induced by polarization under tensile strain. The band structure results suggest the ability of the piezoelectric process to slightly adjust the band gap.
To better understand the piezo-photocatalysis mechanism and the contribution of different elements of BTO in the photocatalysis, we investigated the partial density of states (PDOS) of the tension catastrophe point (6%−7%) (Figs. S2a and b in Supporting information). The BTO valence band generally consists of O 2p states as well as a small contribution from the Ti 3d states, while the dominant influences of CBM are the Ti 3d states with a marginal contribution of the O 2p states, consistent with previous research [40]. A strong interaction is present between the O 2p and Ti 3d states, indicating that the Ti−O bonding is covalent. The electronic transition near the Fermi surface determines the optical properties of the material. Therefore, octahedral oxygen is likely to be the decisive origin of the BTO electron transitions as the VBM is largely influenced by oxygen. The increase in the band gap with tensive strain from 6% to 7% is attributed to the localization of the 3d orbit, while the CBM shifts to the right energy level. Figs. S2c and d (Supporting information) show the PDOS of BaTiO3 without strain and 8% compressive strain. In contrast to Fig. S2c, the electrons located at the O 2p orbital near the VBM in Fig. S2d are partially transferred, while the Ti 3d orbital near CBM becomes more delocalized. This results in a wider band and a smaller band gap. The density states of the Ti 3d orbital are much higher than that of O 2p, and thus the electrons in the O atom are transferred from the valence band (VB) to the conduction band (CB) by hybridization with the Ti 3d orbital.
In addition, as discussed in Fig. 1c, the distance of the central Ti atom shifts away from the center along the polarization direction as the strain ratio varies. It is known that the shift is lager the polarization is more significant [41]. As shown in Fig. 1d, the offset distance is ignorable under compressive strain and tensile strain below 6%. Then it suddenly jumps to 0.30 Å at the tensile strain ratio of 6%−7%, then it continues to increase gradually and linearly. In other words, polarization is ignorable under compressive strain and tensile strain below 6%, and the polarization is present only at the tensile strain above 7%. It is known that polarization would form a stronger internal electric field and thus inducing charge separation and accumulation under the tensile strain. Therefore, the internal electric field would alert the photo generated electrons-hole separation and recombination, thus tuning the photocatalytic performance.
The piezoelectric potential of piezoelectric materials is enhanced by applied stress, which changes the charge distribution [42]. The adsorption performance of the catalyst material has strong influence on the photocatalytic properties, and thus plays a significant role in the photocatalytic degradation of VOCs. Various types of VOCs exist in the environment, including acetone, ethanol, methanol, formaldehyde, toluene, etc. The most common and toxic VOCs (formaldehyde and acetone) and involved reactive oxygen species (oxygen and hydroxyl) were examined in our work. As the piezoelectric polarization direction of BTO is generally along the (001) direction, the BTO (001) surface was employed as the adsorption surface. The (001) surface has two different types terminated surfaces: BaO- and TiO2-terminated surfaces, both of which were considered. The BaO-terminated surface was more stable based on the surface energy stability calculations. Three adsorption sites on the BaO-terminated surface of BTO were considered and their adsorption energies were compared. Fig. S3 (Supporting information) depicts the three adsorption sites, the O atom (O1) located at the center of the square, the Ba atom located at the top site of the square, and the O atom (O2) located at the right vertex of the triangle, labeled 1, 2, and 3 respectively. The geometry and energetics of the adsorption systems on the BTO surfaces were calculated and analyzed, particularly focus on the trend in adsorption variations under different strain ratio. Note that new O-Ba bonds may be formed in the adsorption system due to the electronegativity of the oxygen atoms and the surface Ba atoms.
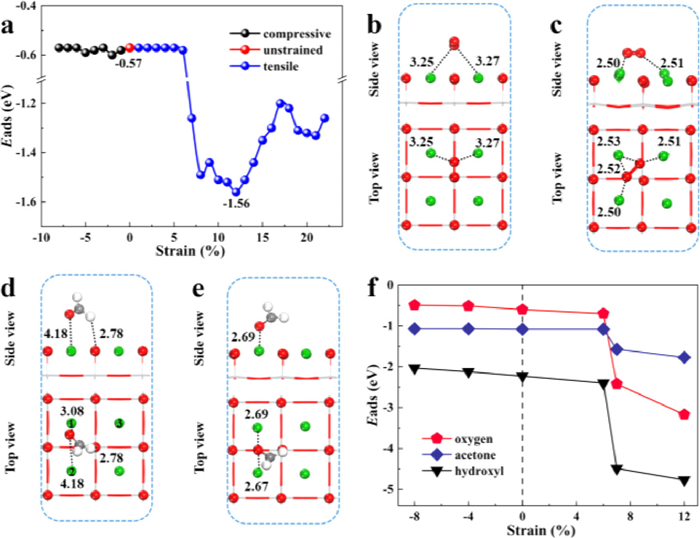
In order to clarify the effect of piezoelectricity on the adsorption energy, we first investigated the adsorption changes of formaldehyde at different strains (Fig. 2a). For the compressive strain, the adsorption energy of the formaldehyde molecules did not change much (−0.60 eV to −0.57 eV), which is consistent with the Ti−Otop bond length change (Fig. 1c). For the tensile strain process, the adsorption energy remains unchanged prior to the mutation point of 6% tensive strain, and exhibits sharp rise between 6% (−0.57 eV) and 7% (−1.26 eV). This agrees with the Eg and dTi-O trends. The similarities in trends suggests that there may exist a correlation between the bond length, band gap and adsorption energy. The adsorption energy subsequently increases with the tensile strength and the most favorable tensile strain ratio range for adsorption improvement is identified as 7%−12%, with a maximum adsorption energy of −1.56 eV at 12% tension strain. Thus, the formaldehyde adsorption energy is sensitive to the structure strain of BTO within a certain range (after 7%).
Figure 2
Figure 2.
Most stable adsorption conformations of formaldehyde on BaTiO3 surfaces, (a) without strain and (b) 12% tensile strain. Oxygen adsorption on BaTiO3 surfaces, (c) without strain and (d) 12% tensile strain. (e) Adsorption energy of formaldehyde on BaTiO3 (001) as a function of the applied strain (with a step size of 1%); (f) oxygen, acetone and hydroxyl adsorption energies on the BTO surface with different strains.
In order to further explore the relationships between adsorption energy and structure strain, we identified the most stable formaldehyde structures adsorbed on the BTO (001) surface at 0% and 12% tensions (Figs. 2b and c). The distance between the formaldehyde O atom and the Ba1/Ba2 of the surface is 3.08 Å/4.18 Å (Fig. 2b). The Ba1, Ba2 and Ba3 sites are marked in the top view. The formaldehyde O atom is observed to be more inclined to interact with the Ba1 atom on the surface, with an interaction intensity of −0.57 eV. At the tension of 12%, the formaldehyde O atom is centered between the two Ba atoms while the distances of O−Ba1 and O−Ba2 are reduced to 2.67 Å and 2.69 Å, respectively (Fig. 2c), compared with the 0% tension. The adsorption performance of formaldehyde under tensile strain exhibits a marked improvement to −1.56 eV compared to the unstrained performance. The enhanced adsorption can be attributed to the built-in electric field formed by the piezoelectric effect, which greatly enhances the directional separation charge during photocatalysis. The directional separation of charges makes it aggregate on the surface, while the enhanced surface piezoelectric potential facilitates the adsorption of the molecules on the surface, thus increasing the adsorption energy.
Typical strain ratios (−8%, −4%, 6%, 7% and 12%) were selected based on the formaldehyde adsorption trend to investigate the adsorption of O2, C3H6O and •OH on the BTO surface. Figs. 2d and e depict the most stable structures of O2 adsorption on the BTO (001) surface. The O (OA) atom of O2 is located at the Ba1-Ba3 atom bridge from the side view and the distances of OA−Ba1 and OA−Ba3 are determined as 3.25 Å and 3.27 Å, respectively (Fig. 2d). The O2 is parallel to the BTO surface, while the OA of O2 is typically adsorbed between the Ba1 and Ba3 surface, with an adsorption energy of −0.60 eV. Compared with the adsorption structure on the unstrained surfaces, the O2 under the tensile strain (12% ratio) is closer to the surface, with the distances of OA−Ba1 and OA−Ba3 reduced to 2.53 Å and 2.51 Å, respectively (Fig. 2e). The top view of Fig. 2e indicates that the O2 rotates clockwise approx. 45°, while the oxygen OA remains at the center of the two Ba atoms with an adsorption energy of −3.17 eV. Thus, the adsorption performance of oxygen is significantly improved under tensile strain. Fig. 2f depicts the adsorption energy of hydroxyl and acetone at different strain ratios, demonstrating similar energy trends to those of oxygen and formaldehyde. The adsorption energy values of hydroxyl and acetone on the unstrained BTO system are determined as −2.23 eV and −1.08 eV, respectively. The adsorption energy of these molecules on the BTO remains almost unchanged prior to the tension of 6%. However, when the tensile strain ratio reaches 7%, the adsorption of all these molecules is enhanced, while the adsorption energy mutation points remain unchanged. Table S1 and Fig. S4 (Supporting information) present the corresponding adsorption energies and configurations, respectively. The results demonstrate the improvements in the adsorption of the HCHO, O2, C3H6O and •OH molecules on the BTO surface can be improved within a certain strain range, which provides a perfect prerequisite for the subsequent photocatalytic systems.
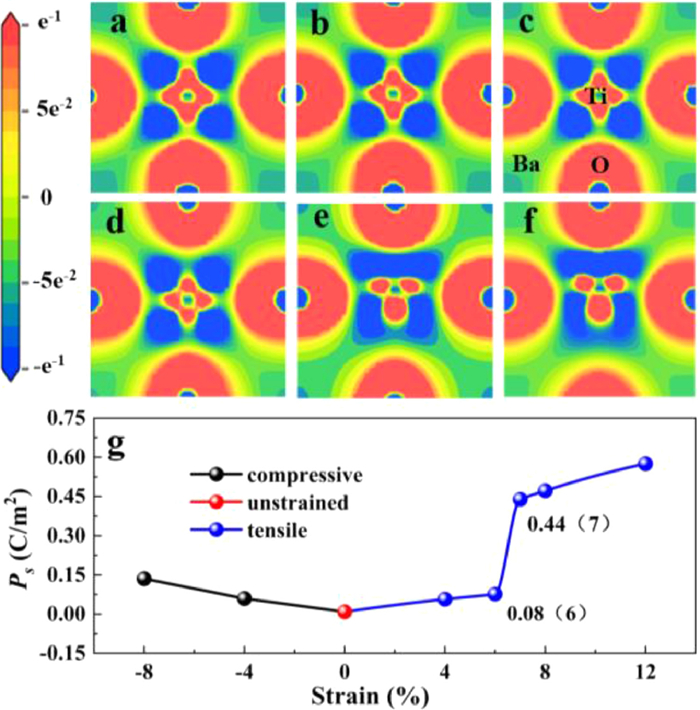
To further illustrate the mechanisms underlying the piezoelectricity-induced photocatalytic electron-hole pair separation and the variations in the VOCs adsorption caused by the applied strain, we calculated the charge density differences of the BTO substrate along the (001) axis under strain (Figs. 3a-f). The isosurface of electron density differences in the BTO is also shown. Blue indicates electron lost while red indicates electrons captured. The charge distribution around the Ti and Ba sites generally indicate covalent and ionic Ti-O and Ba-O bonds. By considering the crystal symmetry of the BTO with tetragonal (P4mm) structures, Fig. 3c marks the corresponding atoms on the electron charge density contour map. No significant changes in the charge density difference are observed during the compression process. At the tensile strain ratio of 6%, the charge density remains unchanged. Unexpectedly, an obvious charge transfer occurs when the tensile ratio increases to 7% (Fig. 3e). The surface O (central Ti) atom gains (losses) more electrons, which is consistent with the polarization direction and adsorption trend. This proves that the built-in electric field formed by the piezoelectric effect greatly enhances the charge directional separation during the photocatalysis process. When the tensile strain is increased to 12%, a greater amount of charge is accumulated on the surface. Therefore, tensile strain values from 7% to 12% significantly influences the electron distribution, enhancing the separation of the electron hole pairs and the adsorption of VOCs in the photocatalytic process.
Figure 3
Figure 3.
Isosurface of BaTiO3 electron density differences under (a) 8% compressive strain, (b) 4% compressive strain, (c) without strain, (d) 6% tensile strain, (e) 7% tensile strain and (f) 12% tensile strain. Electron accumulation and depletion areas are shown in red and blue, respectively. (g) The BaTiO3 spontaneous polarization intensity under different strain ratios.
To quantitatively shed light on the relationship between the polarization intensity and adsorption energy in the photo-piezoelectric process, the Born effective charge tensors (BECs) of BTO in its P4mm phase were determined via the DFT method to estimate polarization Ps. No obvious changes in spontaneous polarization are observed under compressive strain (Fig. 3f). Under the tensile strain condition, the spontaneous polarization increases from the 6% (0.08 C/m2) to 7% (0.44 C/m2) strain. This is consistent with the changes in bond length, band gap and adsorption energy, and further confirmed the enhancement of the built-in electric field. Thus, there is an obvious polarization enhancement during the tension process from the 7% to 12% strain, hence enhancing the built-in electric field to promote the charge separation during photocatalysis.
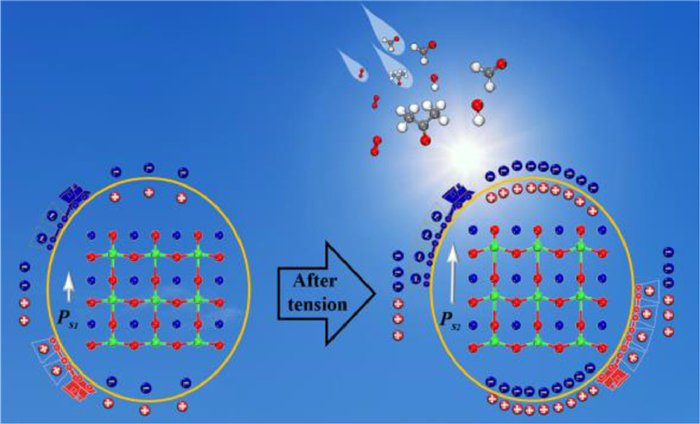
Fig. 4 depicts the photo-piezoelectric synergistic mechanism based on the above results. With tensile strain, the center Ti atom shifts upward, and the dipole moment of the positive and negative center charges increases. This consequently enhances the piezoelectric polarization of BTO and forms a stronger built-in electric field to promote more electrons and holes to move in the opposite direction. This forms a large number of charges on the BTO surface, facilitating the adsorption of the molecules on the surface, thus improving the photocatalytic efficiency.
Figure 4
Figure 4.
Photo-piezoelectric synergistic degradation mechanism of the VOCs on tensile strained BaTiO3.
In this work, a series of strain ratios of BTO were applied to simulate the piezoelectric process through DFT calculations. The atomic and electronic structure changes were initially investigated during the piezoelectric process. The change trend of dTi-O and the band gap was consistent in the compression condition and opposing under tension. A turning point was observed between 6% and 7%. Adsorption is a precondition for the photocatalytic degradation of pollutants, and therefore the adsorption process of the VOCs on the BTO (001) surface was evaluated with different applied strains. The results indicated the optimum strain ratio of the piezo-photocatalysis for formaldehyde adsorption to be 7%−12%. Oxygen, acetone and hydroxyl adsorption exhibited the same optimal strain range. In addition, the charge density differences and BECs, and the charge transfer and spontaneous polarization changes in the piezoelectric strain process were also analyzed. The mechanism underlying the charge separation induced by the enhancement of the built-in electric field formed by polarization in the piezoelectric photocatalysis was revealed. In addition, the relationship between strain intensity, the electronic structure and adsorption energy was further constructed to determine the strain intensity range for the optimal catalytic effect. Our work can provide theoretical guidance for the design of the piezo-photocatalytic degradation of pollutants.
Declaration of competing interest
The authors declare that they have no known competing financial interests or personal relationships that could have appeared to influence the work reported in this paper.
Acknowledgments
This work was supported by the National Natural Science Foundation of China (Nos. 21777033 and 22006023), Natural Science Foundation of Guangdong Province (No. 2019A1515010428), Local Innovative and Research Teams Project of Guangdong Pearl River Talents Program (No. 2017BT01Z032), and the Innovation Team Project of Guangdong Provincial Department of Education (No. 2017KCXTD012).
Supplementary materials
Supplementary material associated with this article can be found, in the online version, at doi:10.1016/j.cclet.2021.06.059.
Figure 1
(a) Crystal structure of the perovskite BaTiO3. Blue, green, and red spheres represent barium, titanium and oxygen atoms, respectively. The white arrow indicates the direction of polarization Ps. (b) Corresponding first Brillouin zone and the selected high-symmetry k-points as marked. Variations in (c) the bond length of Ti−Otop, (d) the offset distance of the central Ti atom, and (e) the band gap (Eg) under different strain ratios.
Figure 2
Most stable adsorption conformations of formaldehyde on BaTiO3 surfaces, (a) without strain and (b) 12% tensile strain. Oxygen adsorption on BaTiO3 surfaces, (c) without strain and (d) 12% tensile strain. (e) Adsorption energy of formaldehyde on BaTiO3 (001) as a function of the applied strain (with a step size of 1%); (f) oxygen, acetone and hydroxyl adsorption energies on the BTO surface with different strains.
Figure 3
Isosurface of BaTiO3 electron density differences under (a) 8% compressive strain, (b) 4% compressive strain, (c) without strain, (d) 6% tensile strain, (e) 7% tensile strain and (f) 12% tensile strain. Electron accumulation and depletion areas are shown in red and blue, respectively. (g) The BaTiO3 spontaneous polarization intensity under different strain ratios.

 DownLoad:

 下载:
下载:


