Figure 1.
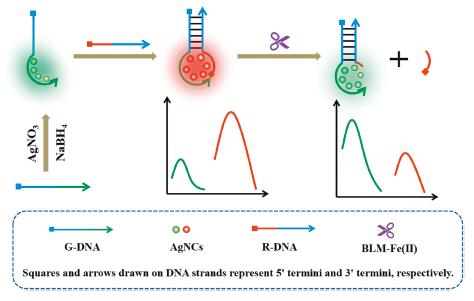
Schematic illustration of the ratiometric fluorescence detection of BLM based on G-DNA-AgNCs.
Ratiometric fluorescence detection of bleomycin based on proximity-dependent fluorescence conversion of DNA-templated silver nanoclusters
Lingyuan Liu , Shuyun Zhu , Jing Sun , Meng Xia , Xian'en Zhao , Guobao Xu

DNA-templated silver nanoclusters (DNA-AgNCs) are a new kind of fluorescent nanomaterial prepared through NaBH4-mediated reduction of Ag+ in the presence of oligonucleotides [1, 2]. Particularly, their fluorescence properties are highly sensitive to the sequences of templates. DNA-AgNCs with tunable fluorescence emission ranging from 400−900 nm can be obtained by simply designing the template sequences without the complicated covalent labeling of different dyes/materials [3]. Due to their controllable fluorescence properties and simplicity of preparation, DNA-AgNCs have been applied in target detection, bioimaging and biosensing [4, 5].
More interestingly, DNA-AgNCs exhibit proximity-dependent properties. For example, Yeh's group discovered that the proximity to G-rich DNA increased the fluorescence intensity of DNA-AgNCs by ~500-fold [6]. Based on the target-adjustable distance between the dark DNA-AgNCs and G-rich DNA, various proximity-dependent biosensors have been designed for detection of DNA, miRNA, ATP, enzymes, antitumor drugs and etc. [7-11]. Ye's group found a stronger fluorescence enhancement up to ~1500-fold when two different dark DNA-AgNCs were in proximity to each other through the complementary hybridization [12]. Some nanoassays for DNA, Zr4+, and ATP have been developed based on such novel DNA-AgNCs [13, 14]. They found that two DNA-AgNCs with the same templates also displayed a bright emission when they were placed together [15]. Nevertheless, these strategies are based on single-wavelength measurement through "turn-on" or "turn-off" mode, which usually suffer from the inevitable interference from instruments or environment. Thus, the reliability of the measured results would be degraded.
Ratiometric fluorescent strategies, which permit simultaneous measuring the relative fluorescence values of two well-separated wavelengths, can effectively solve the above problem [16-18]. Compared with single signal output, the ratiometric fluorescence biosensors have achieved improved sensitivity and accuracy. Thus, it is necessary to design DNA-AgNC-based ratiometric fluorescence biosensors. Nevertheless, the research in this field is still in its infancy [19, 20]. There are even fewer reports about ratiometric fluorescence biosensors by using proximity-dependent DNA-AgNCs. Yang's group designed a hairpin shape DNA with two different templates at two terminals to synthesize DNA-AgNCs. The red fluorescence transforms to yellow when the two DNA-AgNCs are separate from each other. In combination with the DNAzyme-assisted cascade amplification, this ratiometric probe is used for DNA detection [21]. Li's group discovered that the proximity of a special sequence (5′-CACCGCT-T-3′) can convert green-emissive AgNCs into red-emissive DNA-AgNCs [22]. Based on this finding, a sensitive ratiometric DNA biosensor based on the hybridization proximity mode has been designed combined with catalyzed-hairpin-assembly amplification strategy [23]. Moreover, a ratiometric fluorescence assay for Pb2+ has been developed with target-induced emission conversion of DNA-AgNCs in combination with the Pb2+-dependent DNAzyme [24]. Such novel DNA-AgNCs advocates new opportunities for ratiometric biosensing. However, the design of such ratiometric probe based on target-induced emission conversion remains scare.
As a glycopeptide-derived antibiotic, bleomycin (BLM) plays an important role in the cancer therapy [25]. The activated metal-bound BLM can selectively degrade DNA at 5′-GC/T-3′ site [26, 27]. Various single signal fluorescence strategies have been developed to detect BLM based on the scission ability of BLM towards DNA [28-32]. There are few reports about ratiometric fluorescence detection of BLM. Su's group developed a ratiometric fluorescence assay for BLM based on dual-emission nitrogen-doped graphene quantum dots@gold nanoclusters assembly [33]. It is worth noting that this ratiometric probe requires two fluorescent nanomaterials, which undoubtedly make preparation complicated and operation difficult. A single nanoprobe with dual emission would be an instructive alternative for establishing a simple ratiometric sensing system.
In this study, a novel ratiometric strategy was designed for sensitive fluorescence detection of BLM based on proximity-dependent fluorescence transformation of DNA-AgNCs for the first time. Fig. 1 schematically depicts the working principle of this ratiometric assay. This sensing platform is constructed by the hybridization of G-DNA and R-DNA, both of which contains two segments. The 3′-end of G-DNA (5′-T3-TTTTGCCTTTTGGGGACGGATA-3′) acts as the template to synthesize AgNCs with green fluorescence emission at 595 nm (G-DNA-AgNCs). The 5′-end of R-DNA (5′-CACCGCT-T-3′) acts as a convert DNA. The left segments of both G-DNA and R-DNA can hybridize with each other. The hybridization can bring the convert DNA in proximity to the G-DNA-AgNCs to generate dsDNA-AgNCs. The dsDNA-AgNCs exhibits strong emission at 680 nm. The spatial proximity between the convertor sequence and G-DNA-AgNCs converts the green fluorescence emission into red fluorescence. Meanwhile, the convert DNA can be cleaved into two segments by BLM-Fe(II) complex because it contains the cleavage site of BLM. Thus, the proximity of convert DNA to G-DNA-AgNCs can be prevented, resulting in the decrease of red fluorescence intensities along with the increase of green ones. With the fluorescence intensity ratio F680/F595 as output signal, a ratiometric fluorescence sensor for BLM is proposed.
The G-DNA-AgNCs were synthesized according to the reported method with a slight modification [23]. The preparation process of the G-DNA-AgNCs and the detection procedures of BLM can be found in Supporting Information. The transformation electron microscopy (TEM) images of G-DNA-AgNCs were shown in Fig. S1 (Supporting information). The morphology is mainly spherical and the average diameters are about 5.0 nm (Fig. S1A). The high-magnification image shows that they are well-separated from each other (Fig. S1B). An absorption peak at about 3 keV in energy dispersive spectroscopy (EDS) indicates the generation of metallic AgNCs [34] (Fig. S1C). The UV–vis spectrum of G-DNA-AgNCs shows that there are three absorption peaks at 395 nm, 428 nm, and 482 nm, respectively (blue curve, Fig. S1D). There is a maximum emission peak at 595 nm only when excited at 489 nm due to the Stokes shift (black and red curves, Fig. S1D). In contrast, the maximum emission peak of dsDNA-AgNCs locates at 680 nm when excited at 574 nm (Fig. S2 in Supporting information).
Experiments were carried out to study the feasibility of this ratiometric strategy for BLM detection. The G-DNA-AgNCs shows a strong fluorescence emission at 595 nm (Fig. 2A). After hybridization with R-DNA, the maximum fluorescence emission peak shifts to 680 nm. Upon addition of BLM-Fe(II) complex, the fluorescence intensity at 680 nm decreases while that at 595 nm increases. Accordingly, the fluorescence intensity ratio F680/F595 decreases obviously. In contrast, either BLM or Fe(II) does not induce the obvious changes of fluorescence intensity ratio F680/F595. Therefore, the fluorescence conversion of G-DNA-AgNCs can be used for ratiometric detection of BLM.
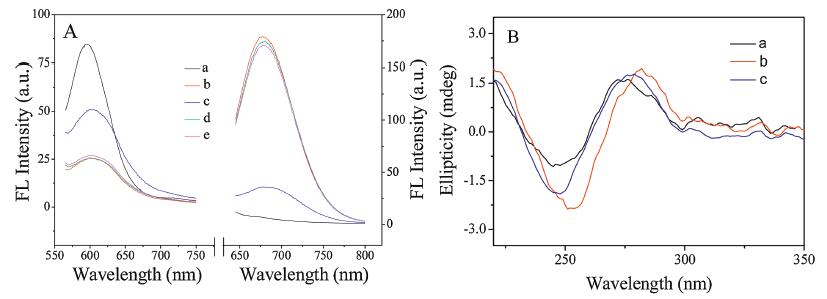
Circular dichroism (CD) spectra were used to investigate the secondary structure changes of G-DNA-AgNCs during the process of hybridization and target addition. As shown in Fig. 2B, a positive peak at 273 nm and a negative peak at 245 nm are referred to the single stranded G-DNA-AgNCs [35]. After hybridization with R-DNA, a red-shift of negative peak to 252 nm and a decrease in intensity was observed along with a red-shift of the positive peak to 283 nm and a remarkable increase in intensity. The results indicate that G-DNA-AgNCs form an analogous hairpin structure in the presence of R-DNA [36]. When BLM-Fe(II) complex is present, the negative peak shifts from 252 nm to 246 nm and the positive peak shifts from 283 nm to 277 nm, indicating the formation a typical DNA duplex [37]. The convert DNA can be cleaved by BLM-Fe(II), inhibiting the formation of an analogous hairpin structure.
Experimental results showed that the responses of this ratiometric strategy towards BLM was dependent on reaction time, the molar ratio of G-DNA to R-DNA, metal ions, and the ratio of BLM to Fe(II). The optimal experimental conditions were as shown in Fig. S3 (Supporting information).
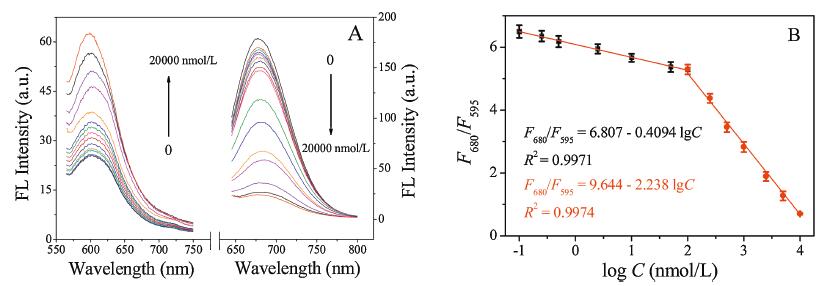
Under the optimal conditions, the analytical performance of this ratiometric system for BLM was explored with the results shown in Fig. 3. With the increasing concentration of BLM, the fluorescence intensities at 680 nm and 595 nm decrease and increase simultaneously. The fluorescence ratios F680/F595 decrease obviously along with the increasing BLM concentrations. Two linear relationships are found in the concentration ranging from 0.1 nmol/L to 100 nmol/L and 100−10000 nmol/L. The regression equation is F680/F595=6.807−0.4094lgC (R2 = 0.9971) and F680/F595=9.644−2.238lgC (R2 = 0.9974), respectively. The detection limit is calculated to be 30 pmol/L based on 3 Sb/slope.
Comparison of different fluorescent probes for the detection of BLM is listed in Table S1 (Supporting information). It can be seen that this ratiometric strategy possesses a wider linear range and the detection limit is 3 orders of magnitude better than that of "turn-off" strategy based on DNA-AgNCs. However, in comparison with those of reported methods based on other fluorescent probes, the detection limit of this ratiometric strategy is almost 1 order of magnitude better. The remarkably improved sensitivity is ascribed to the ratiometric responses, which eliminates system errors and reduce the influence of solution background. It is worth of noting that the presented ratiometric nanoprobe is one fluorophore with dual fluorescence emission, which is simpler and more cost-effective than those with two kinds of nanomaterials.
The selectivity of this assay was conducted with the results shown in Fig. S4 (Supporting information). It can be seen that BLM induces an obvious decrease in fluorescence intensity ratio F680/F595. In contrast, other antibiotics even with high concentration up to 10 μmol/L cannot induce the obvious changes for fluorescence intensity ratio F680/F595. These results indicate that this method exhibits a high selectivity, which is mainly ascribed to BLM-induced irreversible cleavage towards DNA.
To confirm the validity of this ratiometric method for the real sample analysis, BLM in human serum samples were detected. Fig. S5 (Supporting information) shows the analysis results of this method in the presence of various concentrations of BLM in serum samples. As the concentrations of BLM increase from 0 nmol/L to 9000 nmol/L, the fluorescence intensities at 680 nm decrease gradually while the fluorescence intensities at 595 nm increase gradually. Two linear relationships are found in the concentration ranging from 2.5 nmol/L to 100 nmol/L and 100−9000 nmol/L. The regression equation is F680/F595=5.73−0.340lgC (R2 = 0.997) and F680/F595=9.50−2.21lgC (R2 = 0.993), respectively. A similar linear relationship is obtained in comparison with that obtained in buffer, indicating that the application feasibility of this method in biological samples.
This ratiometric method was also applied to detect BLM in the commercially available BLM hydrochloride for injection. A certain amount of BLM was dissolved with 20 mmol/L NaAc solution to obtain 200 μmol/L stock solution followed by analysis with this method. The measured concentration with this method was 480 nmol/L, which was well matching the corresponding actual BLM content (500 nmol/L). Three known amounts of standard BLM were added into the real samples and the analysis results were shown in Table S2 (Supporting information). The recoveries in the range of 93.0%–97.6% were obtained, indicating this method is promising in accurate measurement of BLM in injection.
In summary, we have developed a ratiometric fluorescence sensing system for BLM based on proximity-dependent fluorescence transformation of DNA-AgNCs. Due to the irreversible scission of convert DNA by BLM, the DNA-AgNCs present distinct discoloration from red to green. This ratiometric sensor exhibits high sensitivity for BLM. The recognition DNA cleavage of BLM makes this method excellent specificity. Compared to the sensing system requiring two or more conjugated fluorophores, this ratiometric sensing system use DNA-AgNCs as only single fluorophore. Thus, this label-free probe design is convenient and cost-effective. The proximity-dependent discoloration of DNA-AgNCs makes them great potential in ratiometric fluorescence sensors.
The authors report no declarations of interest.
This work is kindly supported by the National Natural Science Foundation of China (No. 21775088).
Supplementary material related to this article can be found, in the online version, at doi:https://doi.org/10.1016/j.cclet.2020.07.015.
C.I. Richards, S. Choi, J.C. Hsiang, et al., J. Am. Chem. Soc. 130 (2008) 5038-5039. doi: 10.1021/ja8005644
W.W. Guo, J.P. Yuan, Q.Z. Dong, E. Wang, J. Am. Chem. Soc. 132 (2010) 932-934. doi: 10.1021/ja907075s
J. Xu, X.M. Zhu, X. Zhou, F.Y. Khusbu, C. Ma, Trends Analyt. Chem. 124 (2020) 115786. doi: 10.1016/j.trac.2019.115786
J.T. Fu, Z.M. Zhang, G.K. Li, Chin. Chem. Lett. 30 (2019) 95-98. doi: 10.1016/j.cclet.2018.01.048
S.Y. Zhu, X.E. Zhao, W. Zhang, et al., Anal. Chim. Acta 786 (2013) 111-115. doi: 10.1016/j.aca.2013.04.067
H.C. Yeh, J. Sharma, J.J. Han, J.S. Martinez, J.H. Werner, Nano Lett. 10 (2010) 3106-3110. doi: 10.1021/nl101773c
H.C. Yeh, J. Sharma, I.M. Shih, et al., J. Am. Chem. Soc. 134 (2012) 11550-11558. doi: 10.1021/ja3024737
H. Kim, S. Kang, K.S. Park, H.G. Pak, Sens. Actuator. B -Chem. 260 (2018) 140-145. doi: 10.1016/j.snb.2017.12.137
S. Juul, J.M. Obliosca, C. Liu, et al., Nanoscale 718 (2015) 8332-8337.
X.L. Yan, J. Sun, X.E. Zhao, et al., Microchim. Acta 185 (2018) 403. doi: 10.1007/s00604-018-2939-7
M. Li, X. Xu, Z.G. Zhou, et al., Microchim. Acta 187 (2020) 141. doi: 10.1007/s00604-019-4094-1
B.C. Yin, J.L. Ma, H.N. Le, et al., Chem. Commun. 50 (2014) 15991-15994. doi: 10.1039/C4CC07209J
R. Zou, F. Zhang, C.Y. Chen, C.Q. Cai, Sens. Actuator. B -Chem. 296 (2019) 126608. doi: 10.1016/j.snb.2019.05.085
J.L. Ma, B.C. Yin, B.C. Ye, Analyst 141 (2016) 1301-1306. doi: 10.1039/C5AN02446C
J.L. Ma, B.C. Yin, H.N. Le, B.C. Ye, ACS Appl. Mater. Interfaces 723 (2015) 12856-12863.
X.E. Zhao, C.H. Lei, Y. Gao, et al., Sens. Actuator. B -Chem. 253 (2017) 239-246. doi: 10.1016/j.snb.2017.06.086
H.Q. Xiong, L. He, Y. Zhang, et al., Chin. Chem. Lett. 30 (2019) 1075-1077. doi: 10.1016/j.cclet.2019.02.008
Y.Y. Yang, C. Zhang, R.Z. Pan, et al., Chin. Chem. Lett. 31 (2020) 125-128. doi: 10.1016/j.cclet.2019.04.037
X.D. Lin, Z. Hao, H.T. Wu, et al., Microchim. Acta 186 (2019) 648. doi: 10.1007/s00604-019-3749-2
W.J. Zhou, J.B. Zhu, D.Q. Fan, et al., Adv. Funct. Mater. 27 (2017) 1704092. doi: 10.1002/adfm.201704092
Y. Yuan, Y.Y. Ma, L. Luo, et al., Microchim. Acta 186 (2019) 613. doi: 10.1007/s00604-019-3732-y
L. Ge, X.M. Sun, Q. Hong, F. Li, ACS Appl. Mater. Inter. 9 (2017) 13102-13110. doi: 10.1021/acsami.7b03198
L. Ge, X.M. Sun, Q. Hong, F. Li, ACS Appl. Mater. Inter. 9 (2017) 32089-32096. doi: 10.1021/acsami.7b09034
J. Wang, Z.Y. Zhang, X. Gao, et al., Sens. Actuator. B -Chem. 282 (2019) 712-718. doi: 10.1016/j.snb.2018.11.121
T.C. Bozeman, R. Nanjunda, C. Tang, et al., J. Am. Chem. Soc. 134 (2012) 17842-17845. doi: 10.1021/ja306233e
R.A. Giroux, S.M. Hecht, J. Am. Chem. Soc. 132 (2010) 16987-l6996. doi: 10.1021/ja107228c
F. Li, Y. Feng, C. Zhao, B. Tang, Biosens. Bioelectron. 26 (2011) 4628-4631. doi: 10.1016/j.bios.2011.05.015
F. Li, Y. Feng, C. Zhao, P. Li, B. Tang, Chem. Commun. 48 (2012) 127-129. doi: 10.1039/C1CC15694B
H.M. Pei, Y.Q. Zheng, R.M. Kong, L. Xia, F.L. Qu, Biosens. Bioelectron. 85 (2016) 76-82. doi: 10.1016/j.bios.2016.04.085
X.T. Liu, W.D. Na, Q. Liu, X.G. Su, Anal. Chim. Acta 1028 (2018) 45-49. doi: 10.1016/j.aca.2018.04.038
D.D. Zhang, J. Hu, X.Y. Yang, et al., Nanoscale 10 (2018) 11134-11142. doi: 10.1039/C8NR02780C
F.L. Gao, J.P. Lei, H.X. Ju, Chem. Commun. 49 (2013) 7561-7563. doi: 10.1039/c3cc44275f
D.D. Su, M.K. Wang, Q. Liu, J.Y. Chen, X.G. Su, Sens. Actuator. B -Chem. 290 (2019) 163-169. doi: 10.1016/j.snb.2019.03.126
Y.T. Su, G.Y. Lan, W.Y. Chen, H.T. Chang, Anal. Chem. 82 (2010) 8566-8572. doi: 10.1021/ac101659d
Y. Guo, J. Wu, H. Ju, Chem. Sci. 6 (2015) 4318-4323. doi: 10.1039/C5SC01215E
B.Z. Zhang, C.Y. Wei, RSC Adv. 7 (2017) 56289-56295. doi: 10.1039/C7RA11566K
S.S. Lu, S. Wang, J.H. Zhao, J. Sun, X.R. Yang, ACS Sens. 3 (2018) 2438-2445. doi: 10.1021/acssensors.8b00996

Figure 1 Schematic illustration of the ratiometric fluorescence detection of BLM based on G-DNA-AgNCs.

Figure 2 (A) Fluorescence emission spectra of (a) free G-DNA-AgNCs, (b) G-DNA-AgNCs + R-DNA, (c) G-DNA-AgNCs + R-DNA + BLM-Fe(II), (d) G-DNA-AgNCs + R-DNA + BLM and (e) G-DNA-AgNCs + R-DNA + Fe(II). (B) CD spectra of (a) free G-DNA-AgNCs, (b) G-DNA-AgNCs + R-DNA, (c) G-DNA-AgNCs + R-DNA + BLM-Fe(II).

 扫一扫看文章

扫一扫关注我们
 DownLoad:
 下载:
下载:
