Citation:
Fan Jiaqi, Fan Yu, Wei Zijin, Li Yijing, Li Xiangdan, Wang Lei, Wang Hao. Transformable peptide nanoparticles inhibit the migration of N-cadherin overexpressed cancer cells[J]. Chinese Chemical Letters,
2020, 31(7): 1787-1791.
doi:
10.1016/j.cclet.2020.03.065
Transformable peptide nanoparticles inhibit the migration of N-cadherin overexpressed cancer cells
English
Transformable peptide nanoparticles inhibit the migration of N-cadherin overexpressed cancer cells
Key Laboratory of Catalysis and Energy Materials Chemistry of Ministry of Education & Hubei Key Laboratory of Catalysis and Materials Science, SouthCentral University for Nationalities, Wuhan 430074, China
b.
CAS Center for Excellence in Nanoscience, CAS Key Laboratory for Biomedical Effects of Nanomaterials and Nanosafety, National Center for Nanoscience and Technology(NCNST), Beijing 100190, China
Received Date:
26 February 2020 Accepted Date:
24 March 2020 Revised Date:
24 March 2020 Available Online:
15 July 2020
Abstract:
About 90% cancer-related mortality results from the cancer metastasis, which generally undergoes after epithelial-mesenchymal transition (EMT) process. N-Cadherin, overexpressed on cancer cell surface during EMT, can enhance the migration of cancer cells. Herein, we design and synthesize a transformable peptide BP-KLVFF-SWTLYTPSGQSK (BFS) that can block N-cadherin for inhibiting cancer migration and metastasis. The peptide BFS consists of three modules including (1) the hydrophobic bis-pyrene (BP) unit for forming and locating nanoparticles, (2) the KLVFF peptide sequence for forming and stabilizing fibrous structures and (3) the targeting peptide sequence SWTLYTPSGQSK that can specifically bind to Ncadherin. The peptide BFS can form nanoparticles in PBS, which can transform to nanofibers when targeting and binding to N-cadherin. The nanofibers inhibit the migration of N-cadherin overexpressed MDA-MB-436 cancer cells. The peptide BFS shows 83.6% inhibiting rate in cells wound healing assay. In addition, the inhibition rate is 67.9% when the BFS applied in transwell migration assay. These results indicate that the BFS has excellent ability to inhibit migration of cancer cells. This self-assembly strategy could be potentially utilized to regulate the key protein during EMT for inhibiting the tumor metastasis.
Cancer metastasis is a situation that cancer cells migrate or invade to other sites in the body from the primary tumor. Cancer metastasis is the main reason for the failure treatment of tumor and cancer-related mortality is mainly due to cancer metastasis (about 90%) [1]. Therefore, the inhibition of cancer metastasis is one of key processes for the therapy of malignant tumors.
Epithelial-derived malignant tumors generally go through the epithelial-mesenchymal transition (EMT) process before metastasis. EMT is an important biological process for epithelial-derived malignant tumor cells to acquire the ability to migrate and invade. During the EMT, the tumor cells have lots of changes in phenotype and expressed proteins. For example, the N-cadherin is one of the overexpressed proteins during the EMT in several kinds of malignant cancer. N-Cadherin is a calcium-binding, single-pass transmembrane glycoprotein that promotes cell adhesion in a homophilic manner, which plays an essential role in numerous biological and disease processes. Overexpression of N-cadherin in tumor cells causes invasion and metastasis [2-8]. It is welldocumented that monoclonal antibodies against N-cadherin reduce adhesion and invasion of cancer cells in vitro [9-13]. Targeting N-cadherin therapy should be useful in the treatment of many kinds of cancer.
In our previous studies, we utilized self-assembling peptides to in situ construct biomimetic extracellular matrix (ECM) materials under specific patho/physiological conditions [14-17]. Inspired by the targeting therapy and the in vivo biomimetic ECM strategy, we designed and prepared a transformable peptide that can precisely target to N-cadherin and self-assembly to form ECM-like peptide networks. The in situ formed peptide networks acted as biomimetic antibody for high-efficiently blocking the N-cadherin receptor and inhibiting the migration of cancer cells (Scheme 1).
Scheme 1
Scheme 1.
Schematic illustration of construction of peptide networks from transformable peptide nanoparticles by binding N-cadherin to inhibit migration and adhesion of cancer cells. (a) The peptide self-assembly into nanoparticles and transform into nanofibers upon binding N-cadherin. (b) The in situ construction of the peptide on Ncadherin cell surfaces to inhibit the adhesion and migration.
The transformable peptide BP-KLVFF-SWTLYTPSGQSK (BFS) for blocking the N-cadherin to inhibit migration of cancer cells was designed and prepared [18]. The BFS consisted of three modules:
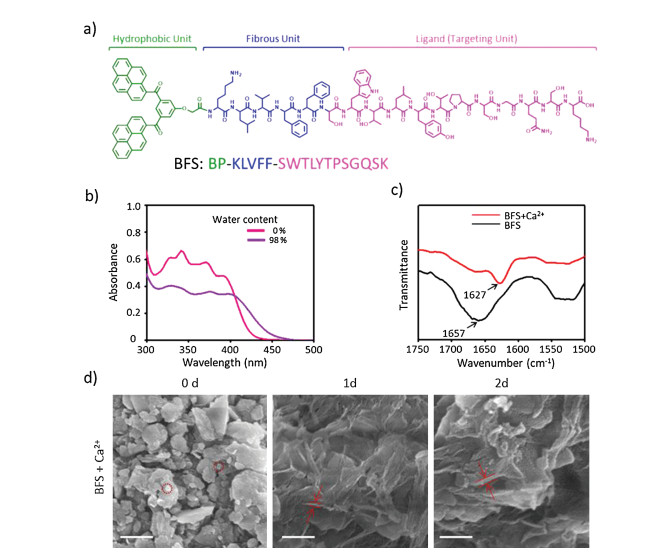
(1) the bis-pyrene (BP) unit for forming nanoparticles due to its hydrophobicity and locating the peptide due to the fluorescence feature [19]; (2) the hydrogen-bonding KLVFF sequence originated from Aβ for peptide fibrillation with β-sheet structures [20, 21]; and (3) the targeting sequence SWTLYTPSGQSK that can specifically recognize cancer cells by targeting the N-cadherin [22-24], which was overexpressed in many tumors and almost no expression in healthy tissues [13, 25] (Fig. 1a). The BFS was prepared from C terminal to N terminal according to the standard solid-phase peptide synthesis techniques using Fmoc-coupling chemistry [26, 27]. Then BP motif was attached to the peptide by amidation reaction. Finally, the integral peptide BFS was cleaved from Wang resin beads and purified by reprecipitation for 3 times. The molecular structures of BFS was confirmed by matrix assisted laser desorption/ionization time-of-flight (MALDI-TOF) mass spectra (Figs. S1 in Supporting information). The peptide BFS selfassembled into spherical structures by the rapid precipitation method. BFS in DMSO (3 mmol/L, 20 μL) was quickly injected into water (980 μL) under magnetic stirring. The self-assembly of BFS from monomer to nanoparticles (NPs) was confirmed by UV-vis absorption and fluorescence spectral analysis (Fig. 1b and Fig. S2 in Supporting information). The absorption bands centered at 340 nm decreased and broadened significantly, indicating the formation of BFS aggregates, which was ascribed to the hydrophobic BP modules. Meanwhile, as shown in Fig. S2, BFS in DMSO showed an obvious fluorescence increase with a maximum at 535 nm upon the addition of water due to the aggregation of BP. These results revealed that BP induced the self-assembly process to form BFS NPs in H2O due to the hydrophobic interactions.
Figure 1
Figure 1.
(a) BFS molecular structure. (b) UV-vis spectra for forming BFS NPs (3.0 × 10⁻⁵ mol/L) in mix H2O/DMSO solutions. (c) FTIR spectra of BFS NPs and BFS NPs + Ca2+ (BFS NFs) in 2 d. (d) SEM images for the corresponding morphologies of BFS nanoaggregates treated with Ca2+ for 0, 1 and 2 d. Scale bar = 500 nm.
When attached to cancer cells that expressed N-cadherin, BFS NPs were expected to simultaneously transform into BFS nanofibers (NFs), mimicking the ligand-receptor interaction induced ECM formation [28]. The self-assembling KLVFF sequence was crucial for the biomimetic transformation. In order to validate the importance of self-assembling sequence, a control peptide BPKAAGG-SWTLYTPSGQSK (BAS) was synthesized with the mutation of a self-assembling sequence (Figs. S3 and S4 in Supporting information). The peptide BAS showed the similar aggregation behavior with peptide BFS based on UV-vis absorption and fluorescence studies (Figs. S5 and S6 in Supporting information). Overall, due to the strong hydrophobicity of BP modules, peptides BFS and BAS were supposed to form NPs with a hydrophilic outer layer of targeting sequence. To further verify the formation of NPs and determine their sizes, scanning electron microscope (SEM) experiments were carried out. The spherical structure with a diameter of 81.7 ± 23.7 nm was observed with SEM for BFS NPs (Fig. 1d). The peptide BAS also formed NPs in solution with diameter of 29.2 ± 2.9 nm (Fig. S7 in Supporting information).
N-Cadherin, calcium-dependent cell adhesion molecules, can enhance the adhesion ability of tumor cells under Ca2+ mediation, thereby enhancing their invasion and metastasis [11]. As a simplified model of N-cadherin, Ca2+ was utilized to initially explore the morphology transformation of the NPs. The fresh solutions of BFS NPs and BAS NPs (3.0 × 10⁻⁵ mol/L, H2O/ DMSO = 98:2) were incubated with a CaCl2 aqueous solution (3.0 × 10⁻⁵ mol/L), respectively. SEM was utilized to observe morphological transformations of NPs with/without Ca2+ over a period of 2 days. Particulate structures for BFS NPs with Ca2+ transformed into short fibers (Φ = 48.5 ± 6.5 nm) in 1 day, which further transformed into long fibrous bundles (BFS NFs, Φ = 69.7 ± 3.3 nm) upon incubation with Ca2+ in 2 days (Fig. 1d). The size (92.7 ± 13.7 nm) of BFS NPs without Ca2+ remained the similar size in 2 days (Fig. S7). These results implied that it was the Ca2+ that induced the structural transformation. In contrast, the control BAS NPs did not show transformable capability when incubated with Ca2+ in 2 days (Fig. S7), indicating the hydrogen bonds from KLVFF sequence was also crucial for the structural transformation. To examine the transformation from BFS NPs to BFS NFs, Fourier transform infrared (FTIR) was utilized to measure the frequency of typical carbonyl stretching vibrations of the amide bond. BFS NPs showed that the band at 1657 cm-1 in FTIR spectrum (Fig. 1c) without Ca2+, which was probably ascribed to the amide bond of the peptide backbone in random coil state. However, the significant change was observed in the spectrum of BFS NPs after incubation with Ca2+. The amide bond exhibited at 1627 cm-1 in FTIR spectrum (Fig. 1c), implying the formation of β-sheets conformation [29]. The amide band of BAS NPs in FTIR spectra showed up at 1641 cm-1 with Ca2+ incubation and 1640 cm-1 without Ca2+ incubation (Fig. S8 in Supporting information). The results verified that the assembling sequence (KLVFF) was a key part for forming β-sheets conformation during the transformation.
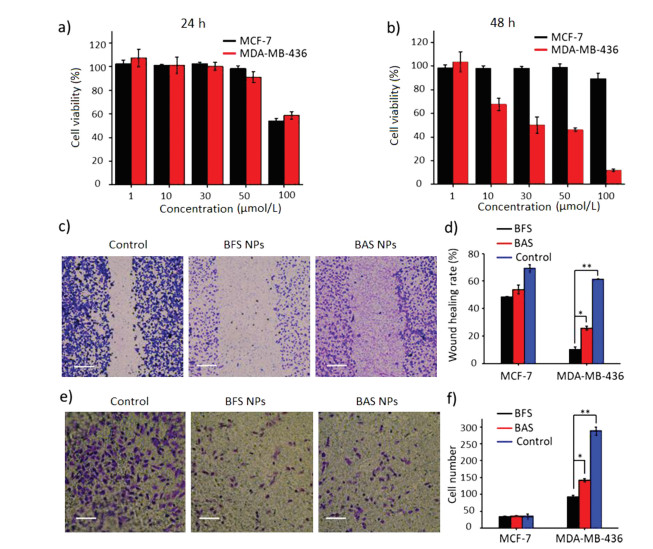
In order to verify the biological effect of BFS NPs, highmetastatic-potential and N-cadherin highly-expressed MDA-MB- 436 cells were selected as a positive cell line with overexpressed Ncadherin [8, 30]. MCF-7 cells were used as a negative control cell line. Cell viability was firstly defined by Cell Counting Kit-8 (CCK-8) array to test the cytotoxicity of BFS NPs on MDA-MB-436 and MCF- 7 cells with BAS NPs as a control (Figs. 2a and b, Fig. S9 in Supporting information). The results showed that BFS NPs were hardly harmful to both cells at the concentration lower than 5.0 × 10⁻⁵ mol/L in 24 h (Fig. 2a), indicating the good biocompatibility. It was found that BFS NPs harmed MDA-MB-436 cells at the concentration higher than 1.0 × 10⁻⁵ mol/L in 48 h (Fig. 2b). However, the viability of MCF-7 cells was still high in 48 h (Fig. 2b). The appeared cytotoxicity of BFS NPs to MDA-MB-436 cells at 48 h was probably ascribed that targeting sequence of SWTLYTPSGQSK blocked the N-cadherin of MDA-MB-436 cells, which was significantly related with the proliferation of cells [9]. The treatment of control BAS NPs showed similar trend of cytotoxicity to both cell lines, indicating the biological effect of N-cadherin targeting peptide sequence. In addition, the BFS NPs showed much higher efficiency than that of BAS NPs because the inhibition of Ncadherin was further significantly enhanced by the ECM-like fibrous structures of BFS NFs.
Figure 2
Figure 2.
Cell viability of MCF-7 and MDA-MB-436 cells treated with BFS NPs by CCK-8 assay for 24 h (a) and 48 h (b). Microscopy images of wound healing (c) (Scale bar =500 μm) and transwell (e) (Scale bar =250 μm) assay and quantitative analysis (d, f) of MDA-MB-436 cells. The first group was the control group without any treatment. The second and third groups were incubated with BFS NPs and BAS NPs for 48 h, respectively. Data presented as mean ± SD, **P < 0.01, *P < 0.05.
To further evaluate the inhibition effect of BFS NPs for tumor invasion and metastasis, the wound healing and transwell migration assays were performed. The results of the wound healing assay for the inhibition capability study of BFS NPs and BAS NPs on cell motility were shown in Fig. 2c and Fig. S10 (Supporting information). Highly-metastatic and N-cadherin highly-expressed MDA-MB-436 cells showed a strong migration healing ability 48 h post-scratching, which was defined as control group with wound healing rate (61.4%). BAS NPs treatment decreased the wound healing rate to 25.6%, indicating the inhibitory effect of SWTLYTPSGQSK sequence in BAS NPs for N-cadherin. The BFS NPs treated group decreased the wound healing rate to 10.1%
(Figs. 2c and d). The inhibition rate of BFS NPs (83.6%) was much stronger than that of BAS NPs (58.3%). The wound healing rate of MCF-7 cells treated by BFS NPs and BAS NPs were 48.4% and 53.8%, respectively, with the 69.2% of control group (Fig. 2d and Fig. S10). These results indicated that the BFS NPs and BAS NPs inhibited the migration of cell through binding of SWTLYTPSGQSK sequence to N-cadherin. Transwell migration assays further showed the inhibition of longitudinal motility ability of MDA-MB-436 cells by BFS NPs. As shown in Figs. 2e and f, inconsistent with the wound healing assay, cells of the control group showed high longitudinal migration ability with cells passing through transwell chamber. BFS NPs showed a high inhibition on longitudinal motility ability of MDA-MB-436 cells with an inhibition rate of 67.9%. The inhibition effect of BAS NPs was evaluated with an inhibition rate of 50.5%
(Figs. 2e and f). The longitudinal motility of MCF-7 cells by transwell migration was almost no affected with the treatment of BFS NPs or BAS NPs (Fig. 2f and Fig. S11 in Supporting information). These results were in agreement with the wound healing assays results that the inhibition capability of BFS NPs and BAS NPs originated from the blockage of N-cadherin receptors on the surface of cancer cells by targeting peptide. All in vitro experimental results above revealed that transformable BFS NPs showed a much stronger inhibitory effect for high-metastaticpotential MDA-MB-436 cells than that of control BAS NPs, indicating that the in situ transformation into BFS NFs to block the N-cadherin was critical for the high inhibition capability of highly metastatic cells.
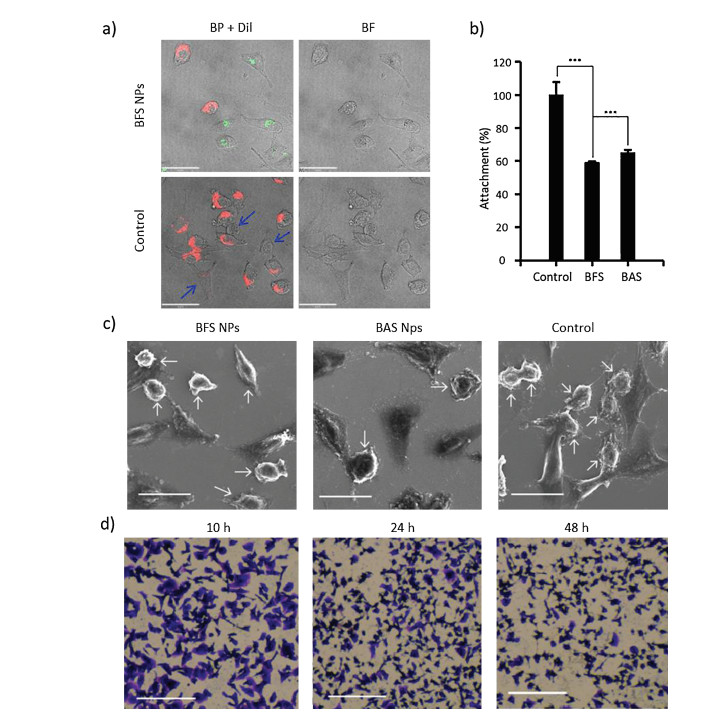
The capability of highly metastatic cells overexpressed Ncadherin originated from the adhesion ability from N-cadherin to stromal cells. We designed a series of experiments to verify whether the BFS NPs affected the cell's adhesion ability. It was well known that stromal cells were functional cells with strong differentiation and regeneration capabilities in humans, enabling the high invasion ability of cancer cells through binding Ncadherin [30]. Therefore, L929 cells (mouse fibroblast) as model stromal cells were chosen for the measurements of the adhesion ability of MDA-MB-436 cells [30]. In order to evaluate the adhesion between L929 cells and MDA-MB-436 cells, both cells were coincubated at the ratio of 1:1 in DMEM medium without fetal bovine serum (FBS), where L929 cells were stained by Dil (cell membrane dye) and the MDA-MB-436 were treated with BFS NPs or BSA NPs before co-incubation [31]. Confocal laser scanning microscopy (CLSM) images showed that there were almost no cellular aggregates of L929 and MDA-MB-436 cells in BFS NPs or BAS NPs treated group, and only individual cells were observed (Fig. 3a). In the absence of BFS NPs or BAS NPs, it was found that L929 and MDA-MB-436 cells could adhere to each other as expected (Fig. S12 in Supporting information). These results confirmed that the MDA-MB-436 could adhere to stromal cells through N-cadherin, which could be blocked by BFS NPs or BAS NPs. The multicellular adhesion was confirmed by scanning electron microscopy (SEM). The SEM results also verified that there was almost no direct contact at different cell-cell interfaces (Fig. 3c).
Figure 3
Figure 3.
(a) CLSM images of MDA-MB-436 cells mixed with L929 cells at a 1:1 ratio treated with/without BFS NPs for 12 h. MDA-MB-436 cells were located by BP fluorescence and L929 cells were located by Dil fluorescent dye. Scale bar =18 μm. Blue arrows indicated MDA-MB-436 cells. (b) Attachment assays upon treatment with/without BFS NPs or BAS NPs (30 μmol/L). Data presented as mean ± SD, ***P < 0.001. (c) SEM images of the MDA-MB-436 cells mixed with L929 cells at a 1:1 ratio treated with/without BFS NPs or BAS NPs for 12 h. Scale bar = 25 μm. White arrows indicated MDA-MB-436 cells, the rest cells were L929 cells. (d) Microscopy images of morphologies of MDA-MB-436 cells treated with BFS NPs for 10, 24 and 48 h. Scale bar = 500 μm.
In order to confirm the anti-adhesion ability of BFS NPs and BAS NPs as a whole, we designed the attachment assay. BFS NPs and BAS NPs obviously inhibited attachment of MDA-MB-436 cells on L929 in vitro (Fig. 3b). BFS NPs performed the better inhibition rate of 40.9% than BAS NPs (34.8%). The BFS NPs and BAS NPs not only inhibited the adhesion of MDA-MB-436 cells but also changed the morphologies of MDA-MB-436 cells (Fig. 3d and Fig. S13 in Supporting information). Confluent cells were incubated in the presence of the BFS NPs or BAS NPs for various periods of time. The morphology of MDA-MB-436 cells distinctly changed from fusiform to spherical in 24 h. Furthermore, the number of MDAMB-436 cells decreased obviously 48 h post-treatment of BFS NPs. The BAS NPs showed similar effects for the MDA-MB-436 cells and the control cells without treatment almost remained the morphologies.
In summary, we developed a biomimetic self-assembly strategy to block the N-cadherin overexpressed during EMT for inhibiting the proliferation and adhesion as well as the migration of cancer cells. The designed peptide BFS self-assembled into BFS NPs, which transformed into the BFS NFs through binding to N-cadherin through ligand-receptor interactions as an ECM-like barrier. The BFS NFs based ECM-like barrier high-efficiently blocked the Ncadherin, resulting in the inhibition of migration of highly metastatic MDA-MB-436 cancer cells with overexpressed Ncadherin. Therefore, this in situ regulation of EMT functional protein showed great potential for inhibition of tumor invasion and metastasis.
Declaration of competing interest
The authors declare that they have no known competing financial interests or personal relationships that could have appeared to influence the work reported in this paper.
Acknowledgments
This work was supported by the National Natural Science Foundation of China (Nos. 51890891, 51725302, 21807020, 51573031 and 51573032), National Key R&D Program of China (No. 2018YFE0205400), Science Fund for Creative Research Groups of the National Natural Science Foundation of China (No. 11621505), CAS Interdisciplinary Innovation Team.
B. Wang, J. Song, H. Yuan, et al., Adv. Mater. 26 (2014) 2371-2375. doi: 10.1002/adma.201304593
Scheme 1
Schematic illustration of construction of peptide networks from transformable peptide nanoparticles by binding N-cadherin to inhibit migration and adhesion of cancer cells. (a) The peptide self-assembly into nanoparticles and transform into nanofibers upon binding N-cadherin. (b) The in situ construction of the peptide on Ncadherin cell surfaces to inhibit the adhesion and migration.
Figure 1
(a) BFS molecular structure. (b) UV-vis spectra for forming BFS NPs (3.0 × 10⁻⁵ mol/L) in mix H2O/DMSO solutions. (c) FTIR spectra of BFS NPs and BFS NPs + Ca2+ (BFS NFs) in 2 d. (d) SEM images for the corresponding morphologies of BFS nanoaggregates treated with Ca2+ for 0, 1 and 2 d. Scale bar = 500 nm.
Figure 2
Cell viability of MCF-7 and MDA-MB-436 cells treated with BFS NPs by CCK-8 assay for 24 h (a) and 48 h (b). Microscopy images of wound healing (c) (Scale bar =500 μm) and transwell (e) (Scale bar =250 μm) assay and quantitative analysis (d, f) of MDA-MB-436 cells. The first group was the control group without any treatment. The second and third groups were incubated with BFS NPs and BAS NPs for 48 h, respectively. Data presented as mean ± SD, **P < 0.01, *P < 0.05.
Figure 3
(a) CLSM images of MDA-MB-436 cells mixed with L929 cells at a 1:1 ratio treated with/without BFS NPs for 12 h. MDA-MB-436 cells were located by BP fluorescence and L929 cells were located by Dil fluorescent dye. Scale bar =18 μm. Blue arrows indicated MDA-MB-436 cells. (b) Attachment assays upon treatment with/without BFS NPs or BAS NPs (30 μmol/L). Data presented as mean ± SD, ***P < 0.001. (c) SEM images of the MDA-MB-436 cells mixed with L929 cells at a 1:1 ratio treated with/without BFS NPs or BAS NPs for 12 h. Scale bar = 25 μm. White arrows indicated MDA-MB-436 cells, the rest cells were L929 cells. (d) Microscopy images of morphologies of MDA-MB-436 cells treated with BFS NPs for 10, 24 and 48 h. Scale bar = 500 μm.


 DownLoad:

 下载:
下载:


