Citation:
Wang Liulin, Chen Buxiang, Peng Pingping, Hu Wenbo, Liu Zhipeng, Pei Xiaohua, Zhao Weihong, Zhang Chengwu, Li Lin, Huang Wei. Fluorescence imaging mitochondrial copper(Ⅱ) via photocontrollable fluorogenic probe in live cells[J]. Chinese Chemical Letters,
2017, 28(10): 1965-1968.
doi:
10.1016/j.cclet.2017.07.016
Fluorescence imaging mitochondrial copper(Ⅱ) via photocontrollable fluorogenic probe in live cells
Key Laboratory of Flexible Electronics (KLOFE) & Institute of Advanced Materials (IAM), Jiangsu National Synergetic Innovation Center for Advanced Materials (SICAM), Nanjing Tech University (NanjingTech), Nanjing 211816, China
b.
Division of Nephrology, Department of Geriatrics, The First Affiliated Hospital of Nanjing Medical University, Nanjing 210009, China
c.
Key Laboratory for Organic Electronics and Information Displays & Institute of Advanced Materials (IAM), Nanjing University of Posts & Telecommunications, Nanjing 210023, China
Received Date:
27 April 2017 Accepted Date:
12 July 2017 Revised Date:
10 July 2017 Available Online:
22 October 2017
Abstract:
Monitoring mitochondrial derived copper(Ⅱ) in live cells is highly demanded, but accurately detecting is unmet due to the interference with cytoplasmic copper(Ⅱ). Herein, we have reported the design, synthesis and characterization of photocontrollable fluorogenic probe, MCu-3, which is equipped with a photo-labile group (nitrobenzyl group) and mitochondria targeting unit (triphenylphosphonium salt). This novel probe showed an intense fluorescence enhancement in response to copper(Ⅱ) without interference from other metal cations in the biological condition (pH 6-9). The detection limit is 1.7×10⁻⁷ mol/L in HEPES buffer. The confocal fluorescence imaging results demonstrated MCu-3 can visualize mitochondrial copper(Ⅱ) in live mammalian cells. The clear advantage of our photocontrollable method is successful to avoid the influence of cytoplasmic copper(Ⅱ) during mitochondria specific detection.
Mitochondria are organelles with critical roles in key processes within eukaryotic cells, and summarily described as the "power factory" of life, supplying energy which our bodies depend on all the time in every biochemical reaction and action of lives [1-3]. Dysfunction of mitochondria underlies the pathogenesis of variety of diseases, such as Parkinson's disease (PD), Alzheimer's disease (AD), atherosclerosis, acute and chronic degenerative cardiac myocyte death, neuronal death (ischemic and hemorrhagic stroke) and cancer [4-7]. Therefore, mitochondrial damage factors have been one of the top priority scientific topics [8-10]. In mitochondria, copper(Ⅱ), an essential trace element, is an inalienable part of many important enzymes involved in a range of vital physiological processes such as transportation and catalysis in living cells [11-13]. Copper(Ⅱ)-induced toxicity is the result of ionic imbalance affecting on mitochondrial respiratory chain, apparently causing transition metals-induced reactive oxygen species (ROS) formation, mitochondrial membrane depolarization, lipid peroxidation, and cytochrome c release which ignite cell apoptosis [12]. Disorder of copper(Ⅱ)/copper(Ⅰ) homeostasis plays a leading role in the pathogenetic mechanisms of many neurodegenerative diseases [14, 15]. Copper interacting with the proteins is also the signs of neurodegenerative disorders, such as PD and AD [16, 17]. In consequence, detection of mitochondrial copper(Ⅱ) is significant to study its pathogenetic mechanism in neurodegenerative diseases and monitor its homeostasis. Regretfully, there is no available tools which could precisely detect mitochondrial copper (Ⅱ) in live cells without interfered by cytoplasmic copper.
Given the pivotal role of mitochondria, development of mitochondria specific probe to detect the elements insider it attracts increasing attention. For example, in the past decade, various reactive mitochondria-specific fluorescent probes have been developed for the detection of reactive oxygen species (ROS)
[18-22], reactive sulphur species (RSS) [23-25], metal ions [26-29], enzymes [30, 31] and other targets [32-36] inside mitochondria. Nevertheless, most of these fluorescent probes have the limitation that they hardly overcome the interference of the targeted species inside cytoplasm. For detection of mitochondrial copper(Ⅱ) or other species, it is necessary to design more appropriate strategies to conquer this long-standing problem.
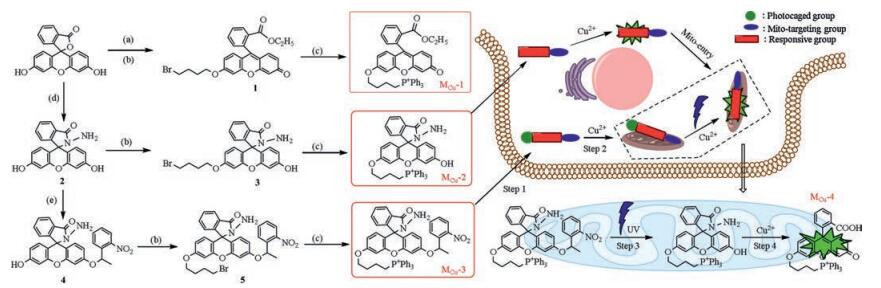
Herein, with this aim in mind, we have designed a novel mitochondrial specific fluorogenic probe MCu-3 (Scheme 1) to accurately visualize copper(Ⅱ) in mitochondria of live cells. In our approach, alkyl-linked fluorescein hydrazide provided a fluorescence-responsive for copper(Ⅱ) [37-39]. Its photocaged version with 2-nitrobenzyloxy unit, efficiently photolyzed by ultraviolet (UV) light illumination, not only increases the cell permeability of the probe, but also at the same time provides additional spatial and temporal controls over imaging mitochondrial copper(Ⅱ) [40-42]. In the current study, we chose a simple photolabile 2-nitrobenzyloxy group as the caging molecule for synthetic convenience, but it may be readily replaced with two-photon caging molecules [43-45]. Triphenylphosphonium salt (TPP) group serves as the mitochondrial-targeting moiety according to previous literature report [46-50]. The overall "piggyback" strategy of the probe MCu-3 is shown in the right side of Scheme 1. As shown, fluorescein hydrazide hydrolysed by cytoplasmic copper would normally be blocked due to the existence of caged unit after cellular uptake (Step 1), which facilitated MCu-3 to accumulate completely with no fluorescence. The TPP would be internalized to mitochondria (Step 2). Subsequent UV irradiation (Step 3) will force photocaged group to leave to release the uncaged probe MCu-2 (still conjugated to the TPP), which would then be hydrolyzed by mitochondrial copper (Ⅱ), generating the specific localized and highly fluorescent MCu-4 (Step 4).
Scheme 1
图 Scheme 1
The synthetic route and overall strategies of fluorogenic probes for accurately visualizing copper(Ⅱ) ion in mitochondria in live cells. (a) Ethanol, H2SO4, reflux, quantitative; (b) 1, 4-Dibromobutane, Cs2CO3, DMF, 70%–78%; (c) Triphenylphosphine, toluene, reflux, 60%–71%; (d) Hydrazine hydrate, MeOH, reflux, 91%; (e) 1-(1-Bromoethyl)-2-nitrobenzene, Cs2CO3, DMF, 52%.
Scheme 1.
The synthetic route and overall strategies of fluorogenic probes for accurately visualizing copper(Ⅱ) ion in mitochondria in live cells. (a) Ethanol, H2SO4, reflux, quantitative; (b) 1, 4-Dibromobutane, Cs2CO3, DMF, 70%–78%; (c) Triphenylphosphine, toluene, reflux, 60%–71%; (d) Hydrazine hydrate, MeOH, reflux, 91%; (e) 1-(1-Bromoethyl)-2-nitrobenzene, Cs2CO3, DMF, 52%.
Based on this design, the fluorogenic probe MCu-3 and two reference probes MCu-1/2 were synthesized following the revised literature procedures [28, 51-53], as shown in Scheme 1. The copper-recognizing part, fluorescein hydrazide (2), was synthesized in one step with the overall yield of 90% from the commercially available fluorescein and hydrazine hydrate. Alkylation reactions were carried out with 1, 4-dibromobutane in 70%-78% yield to generate 1/3/5 from fluorescein/2/4, respectively. The photocaged group was synthesized with bromination reaction of 1-ethyl-2-nitrobenzene (80% yield, Supporting information). The nitrobenzyl protected fluorescein hydrazide (4) was prepared by condensation between 2 and 1-(1-bromoethyl)-2-nitrobenzene in 52% yield in the presence of Cs2CO3, while bisnitrobenzyl protected fluorescein hydrazide (6) was obtained in 85% yield as shown in Supporting information. The mitochondria-targeted group-containing MCu-1/2/3 were synthesized under high temperature reflux of toluene (60%–71% yield). The structures of all compounds were fully characterized by 1H NMR, 13C NMR and HRMS analysis (see Supporting information).
To unequivocally establish that our newly developed MCu-3/2/4 probe group was indeed a good fluorogenic system, capable of "keep silence" and emitting strong fluorescence during MCu-3→2 and MCu-2→4 conversion, respectively, we first investigated their photophysical properties (Fig. S1 in Supporting information). As shown, under physiological conditions (HEPES buffer at pH 7.5), MCu-1, ester version reference of MCu-4, had maximum absorption at 450 nm (Fig. S1A), and emission at 525 nm (Fig. S1B, Φ = 0.20), while there is nearly no absorption and emission for MCu-2/3/ 3 + UV (Φ = 0.001–0.0015) around the same wavelength. Consequently, the caged probe has a very low fluorescence background and high S/N ratio in vitro assay and live cell imaging. As we expected, incubated with copper(Ⅱ), MCu-3 + UV has very similar absorption and emission properties with MCu-1 in HEPES buffer (Fig. S1A and B, pH 7.5). As shown in Fig. 1A, the photolabile nitrobenzyl group was released after exposure to UV light (500 μJ/cm2 for 5 min), and hydrolysis reaction could be finished in 60 min. Experiments were monitored by HPLC-MS, and peaks were unambiguously assigned based on their molecular weights. At the meantime, we also demonstrated MCu-3 will not coordinate with copper(Ⅱ) in physiological conditions by using HPLC-MS, which may prevent it from bringing cytoplasmic copper into mitochondria. As expected, there is almost no fluorescent signal even in the presence of copper(Ⅱ) before UV illumination, indicating that the caged probe is very stable and does not be hydrolyzed to MCu-4 in the presence of copper(Ⅱ) in the dark. We then proceeded to investigate the optimal response time of MCu-3 toward copper(Ⅱ) upon exposure to UV light for 5 min. A largest fluorescence enhancement (Φ = 0.17) at 525 nm was observed after 60 min and no longer change over time (Fig. S2 in Supporting information), which is consistent with the HPLC-MS analysis.
图 1
图 1
(A) MCu-3→MCu-2 conversion by UV irradiation (5 min), followed by MCu-2! MCu-4 hydrolysed by mitochondrial Cu2+ (60 min). Reactions were carried out at room temperature in HEPES buffer (pH 7.5; probe concentration: 2.0 μmol/L). Cu2+/probe concentration ratio = 10:1. (B) One-photon fluorescence emission spectra of 5 min UVassisted uncaged MCu-3 (2.0 μmol/L) after addition of Cu2+ (0→10 equiv.) in HEPES buffer after 60 min incubation at room temperature. (C) The fluorescence intensities at 525 nm of MCu-1 (2 μmol/L), MCu-3 (2 μmol/L) and uncaged MCu-3 (2 μmol/L)/Cu2+ (10 equiv.) at various pH values at room temperature. The excitation wavelength was 455 nm. (D) Effect of the analytes (10 equiv.) to uncaged MCu-3 with/without Cu2+ in HEPES buffer, red bars represent the fluorescence intensity of uncaged MCu-3 (2.0 μmol/L) in the presence of various analytes (10 equiv.) before (1–14) and after (16–29) adding Cu2+ (10 equiv.) at room temperature, respectively. (E) Photos of the fluorescence of effect of the analytes (10 equiv.) to uncaged MCu-3 in HEPES buffer after 60 min incubation at room temperature.
Figure 1.
(A) MCu-3→MCu-2 conversion by UV irradiation (5 min), followed by MCu-2! MCu-4 hydrolysed by mitochondrial Cu2+ (60 min). Reactions were carried out at room temperature in HEPES buffer (pH 7.5; probe concentration: 2.0 μmol/L). Cu2+/probe concentration ratio = 10:1. (B) One-photon fluorescence emission spectra of 5 min UVassisted uncaged MCu-3 (2.0 μmol/L) after addition of Cu2+ (0→10 equiv.) in HEPES buffer after 60 min incubation at room temperature. (C) The fluorescence intensities at 525 nm of MCu-1 (2 μmol/L), MCu-3 (2 μmol/L) and uncaged MCu-3 (2 μmol/L)/Cu2+ (10 equiv.) at various pH values at room temperature. The excitation wavelength was 455 nm. (D) Effect of the analytes (10 equiv.) to uncaged MCu-3 with/without Cu2+ in HEPES buffer, red bars represent the fluorescence intensity of uncaged MCu-3 (2.0 μmol/L) in the presence of various analytes (10 equiv.) before (1–14) and after (16–29) adding Cu2+ (10 equiv.) at room temperature, respectively. (E) Photos of the fluorescence of effect of the analytes (10 equiv.) to uncaged MCu-3 in HEPES buffer after 60 min incubation at room temperature.
We further examined the sensing response of MCu-3 to copper (Ⅱ). Upon photolysis, introduction of an increasing concentration of copper(Ⅱ) to the solution of MCu-3 (2 μmol/L) induced a gradual increase in the emission around 525 nm (Fig. 1B). When the amount of copper(Ⅱ) was more than 10 equiv., the spectra saturation was reached, which is similar with MCu-2 (Fig. S4 in Supporting information) and 6 (Fig. S5 in Supporting information). In this case, a linear calibration graph of the fluorescent intensities toward copper(Ⅱ) concentrations was plotted. Fluorescence intensity also exhibited a good linearity against the copper(Ⅱ) concentrations as shown in Fig. S3 (R2 = 0.994, Supporting information). A linear regression curve was then fitted to these normalized fluorescent intensity data, and the point at which this line crossed the axis was considered as the detection limit as 1.7 × 10⁻⁷ mol/L (Supporting information).
The pH of cytoplasma was between 6.8 and 7.4, however the pH of the mitochondrial matrix was around 8.2–7.5 [49, 51]. Therefore, we determined whether the probe can emit fluorescence and be stable in the scope. Hence, the effect of pH on the fluorescence response of MCu-3 to copper(Ⅱ) was tested. A quantitative analysis of the fluorescence intensity at 525 nm vs. a wide pH range from 3 to 12 (Fig. S6 in Supporting information) indicated that MCu-3 can act as a detector in physiological pH conditions (pH 6–9) (Fig. 1C). Thus, MCu-3 could work properly in mitochondria. Next, we also tested the selectivity of MCu-3 (2 μmol/L) toward a series of metal ions (10 equiv.) upon photolysis for 5 min, including Zn2+, Co2+, Mn2+, Ni2+, K+, Na+, Ca2+, Ba2+, Fe3+, Cr3+, Al3+, Cd2+, Mg2+, Pd2+, to evaluate the selectivity of the probe for copper(Ⅱ). As shown in Fig. 1D and E, addition of copper(Ⅱ) to MCu-3 upon photolysis resulted in a significant enhancement of the fluorescence intensity, other species have a negligible fluorescent intensity and little interference, which indicated MCu-3 has a good selectivity and anti-interference ability for copper(Ⅱ).
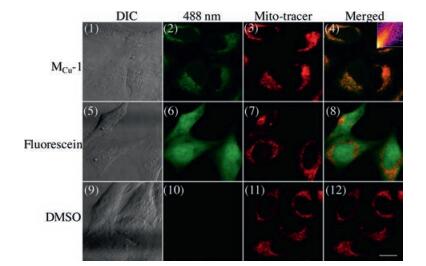
We next investigated that our newly developed MCu-1/2/3 fluorogenic system was indeed useful for bioimaging application to detect mitochondrial copper(Ⅱ). The cytotoxicity activity assays were shown there is no obvious cell toxicity at concentrations up to 20 μmol/L for all three probes in the human hepatocellular carcinoma (HepG2) cells (Fig. S7 in Supporting information), making them suitable for living cell imaging. Indeed, when live HepG2 cancer cells were treated with MCu-1, followed by onephoton fluorescence microscopy, we observed fluorescent staining exclusively within the cells (Fig. 2). As shown in Fig. 2(4), the green fluorescence signal of the reference probe MCu-1 was welloverlapped with the red fluorescence signal from the Mito-Tracker with a high contrast ratio. In contrast, fluorescein, a control free dye without TPP, only can stain whole cells without any specific localization. Prolonged incubation of the cells with MCu-1 was comparable with known Mito-Tracker without leading to any diffusion, confirming MCu-1 has good cell permeability and mitochondrial specificity.
图 2
图 2
One-photon fluorescence imaging of live HepG2 cells by control probe MCu-1 (5 μmol/L), fluorescein (5 μmol/L) and DMSO. Live cells were incubated with the probes for 1 h at 37 ℃, followed addition of a commercial available Mito-tracker Red CMXRos dye (200 nmol/L), then further incubated for 30 min, before being imaged. The excitation wavelength were 488 and 543 nm, while the PMT range were 500– 550 and 570–650 nm for control probes and Mito-tracker, respectively. Insert in (4) is the colocalization analysis of merged-image of (2)/(3) (R = 0.85). All images were acquired in the same way. DIC = Differential interference contrast image. Scale bar = 10 μm.
Figure 2.
One-photon fluorescence imaging of live HepG2 cells by control probe MCu-1 (5 μmol/L), fluorescein (5 μmol/L) and DMSO. Live cells were incubated with the probes for 1 h at 37 ℃, followed addition of a commercial available Mito-tracker Red CMXRos dye (200 nmol/L), then further incubated for 30 min, before being imaged. The excitation wavelength were 488 and 543 nm, while the PMT range were 500– 550 and 570–650 nm for control probes and Mito-tracker, respectively. Insert in (4) is the colocalization analysis of merged-image of (2)/(3) (R = 0.85). All images were acquired in the same way. DIC = Differential interference contrast image. Scale bar = 10 μm.
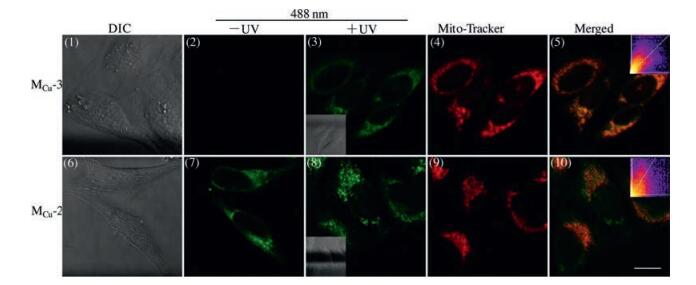
Encouraged by these results, we next determined whether MCu-3 works as a mitochondria specific probe for imaging copper(Ⅱ). As shown in Fig. 3, HepG2 cells were incubated with MCu-3 and MCu-2 in the presence of copper(Ⅱ). Cells treated with MCu-3, if without UV-irradiation, showed no fluorescence, indicating the temporal control of our "caging" strategy (Fig. 3(2)). However, the significant fluorescent enhancement of MCu-2-treated cells have been observed in the same way (Fig. 3(7)). Upon UV irradiation, a gradual increase in green fluorescence was observed both in MCu-3 (Fig. 3(3)) and MCu-2-treated cells (Fig. 3(8)). However, there is no fluorescence if MCu-3-treated cells were only exposed to UV light without copper(Ⅱ) as shown in Fig. S8 (Supporting information). Furthermore, cell membrane-impermeable copper(Ⅱ) chelator (EDTA) was used to treat cells before and after probe incubation together with UV irradiation. The images (Fig. S8(3)) showed EDTA had almost no effect on fluorescence because the reaction between MCu-3 and copper(Ⅱ) is irreversible. And, a faint fluorescence signal in Fig. S8(4) indicated pre-treated EDTA did not totally blocked the reaction. The cells were simultaneously treated with commercially available Mito-tracker to independently verify the localization results. Both MCu-3 and MCu-2-treated cells showed similar mitochondria-specific images by comparing the colocalization analysis results between Fig. 3(5) and (10), indicating the strategy is amenable to the original design principle. This suggested that the probes could accurately detect mitochondrial copper(Ⅱ).
图 3
图 3
One-photon fluorescence imaging of live HepG2 cells by probes MCu-3/2 (5 μmol/L). Live cells were incubated with the probe for 1 h at 37 ℃, followed by UV(+) or UV (-) irradiation (2 min) at room temperature and addition of with Cu2+ (10 equiv.) for another 30 min at 37 ℃. After that, cells were incubated with the tracker (200 nmol/L) for 30 min, before being imaged. The excitation wavelength and PMT range were 488 and 500–550 nm for both of two probes, respectively. Insets are DIC images in (3)/(8), and colocalization analysis of merged-image (3)/(4) (R = 0.81) and (8)/(9) (R = 0.78) in (5) and (10), respectively. All images were acquired in the same way. Scale bar = 10 μm.
Figure 3.
One-photon fluorescence imaging of live HepG2 cells by probes MCu-3/2 (5 μmol/L). Live cells were incubated with the probe for 1 h at 37 ℃, followed by UV(+) or UV (-) irradiation (2 min) at room temperature and addition of with Cu2+ (10 equiv.) for another 30 min at 37 ℃. After that, cells were incubated with the tracker (200 nmol/L) for 30 min, before being imaged. The excitation wavelength and PMT range were 488 and 500–550 nm for both of two probes, respectively. Insets are DIC images in (3)/(8), and colocalization analysis of merged-image (3)/(4) (R = 0.81) and (8)/(9) (R = 0.78) in (5) and (10), respectively. All images were acquired in the same way. Scale bar = 10 μm.
In summary, we have described a photocontrollable probe can detect mitochondrial copper(Ⅱ) over cytoplasmic via fluorescence imaging. The probe would be very useful for study pathogenic mechanism of mitochondrial copper(Ⅱ) involved diseases. This novel probe shows a 15-fold fluorescence enhancement in response to copper(Ⅱ) without interference from other metal ions in the biological condition. The clear advantage of our method is successful to avoid the influence of chemical species inside cytoplasm during mitochondrial specific detection. Of course, the method maybe also play an instruction role in mitochondriaspecific drug delivery and control release, not only to the study of targeting mitochondrial fluorescence probe. A series of probes, with detection limit in the femtomolar range, which could distinguish the endogenous copper(Ⅱ) in different organelles would be good compensation to our probe.
Acknowledgments
This work was financially supported by the National Natural Science Foundation of China (Nos. 81672508, 61505076), Natural Science Foundation of Jiangsu Province (No. BK20140951), Key University Science Research Project of Jiangsu Province (No. 16KJA180004) and SICAM Fellowship & Scholarship by Jiangsu National Synergetic Innovation Center for Advanced Materials.
Figure 1
(A) MCu-3→MCu-2 conversion by UV irradiation (5 min), followed by MCu-2! MCu-4 hydrolysed by mitochondrial Cu2+ (60 min). Reactions were carried out at room temperature in HEPES buffer (pH 7.5; probe concentration: 2.0 μmol/L). Cu2+/probe concentration ratio = 10:1. (B) One-photon fluorescence emission spectra of 5 min UVassisted uncaged MCu-3 (2.0 μmol/L) after addition of Cu2+ (0→10 equiv.) in HEPES buffer after 60 min incubation at room temperature. (C) The fluorescence intensities at 525 nm of MCu-1 (2 μmol/L), MCu-3 (2 μmol/L) and uncaged MCu-3 (2 μmol/L)/Cu2+ (10 equiv.) at various pH values at room temperature. The excitation wavelength was 455 nm. (D) Effect of the analytes (10 equiv.) to uncaged MCu-3 with/without Cu2+ in HEPES buffer, red bars represent the fluorescence intensity of uncaged MCu-3 (2.0 μmol/L) in the presence of various analytes (10 equiv.) before (1–14) and after (16–29) adding Cu2+ (10 equiv.) at room temperature, respectively. (E) Photos of the fluorescence of effect of the analytes (10 equiv.) to uncaged MCu-3 in HEPES buffer after 60 min incubation at room temperature.
Figure 2
One-photon fluorescence imaging of live HepG2 cells by control probe MCu-1 (5 μmol/L), fluorescein (5 μmol/L) and DMSO. Live cells were incubated with the probes for 1 h at 37 ℃, followed addition of a commercial available Mito-tracker Red CMXRos dye (200 nmol/L), then further incubated for 30 min, before being imaged. The excitation wavelength were 488 and 543 nm, while the PMT range were 500– 550 and 570–650 nm for control probes and Mito-tracker, respectively. Insert in (4) is the colocalization analysis of merged-image of (2)/(3) (R = 0.85). All images were acquired in the same way. DIC = Differential interference contrast image. Scale bar = 10 μm.
Figure 3
One-photon fluorescence imaging of live HepG2 cells by probes MCu-3/2 (5 μmol/L). Live cells were incubated with the probe for 1 h at 37 ℃, followed by UV(+) or UV (-) irradiation (2 min) at room temperature and addition of with Cu2+ (10 equiv.) for another 30 min at 37 ℃. After that, cells were incubated with the tracker (200 nmol/L) for 30 min, before being imaged. The excitation wavelength and PMT range were 488 and 500–550 nm for both of two probes, respectively. Insets are DIC images in (3)/(8), and colocalization analysis of merged-image (3)/(4) (R = 0.81) and (8)/(9) (R = 0.78) in (5) and (10), respectively. All images were acquired in the same way. Scale bar = 10 μm.

 下载:
下载:


 下载:
下载:


