Citation:
Cui Li-Ying, Yan Yu, Zhao Xin-Yu, Yu Cun-Long, Ma Ying, Yang Bai. Controlling coffee ring structure on hydrophobic polymer surface by manipulating wettability with O2 plasma[J]. Chinese Chemical Letters,
2017, 28(1): 1-5.
doi:
10.1016/j.cclet.2016.07.028
Controlling coffee ring structure on hydrophobic polymer surface by manipulating wettability with O2 plasma
Received Date:
12 June 2016 Accepted Date:
06 July 2016 Revised Date:
04 July 2016 Available Online:
22 January 2017
Abstract:
A simple and novel method is firstly reported for controlling coffee ring structure on polystyrene (PS) film surface by O2 plasma. O2 plasma treatment leads to the wettability change of PS surface from hydrophobic to hydrophilic. For hydrophilic PS surface the coffee ring structure is avoided relying on the motion of contact line (CL) while SiO2 microspheres are left. The motion of the CL is produced based on the viscosity and Marangoni effect with the addition of polymer additives. For hydrophobic PS surface coffee ring structure still persists even with polymer additives because SiO2 microspheres transfer with the motion of the CL at the beginning of droplet evaporation and accumulate at the droplet edge at late stage with the pinning of the CL. As a result, uniform and macroscale SiO2 microspheres deposition without coffee ring structure and SiO2 microspheres deposition with coffee ring structure are controlled by O2 plasma. This method provides a new way to tune coffee ring structure with smart surface and may be potentially useful for a range of application at material deposition and diagnosing diseases.
In the last decade, coffee ring effect is under research for their potential in a wide variety of applications, such as producing nanostructures [1, 2], diagnosing diseases [3], printed electronics [4] and other fields. Some research focuses on making use of coffee ring effect to modify ordered structure and sort colloid. Others research centers on how to solve the coffee ring problem to meet practical requirement. Since pioneering work from Deegan et al. reported the detailed investigation of solute transport during droplet drying [5], many methods have been developed to solve the coffee ring problem, such as tuning solvent composition [6], manipulating substrate temperature [7], controlling substrate wettability [8], modifying particle shape [9], using electrowetting [10] and utilizing polymer additives [11]. Despite these efforts, to our knowledge for the broad applications, there are few reports to date on adjustable coffee ring structure. Here, a simple, rapid and novel approach for controlling coffee ring structure is firstly reported via O2 plasma treatment.
Wettability is an important property of solid-gas interfaces [12, 13] and plays an important role on the evaporation behavior of the droplet placed on substrates. In general, for smooth hydrophilic and hydrophobic surface droplet evaporation follows the constantcontact-diameter mode and the constant-contact-angle mode, respectively. That is to say different wettability leads to different contact line (CL) behavior during droplet drying. Switching of surface wettability between superwetting and superantiwetting by external stimuli has been achieved by temperature, pH, optic, solvent, electric or mechanical force [14, 15]. Therefore, regulating coffee ring structure is performed on smart surface via responsive wettability. In this communication, coffee ring structure is controlled on polystyrene (PS) surface by O2 plasma. Uniform and macroscale 33 mm2 SiO2 microspheres deposition without coffee ring structure and 2 mm2 SiO2 microspheres deposition with coffee ring structure are demonstrated. O2 plasma treatment contributes to the wettability variation of PS surface from hydrophobic to hydrophilic. For hydrophilic PS surface the coffee ring structure is avoided relying on the motion of CL while SiO2 microspheres are left. The motion of the CL is caused due to the viscosity and Marangoni effect by means of the addition of polymer additives. For hydrophobic PS surface coffee ring structure still exists even with polymer additives because SiO2 microspheres transfer with the motion of the CL at the beginning stage of droplet evaporation and accumulate at the droplet edge at later stage with the pinning of the CL. This kind of non-contact real-time controllable coffee ring structure might inspire and facilitate the designs and applications in material deposition and biology fields. Moreover, the design principles disclosed in this work shall be a guidepost for the following researcher on manipulating coffee ring structure with smart liquid/solid interfaces with on-off switching wettability.
2.
Experimental
Materials: The average diameter of SiO2 microspheres used in our work was 972 nm measured by SEM with a calibrated length. The silicon wafers (100) were cut into 20 mm × 20 mm pieces, were soaked in the mixture of 98% H2SO4/30% H2O2 (volumetric ratio 7:3) for 20 min under boiling (caution: strong oxide), and then were rinsed with Milli-Q water (18.2 MΩ cm-1) and ethanol several times, at last were dried with N2 stream. Polyethyleneoxide (PEO, Mw=4 × 10⁶) and polystyrene (PS, Mw=2.8 × 10⁵) were purchased from Sigma Aldrich. All the above chemical reagents in our work were used as received.
Droplet deposition: Prior to each deposition, the latex suspension is sonicated for 30 min. In our experiments the volume of droplets is 2 μL controlled by a micropipette, with different polymer concentration. Furthermore, micrometer-sized SiO2 spheres in them are all 972 nm in diameter and 0.5 wt% in concentration. The weight fraction of 0.5 wt% is selected by taking into account subsequently easy quantification of the SiO2 microspheres density, and SiO2 microspheres are monolayer deposition after coffee ring effect is destroyed. The experiment is carried out at the room temperature of 23~25 8C and humidity of 35%~45%.
Characterization: SEM micrographs were examined using a JEOL JSM 6700F field-emission scanning electron microscope with an accelerating voltage of 5.0 kV. The samples were sputtered with a thin layer of Pt prior to imaging. Static emulsion droplet contact angles (CAs) were measured on a Krüss DSA100 (Krüss GmbH, Hamburg, Germany) drop shape analyzer at ambient temperature. The static CA was read by injecting 2 mL emulsion droplet. The average CA was obtained by measuring more than five different positions on the same sample. The optical microscope images were recorded using an Olympus fluorescence microscope (BX51). Viscosity data were recorded using a Julabo 536 10 Ubbelohde viscometer. The thickness of polystyrene film was determined using a Dektak 150 surface profiler (Veeco).
3.
Results and discussion
The experimental realization of the proposed tunable coffee ring structure has been accomplished. Fig. 1a shows uniform deposition of droplet containing SiO2 microspheres (972 nm in diameter and 0.5 wt% in concentration) without the coffee ring structure on PS surface via O2 plasma for 2 min, which is fabricated with adding polyethyleneoxide (PEO) additives (1.5 g/L in concentration, 2.5 in relative viscosity) according to our previous report [11]. The SiO2 microspheres were prepared by the Stöber method as mentioned in the Refs. [16-18]. The weight fraction of 0.5 wt% is selected by takinginto account subsequently easy quantification of the SiO2 microspheres density, and SiO2 microspheres are monolayer deposition. The droplet is 2 μL in volume. PS film is prepared by spinning coating with the rate of 3000 rpm/min and its thickness is ca. 2 μm. The coffee ring effect is ameliorated and disappears (Fig.S1 in Supporting information and Fig. 1a) due to introducing PEO additives. Firstly, the PEO additives increase droplet viscosity, which provides a large resistance to capillary flow. In other words, small amounts of SiO2 microspheres are deposited on droplet periphery, which is not advantageous to the pinning of the CL [19]. Secondly, Marangoni effect induced by PEO concentration inhomogeneity as solvent evaporating is the driving force to make the apparent CL recede [20, 21]. Thus, the coffee ring effect is prevented on hydrophilic PS surface.
图 1
图 1
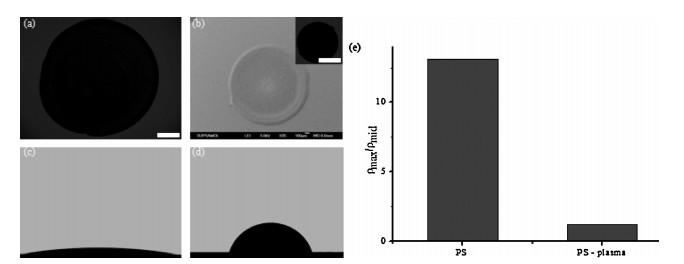
(a, b) Images of the final distribution of SiO2microspheres with PEO (1.5 g/L) additives on PS film with (a) and without (b) O2 plasma. The scale bar is 1 mmin (a) and (b). (c, d) Photographs of a flat emulsion droplet with a CA of 10° (c) and a spherical emulsion droplet with a CA of 70° (d) with PEO additives after and before the PS films were exposed to O2 plasma. (e) The maximum local density, ρmax, normalized by the density in the droplet centre, ρmid, on PS film with and without O2 plasma.
Figure 1.
(a, b) Images of the final distribution of SiO2microspheres with PEO (1.5 g/L) additives on PS film with (a) and without (b) O2 plasma. The scale bar is 1 mmin (a) and (b). (c, d) Photographs of a flat emulsion droplet with a CA of 10° (c) and a spherical emulsion droplet with a CA of 70° (d) with PEO additives after and before the PS films were exposed to O2 plasma. (e) The maximum local density, ρmax, normalized by the density in the droplet centre, ρmid, on PS film with and without O2 plasma.
In contrast with Fig. 1a, the inset of Fig. 1b exhibits the optical microscope image of SiO2 microspheres deposition with PEO additiveson PSsurfacewithoutO2plasmatreatment.However, the coffee ring effect does not vividly shown owing to the optical contrast. So, corresponding SEM image of SiO2 microspheres deposition is obtained in Fig. 1b. Obviously, it shows coffee ring structure exists with most of SiO2 microspheres distributed at droplet periphery. This will be verified in Fig. 1e.
We believe that the coffee ring structure is adjusted with wettability change via O2 plasma. The contact angle (CA) of droplet on PS surface after O2 plasma treament is unstable. So, firstly, the PS surface is managed by O2 plasma for 2 min. Then, in order to ensure the accuracy and comparability of experimental results, the experiments on PS surface are all performed after 30 min. To evaluate the wettability, Fig. 1c, d manifest the CAs of droplet with PEO additives on PS surface are 10° and 70° after and before O2 plasma. And the CAs of droplet without PEO additives on PS surface are 10° and 78° after and before O2 plasma shown in Fig.S2 in Supporting information. On PS surface the value of the CA for droplet with PEO additives is obviously lower than that for droplet without PEO additives. This result is in consistent with literature report and indicates introducing PEO additives will decrease droplet surface tension to result in low value of the CA [20, 21]. But, on hydrophilic PS surface PEO additives have no influence on the value of the CA due to small value of the CA.
In order to assess the coffee ring structure controlling by O2 plasma, the value of ρmax/ρmid in Fig. 1a, b is explored, as shown in Fig. 1e. Specifically, SEM image analysis enables counting of the number of particles, N, in an area set by ca. 13600 μm2, which is the area of SEM image with the magnification of 1000. The areal particle density ρ=N/A with A=13600 μm2. ρmax is the maximum value of ρ at the edge of droplet deposition and ρmid is the average value of ρ in the center of droplet deposition. Evidently, we can see that the value of ρmax/ρmid in Fig. 1e is 13.1 and 1.2, respectively. And it confirms switching coffee ring structure has been successfully accomplished via O2 plasma.
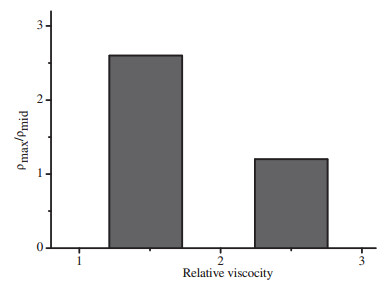
The coffee ring effect is prevented on hydrophilic PS surface (Fig. 1a). As has been confirmed in Fig. 2, we calculate and plot ρmax/ρmid. Clearly, Fig. 2 displays the values of ρmax/ρmid evidently vary with droplet relative viscosity. The value of ρmax/ρmid is 2.6 and 1.2 with corresponding droplet relative viscosity 1.47 and 2.5. This is in agreement with the optical microscope image in Fig. 1a and S1. The combination of the value of ρmax/ρmid (1.2) and the optical microscope image in Fig. 1a indicates inhibiting coffee ring structure is realized via PEO polymer additives on hydrophilic PS surface resulted from O2 plasma treatment.
图 2
图 2
The maximum local density, ρmax, normalized by the density in the droplet centre, ρmid, plotted for different relative viscosity.
Figure 2.
The maximum local density, ρmax, normalized by the density in the droplet centre, ρmid, plotted for different relative viscosity.
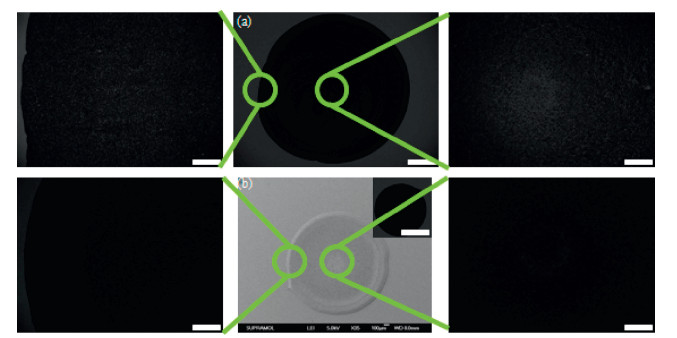
In addition, so as to explore the coffee ring structure controlling via O2 plasma in detail, the magnification optical microscope images of edge and centre of droplet deposition are determined in Fig. 3. From Fig. 3, we can see that SiO2 microspheres distribute uniformly at droplet edge and centre in Fig. 3a. In comparison, SiO2 microspheres aggregate at the CL and the number of SiO2 microspheres at droplet edge in Fig. 3b is larger than that in Fig. 3a. Moreover, in present case the optical microscope of the droplet centre in Fig. 3a, b do not distinctly display different owing to optical contrast. Understanding of SiO2 microspheres mechanism starts from analyzing the influence of wettability on the CL by measuring the optical microscope images and the motion of the CL during droplet evaporation, which will be discussed in following section.
图 3
图 3
(a, b) Optical microscope images of SiO2 microspheres deposition on PS film with PEO additives with (a) and without (b) O2 plasma. The scale bar is 1 mm in (a) and (b), and 250 mm in the others optical microscope images.
Figure 3.
(a, b) Optical microscope images of SiO2 microspheres deposition on PS film with PEO additives with (a) and without (b) O2 plasma. The scale bar is 1 mm in (a) and (b), and 250 mm in the others optical microscope images.
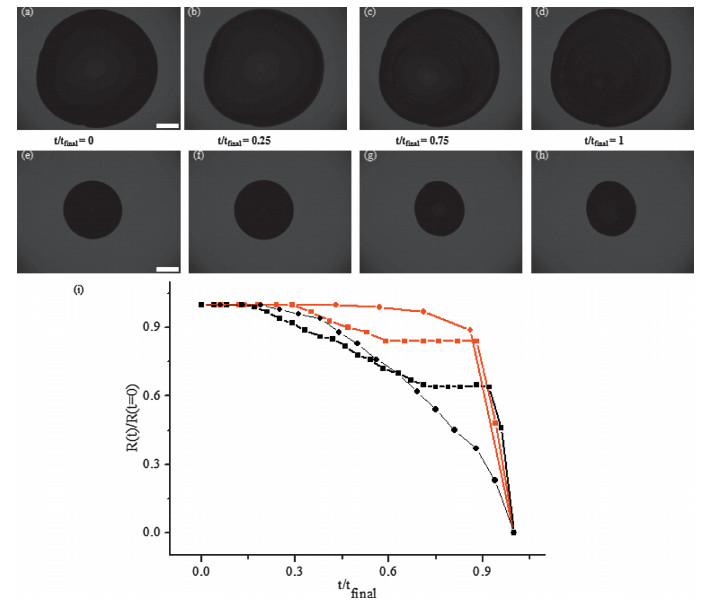
To explore the possible mechanism for manipulating the coffee ring structure by means of O2 plasma, typical optical micrograph sequence of droplet evaporation is characterized. And the optical microscope images are observed with a frame rate of one frame per minute. In this case, the time at which evaporation finishes, tfinal, is readily identified as the time when the droplet radius shrinks to zero. Fig. 4a-d clearly reveals that for droplet with PEO additives on hydrophilic PS surface the motion of the CL begins at the time of t/tfinal > 0.25, which is resulted from the small value of the CA and addition of PEO additives [11]. Whereas, on hydrophobic PS surface, Fig. 4e-h exhibit that the CL is basically pinning at early stage before t/tfinal=0.25 and after t/tfinal=0.75, moving at the time from t/tfinal=0.25 to t/tfinal=0.75. More importantly, SiO2 microspheres do not anchor on PS surface during the recession of the CL. These behaviors have been shown in Fig. 4i. Concretely, on hydrophilic PS surface for droplet without PEO additives the motion of the CL starts until at the time of t/tfinal=0.90 (red circle). That is to say the CL remains pinned until the final stage of evaporation, which is in consistent with literature report [6, 7]. However, the motion of the CL is at the time of t/tfinal=0.25 for droplet with PEO additives (black circle), which has been investigated in our previous work. On hydrophobic PS surface for droplet without PEO additives (red square) the pinning of the CL is about at the time between t/tfinal=0.60 and t/tfinal=0.90 at the entire evaporation process (red square). By contrast, for droplet with PEO additives the pinning of the CL is approximately at the time between t/tfinal=0.70 and t/tfinal=0.90 (black square). From above results we can see that on hydrophobic PS surface the time for the motion of the CL for droplet with polymer additives is longer than that for droplet without polymer additives, which may be attributed to Marangoni effect [20, 21].
图 4
图 4
(a-h) Experimental optical microscope images at different times (t/tfinal) with PEO (1.5 g/L in concentration) additives during the evaporation of a droplet of SiO2 microspheres suspension; shown are data for SiO2 microspheres on PS film with (a-d) and without (e-h) O2 plasma. The scale bar is 1 mm. (i) The radius, R, of droplets of different suspensions is plotted versus time, t, for evaporating droplets. Suspensions of SiO2 microspheres with PEO additives on PS film with (black circle) and without (black square) O2 plasma. Suspensions of SiO2 microspheres without PEO additives on PS film with (red circle) and without (red square) O2 plasma. To facilitate comparisons, the time is normalized by the time evaporation ends (tfinal), and R is normalized by the value of R at t=0 min.
Figure 4.
(a-h) Experimental optical microscope images at different times (t/tfinal) with PEO (1.5 g/L in concentration) additives during the evaporation of a droplet of SiO2 microspheres suspension; shown are data for SiO2 microspheres on PS film with (a-d) and without (e-h) O2 plasma. The scale bar is 1 mm. (i) The radius, R, of droplets of different suspensions is plotted versus time, t, for evaporating droplets. Suspensions of SiO2 microspheres with PEO additives on PS film with (black circle) and without (black square) O2 plasma. Suspensions of SiO2 microspheres without PEO additives on PS film with (red circle) and without (red square) O2 plasma. To facilitate comparisons, the time is normalized by the time evaporation ends (tfinal), and R is normalized by the value of R at t=0 min.
In summary, controllable macroscale coffee ring structure has been demonstrated on PS surface by employing O2 plasma with the presence of PEO additives. O2 plasma has allowed the wettability variation of PS surface from hydrophobic to hydrophilic. On hydrophilic PS surface the uniform SiO2 microspheres deposition is achieved depending on PEO additives, which endows the increasing relative viscosity and Marangoni effect to make the CL recede with SiO2 microspheres left during droplet evaporating. On the contrary, on hydrophobic PS surface, SiO2 microspheres do not adhere to PS surface at early motion of the CL and aggregate at droplet edge to form coffee ring structure at following pinning of the CL. Therefore, we believe that this present system will open up new opportunities for manipulating coffee ring structure by combining smart surface.
Acknowledgments
This work is supported by the National Nature Science Foundation (Nos. 91123031, 20921003, 51403076, 21103112), and the National Basic Research Program of China (No. 2012CB933802).
Anyfantakis M., Baigl D.. Dynamic photocontrol of the coffee-ring effect with optically tunable particle stickiness[J]. Angew. Chem. Int. Ed.,
2014, 53:
14077-14081.
doi: 10.1002/anie.v53.51
[2]
Xie Z.Y., Li L.L., Liu P.M.. Self-assembled coffee-ring colloidal crystals for structurally colored contact lenses[J]. Small,
2015, 11:
926-930.
doi: 10.1002/smll.v11.8
[3]
Wen J.T., Ho C.M., Lillehoj P.B.. Coffee ring aptasensor for rapid protein detection[J]. Langmuir,
2013, 29:
8440-8446.
doi: 10.1021/la400224a
[4]
Cui L.Y., Li Y.F., Wang J.X.. Fabrication of large-area patterned photonic crystals by ink-jet printing[J]. J. Mater. Chem.,
2009, 19:
5499-5502.
[5]
Deegan R.D., Bakajin O., Dupont T.F.. Capillary flow as the cause of ring stains from dried liquid drops[J]. Nature,
1997, 389:
827-829.
doi: 10.1038/39827
[6]
Wu J.T., Hsu S.L.C., Tsai M.H., Hwang W.S.. Inkjet printing of low-temperature cured silver patterns by using AgNO3/1-dimethylamino-2-propanol inks on polymer substrates[J]. J. Phys. Chem. C,
2011, 115:
10940-10945.
doi: 10.1021/jp200972y
[7]
Girard F., Antoni M., Faure S., Steinchen A.. Influence of heating temperature and relative humidity in the evaporation of pinned droplets[J]. Colloids Surf. A:Physicochem. Eng. Aspects,
2008, 323:
36-49.
doi: 10.1016/j.colsurfa.2007.12.022
[8]
Park J., Moon J., Shin H., Wang D.K., Park M.. Direct-write fabrication of colloidal photonic crystal microarrays by ink-jet printing[J]. J. Colloid Interface Sci.,
2006, 298:
713-719.
doi: 10.1016/j.jcis.2006.01.031
[9]
Yunker P.J., Still T., Lohr M.A., Yodh A.G.. Suppression of the coffee-ring effect by shape-dependent capillary interactions[J]. Nature,
2011, 476:
308-311.
doi: 10.1038/nature10344
[10]
Eral H.B., Augustine D.M., Duits M.H.G., Mugele F.. Suppressing the coffee stain effect:how to control colloidal self-assembly in evaporating drops using electrowetting[J]. Soft Matter,
2011, 7:
4954-4958.
doi: 10.1039/c1sm05183k
[11]
Cui L.Y., Zhang J.H., Zhang X.M.. Suppression of the coffee ring effect by hydrosoluble polymer additives[J]. ACS Appl. Mater. Interfaces,
2012, 4:
2775-2780.
doi: 10.1021/am300423p
[12]
Wang J.X., Zhang Y.Z., Wang S.T., Song Y.L., Jiang L.. Bioinspired colloidal photonic crystals with controllable wettability[J]. Acc. Chem. Res.,
2011, 44:
405-415.
doi: 10.1021/ar1001236
[13]
Xu L.Y., Tong F.Q., Lu X.M., Lu K., Lu Q.H.. Multifunctional polypyrene/silica hybrid coatings with stable excimer fluorescence and robust superhydrophobicity derived from electrodeposited polypyrene films[J]. J. Mater. Chem. C,
2015, 3:
2086-2092.
doi: 10.1039/C4TC02653E
[14]
Song W.L.. Adhesion switch on a gecko-foot inspired smart nanocupule surface[J]. Nanoscale,
2014, 6:
13435-13439.
doi: 10.1039/C4NR04090B
[15]
Su B., Guo W., Jiang L.. Learning from nature:binary cooperative complementary nanomaterials[J]. Small,
2015, 11:
1072-1096.
doi: 10.1002/smll.v11.9-10
[16]
Stöber W., Fink A., Bohn E.. Controlled growth of monodisperse silica spheres in the micron size range[J]. J. Colloid Interface Sci.,
1968, 26:
62-69.
doi: 10.1016/0021-9797(68)90272-5
[17]
He D.G., He X.X., Wang K.M., Zhao Y.X.. A facile route for shape-selective synthesis of silica nanostructures using poly-L-lysine as template[J]. Chin. Chem. Lett.,
2013, 24:
99-102.
doi: 10.1016/j.cclet.2013.01.038
[18]
Wang X., Yang Y.J., Ma Y., Yao J.N.. Controlled synthesis of multi-shelled transition metal oxide hollow structures through one-pot solution route[J]. Chin. Chem. Lett.,
2013, 24:
1-6.
doi: 10.1016/j.cclet.2013.01.017
[19]
Sangani A.S., Lu C., Su K., Schwarz J.A.. Capillary force on particles near a drop edge resting on a substrate and a criterion for contact line pinning[J]. Phys. Rev. E,
2009, 80:
011603.
[20]
Kajiya T., Monteux C., Narita T., Lequeux F., Doi M.. Contact-line recession leaving a macroscopic polymer film in the drying droplets of water-poly (N, N-dimethylacrylamide) (PDMA) solution[J]. Langmuir,
2009, 25:
6934-6939.
doi: 10.1021/la900216k
[21]
Kajiya T., Kobayashi W., Okuzono T., Doi M.. Controlling profiles of polymer dots by switching between evaporation and condensation[J]. Langmuir,
2010, 26:
10429-10432.
doi: 10.1021/la1016388
Figure 1
(a, b) Images of the final distribution of SiO2microspheres with PEO (1.5 g/L) additives on PS film with (a) and without (b) O2 plasma. The scale bar is 1 mmin (a) and (b). (c, d) Photographs of a flat emulsion droplet with a CA of 10° (c) and a spherical emulsion droplet with a CA of 70° (d) with PEO additives after and before the PS films were exposed to O2 plasma. (e) The maximum local density, ρmax, normalized by the density in the droplet centre, ρmid, on PS film with and without O2 plasma.
Figure 3
(a, b) Optical microscope images of SiO2 microspheres deposition on PS film with PEO additives with (a) and without (b) O2 plasma. The scale bar is 1 mm in (a) and (b), and 250 mm in the others optical microscope images.
Figure 4
(a-h) Experimental optical microscope images at different times (t/tfinal) with PEO (1.5 g/L in concentration) additives during the evaporation of a droplet of SiO2 microspheres suspension; shown are data for SiO2 microspheres on PS film with (a-d) and without (e-h) O2 plasma. The scale bar is 1 mm. (i) The radius, R, of droplets of different suspensions is plotted versus time, t, for evaporating droplets. Suspensions of SiO2 microspheres with PEO additives on PS film with (black circle) and without (black square) O2 plasma. Suspensions of SiO2 microspheres without PEO additives on PS film with (red circle) and without (red square) O2 plasma. To facilitate comparisons, the time is normalized by the time evaporation ends (tfinal), and R is normalized by the value of R at t=0 min.

 下载:
下载:

 下载:
下载:


