 Figure Scheme 1.
Structure of aroylhydrazone H2L
Figure Scheme 1.
Structure of aroylhydrazone H2L
Citation:
LI Ling, LÜ Kai-Wen, LI Yun-Tong, JIANG Gui-Fa, XIN Yu, YE Lei, ZHANG Yan, LIU Hui, SHANG Chao-Nan, YOU Zhong-Lu. Syntheses, Crystal Structures and Insulin-like Activity of Maltolato-and Ethylmaltolato-Coordinated Oxovanadium (Ⅴ) Complexes Derived from 4-Fluoro-N'-(3-ethoxy-2-hydroxybenzylidene) benzohydrazide[J]. Chinese Journal of Inorganic Chemistry,
2017, 33(5): 905-912.
doi:
10.11862/CJIC.2017.094

基于4-氟-N'-(3-乙氧基-2-羟基苯亚甲基) 苯甲酰肼的甲基麦芽酚和乙基麦芽酚配位的氧钒 (Ⅴ) 配合物的合成、晶体结构及其类胰岛素活性
摘要:
制备了一个芳酰腙化合物4-氟-N'-(3-乙氧基-2-羟基苯亚甲基) 苯甲酰肼 (H2L).利用H2L和VO (acac)2分别与甲基麦芽酚 (mat) 和乙基麦芽酚 (Emat) 在甲醇中反应, 得到了2个配合物[VO (L)(mat)](1) 和[VO (L)(Emat)](2).通过元素分析、红外光谱、紫外可见光谱和核磁共振氢谱表征了这些化合物的结构.通过单晶X射线衍射进一步确定了化合物的结构.芳酰腙配体以二价阴离子的方式通过酚羟基氧、亚胺基氮和烯醇氧原子与钒原子进行配位.在每个配合物中, 钒都采取八面体配位构型.将配合物通过灌胃对正常的大鼠和四氧嘧啶糖尿病大鼠给药2周时间, 结果表明这两个配合物在剂量为10.0和20.0 mgV·kg-1时可以显著降低四氧嘧啶糖尿病大鼠的血糖值, 而对于正常大鼠的血糖值却没有改变.
English
Syntheses, Crystal Structures and Insulin-like Activity of Maltolato-and Ethylmaltolato-Coordinated Oxovanadium (Ⅴ) Complexes Derived from 4-Fluoro-N'-(3-ethoxy-2-hydroxybenzylidene) benzohydrazide
Abstract:
A new aroylhydrazone compound 4-fluoro-N'-(3-ethoxy-2-hydroxybenzylidene) benzohydrazide (H2L) was prepared. Reaction of H2L and VO (acac)2 with maltol (mat) and ethylmaltol (Emat), respectively, in methanol afforded the complexes[VO (L)(mat)] (1) and[VO (L)(Emat)] (2). Both H2L and the oxovanadium complexes were characterized by elemental analysis, IR, UV-Vis and 1H NMR spectra. The structures of the compounds were further confirmed by single crystal X-ray diffraction. The aroylhydrazone ligand, in its dianionic form, coordinated to the V atoms through the phenolate oxygen, imino nitrogen and enolate oxygen. The maltol and ethylmaltol ligands coordinated to the V atoms through the carbonyl oxygen and deprotonated hydroxyl oxygen. The V atom in each complex is in octahedral coordination. The complexes were administered intragastrically to both normal and alloxan-diabetic mice for two weeks. The biological activity results show that the complexes at doses of 10.0 and 20.0 mgV·kg-1, can significantly decrease the blood glucose level in alloxan-diabetic mice, but the blood glucose level in the treated normal mice was not altered.
-
Key words:
- aroylhydrazone
- / oxovanadium (Ⅴ) complex
- / crystal structure
- / insulin-like activity
-
Inorganic vanadium salts and vanadium complexes with various ligands have been reported to possess insulin-mimetic activities[1-4]. Studies indicated that vanadium compounds improve not only hypergly-cemia in human subjects and animal models of type Ⅰ diabetes but also glucose homeostasis in type Ⅱ diabetes[5-6]. However, the inorganic vanadium salts are considered as less active and more toxic. In order to reduce the side effects of inorganic vanadium salts, vanadium complexes with various organic ligands have received particular attention and demonstrated to be effective[7-9]. Among the complexes, bis (maltolato) oxov-anadium (Ⅳ) (BMOV)[10], synthesized by simple metathesis of vanadyl sulfate trihydrate and maltol (3-hydroxy-2-methyl-4-pyrone), has important and inter-esting insulin-enhancing activity[11]. Yet, there are some side effects of BMOV, principally diarrhea[12]. Schiff bases play important role in biological chemistry. Several vanadium complexes derived from Schiff bases have shown to normalize blood glucose level with high efficiency and low toxicity, even at low concentra-tion[13-14]. Schiff bases with hydrazone type are of particular interest due to their biological properties[15-18]. In view of the increasing importance of vanadium complexes with hydrazone type Schiff bases, we report herein the synthesis, characterization, and insulin-enhancing activities of a maltolato-coordinated and an ethylmaltolato-coordinated oxovanadium (Ⅴ) complexes derived from the aroylhydrazone compound 4-fluoro-N'-(3-ethoxy-2-hydroxybenzylidene) benzohydra-zide (H2L; Scheme 1).
Figure Scheme 1.
Structure of aroylhydrazone H2L
1 Experimental
1.1 Materials and measurement
Starting materials, reagents and solvents were purchased from commercial suppliers with AR grade, and were used without purification. Elemental analyses were performed on a Perkin-Elmer 240C elemental analyzer. IR spectra were recorded on a Jasco FT/IR-4000 spectrometer as KBr pellets in 4 000~200 cm-1 region. UV-Vis spectra were recorded on a Perkin-Elmer Lambda 900 spectrometer. 1H NMR spectra for H2L and the complexes were recorded on a Bruker spectrometer at 300 MHz. X-ray diffraction was carried out on a Bruker SMART 1000 CCD diffracto-meter. High-resolution mass spectrum was recorded with ESI (electrospray ionization) on a Thermo Scientific LTQ Orbitrap XL in the positive mode.
1.2 Synthesis of H2L
3-Ethoxy-2-hydroxybenzaldehyde (1.66 g, 0.01 mol) and 4-fluorobenzohydrazide (1.54 g, 0.01 mol) were reacted in 30 mL of methanol. The mixture was stirred at room temperature for 1 h to give a clear colorless solution. The solution was allowed to stand in air for a few days, which gained colorless block-shaped crystals of H2L·H2O. The crystals were isolated by filtration, washed three times with cold methanol and dried in air. Yield: 65%. Anal. Calcd. for C16H17 FN2O4(%): C, 60.0 H, 5.3; N, 8.7. Found (%): C, 59.8; H, 5.4; N, 8.9. HRMS (ESI): m/z Calcd. for C16H15 FN2O3 303.1139; Found: 303.1139. 1H NMR (300 MHz, DMSO-d6): δ 12.09 (s, 1H, OH), 10.91 (s, 1H, NH), 8.65 (s, 1H, CH=N), 8.03 (q, 2H, ArH), 7.39 (t, 2H, ArH), 7.15 (d, 1H, ArH), 7.03 (d, 1H, ArH), 6.85 (t, 1H, ArH), 4.08, (q, 2H, CH2), 1.36 (t, 3H, CH3).
1.3 Syntheses of the complexes
The two complexes were prepared by the same method as described. Equimolar quantities (1.0 mmol each) of VO (acac)2 (0.27 g) and H2L (0.30 g) dissolved in methanol (30 mL) were added to a methanolic solution (20 mL) of maltol for 1 and ethylmaltol for 2, respectively. The mixture was stirred at room temperature for 30 min to give a brown solution. The resulting solution was allowed to stand in air for a few days. Brown block-shaped crystals of the complex were isolated by filtration, washed three times with cold methanol and dried in air.
Complex 1: Yield: 63%. Anal. Calcd. for C22H18 FN2O7V (%): C, 53.7; H, 3.7; N, 5.7. Found (%): C, 53.9; H, 3.6; N, 5.6. 1H NMR (300 MHz, DMSO-d6): δ 9.17 (s, 1H, OCH=CH), 8.45 (s, 1H, CH=N), 7.92~7.87 (m, 2H, ArH), 7.43~7.26 (m, 4H, ArH), 7.00 (t, 1H, ArH), 6.70 (d, 1H, OCH=CH), 4.08 (q, 2H, CH2), 2.65 (s, 3H, CH3), 1.30 (t, 3H, CH3).
Complex 2: Yield: 70%. Anal. Calcd. for C23H20 FN2O7V (%): C, 54.6; H, 4.0; N, 5.5. Found (%): C, 54.5; H, 4.1; N, 5.7. 1H NMR (300 MHz, DMSO-d6): δ 9.17 (s, 1H, OCH=CH), 8.47 (s, 1H, CH=N), 7.92~7.87 (m, 2H, ArH), 7.43~7.25 (m, 4H, ArH), 7.00 (t, 1H, ArH), 6.70 (d, 1H, OCH=CH), 4.07 (q, 2H, CH2), 3.03 (q, 2H, CH2), 1.35~1.25 (m, 6H, CH3).
1.4 X-ray crystallography
Diffraction intensities for H2L and the complexes were collected at 298(2) K using a Bruker SMART 1000 CCD area-detector diffractometer with Mo Kα radiation (λ=0.071 073 nm). Collected data were reduced with SAINT[19], and multi-scan absorption correction was performed using SADABS[20]. Structures of the compo-unds were solved by direct methods and refined against F2 by full-matrix least-squares method using SHELXTL[21]. All non-hydrogen atoms were refined anisotropically. The hydrogen atoms attached to N and O atoms in H2L were located from a difference Fourier map and refined isotropically, with N-H and O-H distances restrained to 0.090(1) and 0.085(1) nm, respectively. The remaining hydrogen atoms were placed in calculated positions and constrained to ride on their parent atoms. Crystallographic data for H2L·H2O and the complexes are summarized in Table 1. Selected bond lengths and angles are given in Table 2.
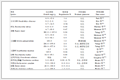 Table 1.
Crystallographic and experimental data for H2L·H2O and the complexes
Table 1.
Crystallographic and experimental data for H2L·H2O and the complexes
Compound H2L-H2O 1 2 Formula C17H17FN2O4 C17H15BrN3O6V C17H15BrN3O6V Molecular weight 320.3 488.2 488.2 Crystal system Monoclinic Triclinic Triclinic Space group P21/c P1 P1 a / nm 0.937 0(1) 0.778 89(7) 0.778 89(7) b /nm 1.308 5(1) 0.869 61(8) 0.869 61(8) c / nm 1.240 4(1) 1.524 2(1) 1.524 2(1) α/(°) 90 94.078(3) 94.078(3) β/(°) 96.367(2) 98.547(3) 98.547(3) γ/(°) 90 110.424(3) 110.424(3) V / nm3 1.511 4(2) 0.948 3(2) 0.948 3(2) Z 4 2 2 Dc / (g·cm-3) 1.408 1.710 1.710 μ(Mo Kα) /mm-1 0.110 2.670 2.670 F(000) 672 488 488 Independent reflections 2 667 3 490 3 490 Observed reflections [I≥2σ(I)] 1 815 3 004 3 004 Parameters 219 258 258 Restraints 4 1 1 Goodness-of-fit on F2 1.040 1.053 1.053 R1, wR2[I≥2σ(I)] 0.040 6, 0.086 3 0.040 1, 0.095 4 0.040 1, 0.095 4 R1, wR2 (all data)* 0.076 3, 0.100 5 0.048 4, 0.100 7 *R1=Fo-Fc/Fo, wR2=[∑w(Fo2-Fc2)/∑w(Fo2)2]1/2 Table 1. Crystallographic and experimental data for H2L·H2O and the complexes
Table 2.
Selected bond lengths (nm) and angles (°) for H2L·H2O and the complexes
H2L C7-N1 1.270(2) N1-N2 1.383(2) N2-C8 1.342(2) C8-O3 1.224(2) 1 V1-O1 0.184 6(5) V1-O2 0.192 3(5) V1-03 0.226 7(6) V1-O4 0.185 5(5) V1-O6 0.157 2(6) V1-N1 0.205 2(7) O6-V1-O1 99.6(3) O6-V1-O4 99.9(3) O1-V1-O4 102.6(2) O6-V1-O2 99.8(3) O1-V1-O2 152.1(2) O4-V1-O2 93.6(2) O6-V1-N1 95.8(3) O1-V1-N1 83.4(3) O4-V1-N1 161.9(2) O2-V1-N1 74.9(2) O6-V1-O3 176.8(3) O1-V1-O3 81.6(2) O4-V1-03 76.8(2) O2-V1-O3 80.1(2) N1-V1-O3 87.3(2) 2 V1-O1 0.185 2(4) V1-O2 0.193 1(3) V1-O3 0.226 5(4) V1-O4 0.187 0(3) VI-O6 0.157 9(3) V1-N1 0.207 1(4) O6-V1-O1 99.11(17) O6-V1-O4 99.40(17) O1-V1O4 102.91(15) O6-V1-O2 100.17(17) O1-V1-O2 152.23(16) O4-V1-O2 93.45(14) O6-V1-N1 95.14(17) Ol-Vl-Nl 83.65(16) O4-V1-N1 162.82(16) O2-V1-N1 74.89(16) O6-V1-O3 176.71(16) O1-V1-O3 80.97(14) O4-V1-O3 77.41(15)| O2-V1-O3 80.91(15) N1-V1-O3 88.14(15) Table 2. Selected bond lengths (nm) and angles (°) for H2L·H2O and the complexesCCDC: 1522005, H2L·H2O; 1005095, 1; 1005096, 2.
1.5 Glucose-lowering assay
Male Kunming mice, weighing 25~32 g, were obtained from Experimental Animal Center, Shandong Lukang Pharmaceutical Co., Ltd of China, and maintained on a light/dark cycle. All animals were allowed free access to food and water. Temperature and relative humidity were maintained at 24 ℃ and 50%. Mice were acclimatized for seven days prior to induction of diabetes. Diabetes was induced by a single intra-peritoneal injection of freshly prepared alloxan (200 mg·kg-1 body weight) in 0.9% saline. The control mice were injected with an equal volume of vehicle. After seven days, blood was collected from the tail vein and serum samples were analyzed for blood glucose. Animals showing fasting (12 h) blood glucose higher than 11.1 mmol·L-1 were considered to be diabetic and used for the study.
The experimental animals were randomly divided into eight groups with four mice each according to the blood glucose. Group 1, normal control group: normal mice treated with 0.5% carboxymethyl cellulose (CMC). Groups 2 and 3, treated normal group: normal mice treated with 20 mgV·kg-1 vanadium complexes. Group 4, diabetic control group: alloxan diabetic mice treated with 0.5% CMC. Groups 5~8, treated diabetic group: alloxan diabetic mice treated with vanadium complexes at doses of 10 and 20 mgV·kg-1 by intragastrical administration. The complexes were administered as suspensions in 0.5% CMC. The substances were administered intragastrically once a day at the volume of 10 mL·kg-1 for two weeks.
Throughout the experimental period, the body weight of mice was monitored daily. Blood samples were obtained from the tail vein of the mice and blood glucose levels were determined with an Accu-Chek blood glucose monitor (Roche Diagnostics GmbH, Mannheim, Germany).
2 Results and discussion
2.1 Crystal structure description of H2L·H2O
Fig. 1 gives a perspective view of H2L·H2O together with the atomic labeling system. The asymmetric unit of the compound contains an aroylhydrazone molecule and a lattice water molecule. The aroylhydrazone molecule adopts E configuration with respect to the methylidene unit. The distance of the C7-N1 methyli-dene bond (0.127 0(2) nm) confirms it as a typical double bond. The shorter distance of the C8-N2 bond (0.134 2(2) nm) and the longer distance of the C8-O3 bond (0.122 4(2) nm) for the-C (O)-NH-unit than usual, suggest the presence of conjugation effect in the molecule. The bond lengths in the compound are within normal values[18]. The dihedral angle between the two benzene rings is 23.9(3)°. In the crystal structure of the compound, adjacent two aroylhydrazone molecules are linked through two water molecules via intermolecular hydrogen bonds, to form a dimer (Table 3, Fig. 2).
 Figure 1.
Perspective view of the molecular structure of H2L·H2O with the atom labeling scheme
Table 3.
Hydrogen bond parameters for H2L·H2O
Figure 1.
Perspective view of the molecular structure of H2L·H2O with the atom labeling scheme
Table 3.
Hydrogen bond parameters for H2L·H2O
D-H …A d(D-H) / nm d(H-A)/nm d(D …A) / nm ∠D-H…A/(.) O1-H1-N1 0.082 0.202 0.273 1(2) 144 O1-H1…O4ⅰ 0.082 0.262 0.305 8(2) 115 O4-H4B-O3 ⅱ 0.085(1) 0.187(1) 0.272 0(2) 169(2) O4-H4A …O1ⅲ 0.085(1) 0.219(1) 0.295 1(2) 150(2) N2-H2-O4ⅳ 0.090(1) 0.208(1) 0.297 2(2) 174(2) Symmetry codes: ⅰ-1+x, -1+y, z; ⅱ 1+x, 1+y, z; ⅲ 1-x, 1-y, 1-z; ⅳ 1-x, -1/2+y, 3/2-z. Table 3. Hydrogen bond parameters for H2L·H2O Figure 2.
Molecular packing diagram of H2L·H2O
Figure 2.
Molecular packing diagram of H2L·H2O
2.2 Crystal structures description of the complexes
The molecular structures of complexes 1 and 2 are shown in Fig. 3 and 4, respectively. X-ray crystall-ography reveals that both complexes are structurally similar, except for the secondary ligands, viz. maltolate for 1 and ethylmaltolate for 2. In each complex, the aroylhydrazone ligand coordinates to the V atom through phenolate O, imino N, and enolate O atoms. The V atoms in both complexes are in octahedral coordination, with the three donor atoms of the aroylhydrazone ligand and the deprotonated hydroxyl O atom of the maltolate (or ethylmaltolate) ligand defining the equatorial plane, and with one oxo O atom and carbonyl O atom of the maltolate (or ethylmaltolate) ligand occupying the axial positions. The distances between atoms V1 and O6 are 0.157~0.158 nm, indicating that they are typical V=O bonds. The coordinate bond lengths in the complexes are comparable to each other, and also similar to those observed in mononuclear oxovanadium complexes with octahedral coordination[22-24]. Distortion of the octahed-ral coordination can be observed from coordination bond angles, ranging from 74.9(2)° to 102.9(2)° for the perpendicular angles, and from 152.1(2)° to 176.8(3)° for the diagonal angles. The displacement of V atoms from the equatorial planes towarding the axial oxo O atoms are 0.029 6(2) nm for 1 and 0.028 6(2) nm for 2. The dihedral angles between the two benzene rings are 36.6(3)° for 1 and 46.8(3)° for 2.
 Figure 3.
Perspective view of the molecular structure of complex 1 with the atom labeling scheme
Figure 3.
Perspective view of the molecular structure of complex 1 with the atom labeling scheme
 Figure 4.
Perspective view of the molecular structure of complex 2 with the atom labeling scheme
Figure 4.
Perspective view of the molecular structure of complex 2 with the atom labeling scheme
The coordination of H2L to V atoms results the change of related bonds. The bond length of C7-N1 in H2L is 0.127 nm, which is shorter than C7-N1 bonds (0.128~0.130 nm) in the complexes. The same phenomenon is observed for N1-N2 bonds in H2L and the complexes. The N2-C8 bond in H2L is much longer than those in the complexes, and the C8-O2 bond in H2L is much shorter than those in the complexes, which indicates the change of N-C-O groups from carbonyl in H2L to enolate during coordination.
2.3 IR and UV-Vis spectra
The weak and broad absorption bands centered at 3 383 cm-1 in the spectrum of H2L substantiates indicate the presence of phenol group, which is absent in the complexes. The sharp band indicative of N-H vibration is located at 3 234 cm-1 in the spectrum of H2L. The typical strong ν(C=O) (1 652 cm-1) and the sharp ν(N-H) absorption bands of the free hydrazone ligand are absent in the complexes, indicating enolisation of the amide functionality and subsequent proton replacement by V atoms. The strong absorption bands at 1 605 cm-1 for H2L and 1 610 cm-1 for the complexes are assigned to azomethine ν(C=N)[25]. Typical absorption at 980 cm-1 can be assigned to V=O vibration[26].
Electronic spectra of H2L and the complexes were recorded in methanol and acetonitrile (10 μmol·L-1), respectively, in the range of 200~600 nm. In the UV-Vis region the complexes show bands centered at 350 nm and weak bands at 466 nm. The weak bands are attributed to intramolecular charge transfer trans-itions from the pπ orbital on the nitrogen and oxygen to the empty d orbitals of the metal[27]. The intense bands observed at 280 nm for the complexes and 299 nm for H2L are assigned to intraligand π-π* transitions[27].
2.4 Effects of the complexes on blood glucose in both normal and alloxan-diabetic mice
The complexes were administered intragastrically to both normal and alloxan-diabetic mice for two weeks. The results (Table 4) showed that the complexes had blood glucose-lowering effect at doses of 10.0 and 20.0 mgV·kg-1, which can signicantly decrease the blood glucose level in alloxan-diabetic mice. The blood glucose level in the treated normal mice (20.0 mgV·kg-1 by intragastrical administration for two weeks) was not altered as compared with the untreated normal mice. The alloxan-diabetic mice exhibited significant hyperglycemia. After two-week administra-tion with the complexes, the blood glucose level was decreased compared with the diabetic control group. It is obvious that the glucose-lowering effect of the complexes is similar to each other. During the experiment, the mean body weight in alloxan-diabetic mice was lower than normal mice. Two-week admin-istration of the complexes had no effect on the body weight in the diabetic group, compared with the diabetic control group (Table 5).
Table 4.
Effect of the vanadium complexes on blood glucose levels in both normal and diabetic mice
Group Dose / (mgv·kg-1) Blood glucose* / (mmol·L-1) Beginning 1st week 2nd week 3rd week Normal mice CMC 5.8±0.6 6.1±1.2 6.0±1.1 5.9±1.0 Normal mice+1 20.00 5.9±1.0 6.0±0.9 5.9±1.3 5.8±1.2 Normal mice+2 20.00 6.0±0.8 6.0±1.1 6.1 ±0.9 6.0±1.4 Alloxan mice CMC 16.1±1.9 15.7±2.0 15.9±2.1 15.0±1.6 Alloxan mice+1 20.00 14.0±1.7 6.3±1.2 6.7±1.5 7.8±2.0 Alloxan mice+1 10.00 15.0±1.4 7.3±0.8 8.1±1.2 8.7±1.7 Alloxan mice+2 20.00 14.2±1.3 6.1 ±0.7 6.5±1.0 7.9±1.4 Alloxan mice+2 10.00 14.9±1.7 7.1±1.1 8.0±1.5 8.5±1.5 * Data were expressed as mean±standard deviations for six mice in each group. Table 4. Effect of the vanadium complexes on blood glucose levels in both normal and diabetic mice
Table 5.
Effects of the complexes on body weight of both normal and diabetic mice
Group Dose / (mgv·kg-1) Body weight* / g Beginning 1st week 2nd week 3rd week Normal mice CMC 30.5±2.1 32.9±2.5 34.5±3.0 36.6±3.2 Normal miee+1 20.00 30.1±1.8 32.5±2.0 34.6±2.6 37.1±2.9 Normal miee+2 20.00 30.6±2.0 32.7±2.2 34.9±2.7 37.5±3.0 Alloxan mice CMC 27.3±1.1 28.0±1.2 29.1±1.5 30.0±2.2 Alloxan mice+1 20.00 27.5±1.3 28.7±1.5 30.1 ±2.1 32.4±3.1 Alloxan mice+1 10.00 27.1±1.5 28.3±1.8 29.4±2.0 31.0±2.7 Alloxan mice+2 20.00 28.0±1.2 29.1±1.5 30.2±1.8 32.6±2.5 Alloxan mice+2 10.00 27.5±1.3 28.6±1.9 30.1 ±2.0 31.3±2.9 * Data were expressed as mean±standard deviations for six mice in each group. Table 5. Effects of the complexes on body weight of both normal and diabetic mice3 Conclusions
A new aroylhydrazone and its maltolato-and ethylmaltolato-coordinated oxovanadium (Ⅴ) complexes were synthesized, characterization and their crystal structures were analyzed. The aroylhydrazone coor-dinates to V atoms through phenolate oxygen, imino nitrogen and enolate oxygen. The complexes have effective insulin-like activity on alloxan-diabetic mice.
-
-
[1]
Pillai S I, Subramanian S P, Kandaswamy M. Eur. J. Med. Chem., 2013, 63:109-117 doi: 10.1016/j.ejmech.2013.02.002
-
[2]
Smee J J, Epps J A, Ooms K, et al. J. Inorg. Biochem., 2009, 103:575-584 doi: 10.1016/j.jinorgbio.2008.12.015
-
[3]
Sanna D, Micera G, Garribba E. Inorg. Chem., 2013, 52:11975-11985 doi: 10.1021/ic401716x
-
[4]
He L, Wang X S, Zhao C, et al. Metallomics, 2014, 6:1087-1095 doi: 10.1039/c4mt00021h
-
[5]
Crans D C, Trujillo A M, Pharazyn P S, et al. Coord. Chem. Rev., 2011, 255:2178-2192 doi: 10.1016/j.ccr.2011.01.032
-
[6]
Sheela A, Roopan S M, Vijayaraghavan R. Eur. J. Med. Chem., 2008, 43:2206-2210 doi: 10.1016/j.ejmech.2008.01.002
-
[7]
Zhang Y, Yang X D, Wang K, et al. J. Inorg. Biochem., 2006, 100:80-87 doi: 10.1016/j.jinorgbio.2005.10.006
-
[8]
Dornyei A, Marcao S, Pessoa J C, et al. Eur. J. Inorg. Chem., 2006, 18:3614-3621
-
[9]
Haratake M, Fukunaga M, Ono M, et al. J. Biol. Inorg. Chem., 2005, 10:250-258 doi: 10.1007/s00775-005-0634-8
-
[10]
McNeill J H, Yuen V G, Hoveyda H R, et al. J. Med. Chem., 1992, 35:1489-1491 doi: 10.1021/jm00086a020
-
[11]
Yuen V G, Orvig C, Thompson K H, et al. Can. J. Physiol. Pharmacol., 1993, 71:270-276 doi: 10.1139/y93-042
-
[12]
Fujimoto S, Fujii K, Yasui H. J. Clin. Biochem. Nutr., 1997, 23:113-129 doi: 10.3164/jcbn.23.113
-
[13]
Nejo A A, Kolawole G A, Opoku A R, et al. J. Coord. Chem., 2009, 62:3411-3424 doi: 10.1080/00958970903104327
-
[14]
Xie M J, Yang X D, Liu W P, et al. J. Inorg. Biochem., 2010, 104:851-857 doi: 10.1016/j.jinorgbio.2010.03.018
-
[15]
Rajitha G, Prasad K V S R G, Umamaheswari A, et al. Med. Chem. Res., 2014, 23:5204-5214 doi: 10.1007/s00044-014-1091-0
-
[16]
El-Sayed M A A, Abdel-Aziz N I, Abdel-Aziz A A M, et al., Bioorg. Med. Chem., 2011, 19:3416-3424 doi: 10.1016/j.bmc.2011.04.027
-
[17]
Horiuchi T, Chiba J, Uoto K, et al. Bioorg. Med. Chem. Lett., 2009, 19:305-308 doi: 10.1016/j.bmcl.2008.11.090
-
[18]
Zhang M, Xian D M, Li H H, et al. Aust. J. Chem., 2012, 65:343-350
-
[19]
SMART Ver. 5. 628 and SAINT Ver. 6. 02, Bruker AXS Inc. , Madison, Wisconsin, USA, 1998.
-
[20]
Sheldrick, G M. SADABS, Program for Empirical Absorption Correction of Area Detector, University of Göttingen, Germany, 1996.
-
[21]
Sheldrick G M. Acta Crystallogr. Sect. A, 2008, A64:112-122
-
[22]
You Z, Zheng B, Yang T, et al. J. Coord. Chem., 2016, 69:1371-1379 doi: 10.1080/00958972.2016.1171856
-
[23]
李鹿曦, 孙莹, 谢青, 等.无机化学学报, 2016, 32(2):369-376 http://www.cnki.com.cn/Article/CJFDTOTAL-SYQY201603027.htmLI Lu-Xi, SUN Ying, XIE Qing, et al. Chinese J. Inorg. Chem., 2016, 32(2):369-376 http://www.cnki.com.cn/Article/CJFDTOTAL-SYQY201603027.htm
-
[24]
Qu D, Niu F, Zhao X, et al. Bioorg. Med. Chem., 2015, 23:1944-1949 doi: 10.1016/j.bmc.2015.03.036
-
[25]
Roy S, Mandal T N, Das K, et al. J. Coord. Chem., 2010, 63:2146-2157 doi: 10.1080/00958972.2010.499457
-
[26]
Zhao X, Chen X, Li J, et al. Polyhedron, 2015, 97:268-272 doi: 10.1016/j.poly.2015.07.012
-
[27]
Asgedom G, Sreedhara A, Kivikoski J, et al. J. Chem. Soc. Dalton Trans., 1996, 1:93-97
-
[1]
-

Figure 1 Perspective view of the molecular structure of H2L·H2O with the atom labeling scheme
Thermal ellipsoids for non-hydrogen atoms are drawn at the 30% probability level; Hydrogen bond is shown as a dashed line; Water molecule is omitted for clarity

Figure 2 Molecular packing diagram of H2L·H2O
Hydrogen bonds are shown as dashed lines

Figure 3 Perspective view of the molecular structure of complex 1 with the atom labeling scheme
Thermal ellipsoids for non-hydrogen atoms are drawn at the 30% probability level

Figure 4 Perspective view of the molecular structure of complex 2 with the atom labeling scheme
Thermal ellipsoids for non-hydrogen atoms are drawn at the 30% probability level
Table 1. Crystallographic and experimental data for H2L·H2O and the complexes
Compound H2L-H2O 1 2 Formula C17H17FN2O4 C17H15BrN3O6V C17H15BrN3O6V Molecular weight 320.3 488.2 488.2 Crystal system Monoclinic Triclinic Triclinic Space group P21/c P1 P1 a / nm 0.937 0(1) 0.778 89(7) 0.778 89(7) b /nm 1.308 5(1) 0.869 61(8) 0.869 61(8) c / nm 1.240 4(1) 1.524 2(1) 1.524 2(1) α/(°) 90 94.078(3) 94.078(3) β/(°) 96.367(2) 98.547(3) 98.547(3) γ/(°) 90 110.424(3) 110.424(3) V / nm3 1.511 4(2) 0.948 3(2) 0.948 3(2) Z 4 2 2 Dc / (g·cm-3) 1.408 1.710 1.710 μ(Mo Kα) /mm-1 0.110 2.670 2.670 F(000) 672 488 488 Independent reflections 2 667 3 490 3 490 Observed reflections [I≥2σ(I)] 1 815 3 004 3 004 Parameters 219 258 258 Restraints 4 1 1 Goodness-of-fit on F2 1.040 1.053 1.053 R1, wR2[I≥2σ(I)] 0.040 6, 0.086 3 0.040 1, 0.095 4 0.040 1, 0.095 4 R1, wR2 (all data)* 0.076 3, 0.100 5 0.048 4, 0.100 7 *R1=Fo-Fc/Fo, wR2=[∑w(Fo2-Fc2)/∑w(Fo2)2]1/2  下载: 导出CSV
Table 2. Selected bond lengths (nm) and angles (°) for H2L·H2O and the complexes
H2L C7-N1 1.270(2) N1-N2 1.383(2) N2-C8 1.342(2) C8-O3 1.224(2) 1 V1-O1 0.184 6(5) V1-O2 0.192 3(5) V1-03 0.226 7(6) V1-O4 0.185 5(5) V1-O6 0.157 2(6) V1-N1 0.205 2(7) O6-V1-O1 99.6(3) O6-V1-O4 99.9(3) O1-V1-O4 102.6(2) O6-V1-O2 99.8(3) O1-V1-O2 152.1(2) O4-V1-O2 93.6(2) O6-V1-N1 95.8(3) O1-V1-N1 83.4(3) O4-V1-N1 161.9(2) O2-V1-N1 74.9(2) O6-V1-O3 176.8(3) O1-V1-O3 81.6(2) O4-V1-03 76.8(2) O2-V1-O3 80.1(2) N1-V1-O3 87.3(2) 2 V1-O1 0.185 2(4) V1-O2 0.193 1(3) V1-O3 0.226 5(4) V1-O4 0.187 0(3) VI-O6 0.157 9(3) V1-N1 0.207 1(4) O6-V1-O1 99.11(17) O6-V1-O4 99.40(17) O1-V1O4 102.91(15) O6-V1-O2 100.17(17) O1-V1-O2 152.23(16) O4-V1-O2 93.45(14) O6-V1-N1 95.14(17) Ol-Vl-Nl 83.65(16) O4-V1-N1 162.82(16) O2-V1-N1 74.89(16) O6-V1-O3 176.71(16) O1-V1-O3 80.97(14) O4-V1-O3 77.41(15)| O2-V1-O3 80.91(15) N1-V1-O3 88.14(15)
下载: 导出CSV
Table 3. Hydrogen bond parameters for H2L·H2O
D-H …A d(D-H) / nm d(H-A)/nm d(D …A) / nm ∠D-H…A/(.) O1-H1-N1 0.082 0.202 0.273 1(2) 144 O1-H1…O4ⅰ 0.082 0.262 0.305 8(2) 115 O4-H4B-O3 ⅱ 0.085(1) 0.187(1) 0.272 0(2) 169(2) O4-H4A …O1ⅲ 0.085(1) 0.219(1) 0.295 1(2) 150(2) N2-H2-O4ⅳ 0.090(1) 0.208(1) 0.297 2(2) 174(2) Symmetry codes: ⅰ-1+x, -1+y, z; ⅱ 1+x, 1+y, z; ⅲ 1-x, 1-y, 1-z; ⅳ 1-x, -1/2+y, 3/2-z.
下载: 导出CSV
Table 4. Effect of the vanadium complexes on blood glucose levels in both normal and diabetic mice
Group Dose / (mgv·kg-1) Blood glucose* / (mmol·L-1) Beginning 1st week 2nd week 3rd week Normal mice CMC 5.8±0.6 6.1±1.2 6.0±1.1 5.9±1.0 Normal mice+1 20.00 5.9±1.0 6.0±0.9 5.9±1.3 5.8±1.2 Normal mice+2 20.00 6.0±0.8 6.0±1.1 6.1 ±0.9 6.0±1.4 Alloxan mice CMC 16.1±1.9 15.7±2.0 15.9±2.1 15.0±1.6 Alloxan mice+1 20.00 14.0±1.7 6.3±1.2 6.7±1.5 7.8±2.0 Alloxan mice+1 10.00 15.0±1.4 7.3±0.8 8.1±1.2 8.7±1.7 Alloxan mice+2 20.00 14.2±1.3 6.1 ±0.7 6.5±1.0 7.9±1.4 Alloxan mice+2 10.00 14.9±1.7 7.1±1.1 8.0±1.5 8.5±1.5 * Data were expressed as mean±standard deviations for six mice in each group.
下载: 导出CSV
Table 5. Effects of the complexes on body weight of both normal and diabetic mice
Group Dose / (mgv·kg-1) Body weight* / g Beginning 1st week 2nd week 3rd week Normal mice CMC 30.5±2.1 32.9±2.5 34.5±3.0 36.6±3.2 Normal miee+1 20.00 30.1±1.8 32.5±2.0 34.6±2.6 37.1±2.9 Normal miee+2 20.00 30.6±2.0 32.7±2.2 34.9±2.7 37.5±3.0 Alloxan mice CMC 27.3±1.1 28.0±1.2 29.1±1.5 30.0±2.2 Alloxan mice+1 20.00 27.5±1.3 28.7±1.5 30.1 ±2.1 32.4±3.1 Alloxan mice+1 10.00 27.1±1.5 28.3±1.8 29.4±2.0 31.0±2.7 Alloxan mice+2 20.00 28.0±1.2 29.1±1.5 30.2±1.8 32.6±2.5 Alloxan mice+2 10.00 27.5±1.3 28.6±1.9 30.1 ±2.0 31.3±2.9 * Data were expressed as mean±standard deviations for six mice in each group.
下载: 导出CSV
-


 扫一扫看文章
计量
- PDF下载量: 7
- 文章访问数: 775
- HTML全文浏览量: 78
 下载:
下载:
