 Figure 6.
Effect of chlorination and ultrasonication on the pore size distribution in H-MOR catalysts
Figure 6.
Effect of chlorination and ultrasonication on the pore size distribution in H-MOR catalysts
Citation:
Sameh M. K. Aboul-Fotouh, Noha A. K. Aboul-Gheit, Mona A. Naghmash. Dimethylether production on zeolite catalysts activated by Cl-, F- and/or ultrasonication[J]. Journal of Fuel Chemistry and Technology,
2016, 44(4): 428-436.

Dimethylether production on zeolite catalysts activated by Cl-, F- and/or ultrasonication
English
Dimethylether production on zeolite catalysts activated by Cl-, F- and/or ultrasonication
Abstract:
The chlorinated and fluorinated zeolite catalysts were prepared by the impregnation of zeolites (H-ZSM-5, H-MOR or H-Y) using two halogen precursors (ammonium chloride and ammonium fluoride) in this study. The influence of ultrasonic irradiation was evaluated for optimizing both halogen precursors for production of dimethylether (DME) via methanol dehydration in a fixed bed reactor. The catalysts were characterized by SEM, XRD, BET and NH3-TPD. The reaction conditions were temperatures from 100 to 300 ℃ and a WHSV =15.9 h-1. All halogenated catalysts show higher catalytic activities at all reaction temperatures studied. However, the halogenated zeolite catalysts prepared under ultrasonic irradiation show higher performance for DME formation. The chlorinated zeolite catalysts show higher activity and selectivity for DME production than the respective fluorinated versions.
-
Key words:
- ultrasonication
- / DME
- / zeolite
- / Cl-
- / F-
-
Methanol conversion to dimethylether (DME) is an internationally up-to-date industrial achievement for the production of environmentally friendly motor fuels because it is composed of two carbons plus six hydrogens and one oxygen. Its preparation from methanol is a highly profitable reaction since methanol is an agricultural by-product of fermentation of waste plants.
DME has been found to be an alternative diesel fuel because it has low NOx emission,near-zero smoke amounts and less engine noise compared with traditional diesel fuels[1, 2]. It can also be used to replace chlorofluorocarbons (CFCs) which destroy ozone layer of the atmosphere and used as an intermediate for producing many valuable chemicals such as lower olefins,methyl acetate,dimethyl sulfate and liquefied petroleum gas (LPG) alternative. It is also used in power generation and as an aerosol propellant,such as in hair spray and shaving cream,due to its liquefaction property[3-7]. Hence,there is a growing demand to produce a large amount of DME to meet the global need.
DME can be produced by methanol dehydration over a solid-acid catalyst or direct synthesis from syngas by employing a hybrid catalyst,comprising a methanol synthesis component and a solid-acid catalyst[8]. Methanol dehydration to DME is a potentially important process and more favorable in the views of thermodynamics and economy[9]. Commercially,γ-Al2O3 is used as the catalyst for this reaction. It has high surface area,excellent thermal stability,high mechanical resistance and catalytic activity for DME formation due to its surface acidity. Recently,many methods have been applied to synthesize alumina with a higher specific surface area and activity for DME synthesis[10].
Methanol to DME (MTD) dehydration over a solid acid catalyst in a fixed bed reactor was first reported by Mobil in 1965. Since then,many methanol dehydration catalysts have been examined[11] including γ-Al2O3[12-17],crystalline aluminosilicates[17, 18],zeolites (ZSM-5)[19],clays[20] and phosphates such as aluminum phosphate[21, 22]. However the most common catalysts used are γ-Al2O3 and zeolites.
Chlorination and fluorination of Al2O3 and zeolites were carried out by the author[23-25] to promote the catalytic acidity. The results of hydroconversion of cyclohexene over metal/Al2O3 with or without Cl- and F-ions were studied[24]. Introducing Cl- or F- ions into aluminate aluminas in different ways causes Brnsted acid sites to appear and a drastic increase of both skeletal isomerization and total conversion. Also,the fluorination enhances the acidity and catalytic activity of H-MOR towards DME production[23].
Ultrasound irradiation can enhance and improve the catalytic performance of the catalyst. Application of power ultrasound has been shown to be instrumental in improving the rates,yields and product properties of a variety of processes in synthetic chemistry[26, 27]. The effects of ultrasound have been investigated for different cases,including polymerization reactions and the syntheses of various amorphous and crystalline materials. Significant changes have been commonly observed in the processes and properties of the reaction products in the presence of ultrasound. The main purpose of using ultrasound in different chemical reactions has been to enhance the reaction rates,yields and selectivity to desired product.
In the present work,the catalytic dehydration of methanol to DME has been studied using chlorinated or fluorinated H-MOR,HZSM-5 and HY zeolite catalysts prepared by the impregnation method with or without ultrasonic irradiation. The effects of ultrasonication and/or halogenation on the textural,acidic properties and catalytic activity of zeolite samples have been investigated.
1 Experimental
1.1 Preparation of the halogenated zeolite catalysts
The chlorinated and fluorinated zeolite catalysts were prepared by stirring the catalysts for 1h at 25℃ in the impregnation of 1g zeolites (H-ZSM-5,H-MOR or H-Y) catalysts in 2cm3 of aqueous solution of ammonium chloride or ammonium fluoride containing the requisite quantity for 3.0% (by weight) NH4Cl or NH4F,respectively. The catalyst was dried at 110℃ overnight and calcined at 400℃ for 2h in an air flow.
1.2 Preparation of sonicated halogenated zeolite catalysts
0.3g of prepared halogenated zeolites was sonicated in methanol as a liquid carrier of 7.5cm3 for 60min using Ultrasonic Processor UP50H (Hielscher) with the titanium sonotrode S3 having a tip diameter of 3mm and 50W/cm2 power intensity (related to 100% amplitude setting). The irradiation with ultrasound was continued for 1h at 25℃,then centrifuged for 30min. The catalyst was dried at 110℃ overnight and calcined at 400℃ for 2h in an air flow.
1.3 Hydroconversion reactor system and reaction product analysis
A silica glass flow-type tubular reactor system loaded with 0.1g of the zeolite catalyst was used. The reactor was heated in an insulated wider silica tube jacket,thermostated to ± 1℃. Argon was used as a carrier gas at a flow rate of 30cm3/min in all runs. The methanol feed was introduced into the reactor via continuous evaporation applying argon flow passing into a closed jar thermostated at a fixed temperature of 26℃ ,whereby the quantity of methanol was always 4.98×10⁻² mol/h. The reaction runs were investigated at temperatures ranging between 100-300℃,with 25℃ increments. The reaction effluent was analyzed using a Perkin-Elmer Autosystem XL gas-chromatograph with a 4 m long column,packed with 10% squalane plus 10% didecyl phthalate supported on Chromosorb W-HP of 80-100 mesh. A flame ionization detector and a Totalchrom Navigator Programme computed were used.
1.4 Characterization of the catalysts
1.4.3 Scanning electron microscope (SEM)
The SEM samples were mounted on aluminum slabs and sputter-coater with a thin gold layer of ~15mm thickness using an Edward sputter-coater. The samples were then examined in a scanning electron microscope model JSM-5410 with Electron probe micro-analyzer (JEOL) at 30kV.
1.4.1 Temperature programmed desorption (TPD) of ammonia
The TPD of presorbed ammonia on the acid sites of the zeolite supports was carried out in differential scanning calorimeter (DSC) using nitrogen as a purge gas according to the procedure adopted by the author[28].
1.4.2 X-ray diffraction patterns of the catalysts
The X-ray diffraction patterns of the catalysts under study were carried out using a Phillips X,Pert Diffractometer PW 1390 at 40kV and 30mA with Ni filter and Cu Kα radiation. The XRD runs were carried out up to 2θ of 60°.
2 Results and discussion
2.1 Catalyst characterization
2.2 Catalytic activity of the zeolites
2.1.3 Surface properties
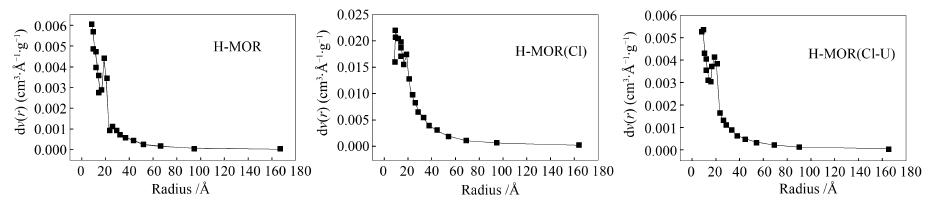
Figure 6 shows the effect of chlorination and ultrasonication on the pore size distribution of H-MOR catalyst. The effect of chlorination before and after ultrasonication on the pore size distribution of H-MOR catalyst is insignificant. In these Figures 6(a)-6(c),the scale of dv(r) is almost the same and the rejoin proportion of pores fall in the pore radius range <1.5nm. Moreover,there is also 20% of the pores falling in the wider range 2-6nm. This may assume that the effect of chlorination and ultrasonication on the pore volume distribution has been mollified.
Figure 6.
Effect of chlorination and ultrasonication on the pore size distribution in H-MOR catalysts
Table 2 shows surface area and total pore volume values of different halogenated zeolites. In Table 2 the surface areas of the samples become very close (H-MOR 350m2/g,Cl-HMOR 368m2/g. Also the total pore volume of the two samples become close (0.22 and 0.23cm3/g). It is to be signified that ultrasonication of chlorinated H-MOR acquires a surface area of 478 m2/g and a total pore volume of 0.44cm3/g.
 Table 2.
Surface area and total pore volume values of different halogenated zeolites
Table 2.
Surface area and total pore volume values of different halogenated zeolites
Cl-HMOR 0.23 368 Cl-HMOR (U) 0.44 478 H-ZSM-5 0.32 357 F-HZSM-5 0.37 375 F-HZSM-5(U) 0.33 346 HY 0.38 435 Cl-HY 0.42 464 Table 2. Surface area and total pore volume values of different halogenated zeolitesFigure 7 shows the pore size distribution curves obtained for the synthesized H-ZSM-5 catalysts. It is evident in Figure 7 that the three curves give very similar pore distribution curves. Almost 95% of pores are falling in <1.5nm region,and the remaining pores are present as low intensity peak at ~2nm.
 Figure 7.
Effect of fluorination and ultrasonication on the pore size distribution in H-ZSM-5 catalysts
Figure 7.
Effect of fluorination and ultrasonication on the pore size distribution in H-ZSM-5 catalysts
Table 2 shows the surface area and pore volume of H-ZSM-5 catalysts. It can be assumed that ultrasonication has caused a limited agglomeration of a portion of the F-HZSM-5 catalyst. Fluorination increased surface area from 357 to 375m2/g and increased total pore volume from 0.32 to 0.37cm3/g,which resulted in increasing the activity for methanol conversion to DME from 72.6% to 85.44% at 250℃. However,the crystal size seems to be unaffected. A further treatment with ultrasonication after fluorination appeared to have a deterioration effect,it decreased the surface area of HZSM-5(F) to 346m2/g and the pore volume to 0.33cm3/g and also decreased the catalytic activity.
Figure 8 shows the pore size distribution curves obtained for the synthesized HY catalysts. It can be seen that chlorination and ultrasonication can caused a large change of the pore size distribution in HY catalysts.
 Figure 8.
Effect of chlorination and ultrasonication on the pore size distribution in HY catalysts
Figure 8.
Effect of chlorination and ultrasonication on the pore size distribution in HY catalysts
2.1.1 XRD
Figure 1 shows all main diffraction bands for the modified H-MOR zeolites (Cl-HMOR,Cl-HMOR(U),F-HMOR and F-HMOR(U)),which do not include significant variation of their 2θ positions relative to the mother H-MOR sample. Moreover,the mordenite sample (Cl-HMOR) treated by chlorination using NH4Cl gives stronger diffraction intensity. On the contrary,the sample (F-HMOR) treated by fluorination using NH4F gives lower diffraction peaks. The treatment of halogenated H-MOR by ultrasonication leads to increasing the degree of crystallinity.
 Figure 1.
XRD patterns of halogenated H-MOR catalyst
Figure 1.
XRD patterns of halogenated H-MOR catalyst
Table 1 shows all the crystal sizes of zeolite catalysts. The crystal size of fluorinated H-MOR is smaller than that of chlorinated H-MOR,which indicates further that F- ions exhibit a stronger attack on the framework aluminum causing a larger Al-leaching. Evidently,the removal of Al from the framework structure of the zeolite will be followed by migration of Si atoms to fill the vacant positions resulting by Al removal. A part of Si-O-Al bonds are partially changed to Si-O-Si bonds in order to stabilize the zeolitic structure. Since Si-O bond is shorter than the Al-O bond,the zeolitic crystal will suffer shrinkage of the unit cells and the channel (pore) formed by the surrounding crystals will become relatively narrow. The F- ions are more aggressive than Cl- ions because of the higher inductive effect of F[29-32].
It is noted that ultrasonicated chlorinated H-MOR sample gives higher diffraction intensities and lower crystal size than the chlorinated sample,but in the case of fluorinated sample the ultrasonicated fluorinated H-MOR has a slight decrease in crystal size than fluorinated H-MOR catalyst.
Table 1.
Crystallite sizes of the phases present in XRD of zeolite catalysts
Cl-HMOR 64.0 Cl-HMOR(U) 56.8 F-HMOR 43.9 F-HMOR (U) 42.4 H-ZSM-5 32.7 Cl-HZSM-5 38.3 Cl-HZSM-5(U) 31.3 F-HZSM-5 32.4 Table 1. Crystallite sizes of the phases present in XRD of zeolite catalystsFigure 2 shows all main diffraction bands for the modified H-ZSM-5 zeolite (Cl-HZSM-5,Cl-HZSM-5(U),F-HZSM-5 and F-HZSM-5(U)),do not show measurable shift of their 2θ position than the mother H-MOR sample (2θ= 23°,24°). The HZSM-5 samples treated by chlorination or fluorination show higher diffraction intensity than untreated HZSM-5 indicating slight dealumination of the zeolite support. The sonicated Cl-HZSM-5 sample has higher diffraction intensity compared with the unsonicated Cl-HZSM-5,however the diffraction intensity of sonicated F-HZSM-5 is lower than that of unsonicated F-HZSM-5.
 Figure 2.
XRD patterns of H-ZSM-5 catalysts
Figure 2.
XRD patterns of H-ZSM-5 catalysts
2.1.4 Surface acidity of H-MOR catalysts
The TPD of presorbed ammonia on the acid sites of the zeolite supports was carried out in differential scanning calorimeter (DSC) using nitrogen as a purge gas according to the procedure adopted by Aboul-Fotouh[28]. The thermograms obtained (Figure 9) for H-MOR samples show two peaks. A low-temperature peak (LT-Peak) corresponds to the ammonia desorption enthalpy (ΔHd) from the weak acid sites of the catalyst,and a high temperature peak (HT-Peak) corresponds to the ammonia desorption enthalpy from the strong acid sites. The ΔHd values are proportional to the number of acid sites,whereas the peak temperatures (tmax) are taken to correlate the acid sites strength of the catalysts. The higher the tmax value is,the stronger the acid site is in the catalyst (Table 3). Table 3 shows that the number of acid sites (ΔH,J/g) decreases slightly with chorination and more with ultrasonication,whereas the acidity strength (tmax) increases. This effect is of significant importance in the reaction mechanism of the current reaction (DME formation).
 Figure 9.
NH3-TPD for H-MOR catalysts
Table 3.
Ammonia TPD of the H-MOR catalysts
Figure 9.
NH3-TPD for H-MOR catalysts
Table 3.
Ammonia TPD of the H-MOR catalysts
Cl-HMOR 84.3 204 533 a: proportional to acid sites number
b: proportional to acid sites strengthTable 3. Ammonia TPD of the H-MOR catalysts2.1.2 SEM
Figure 3 shows the SEM micrographs obtained for the halogenated and halogenated sonicated H-MOR. From this figure it is shown that ultrasonic irradiation decreases the size of particles.
 Figure 3.
SEM images of halogenated H-MOR catalysts
Figure 3.
SEM images of halogenated H-MOR catalysts
Figure 4 shows the SEM micrographs for the HZSM-5,F-HZSM-5 and F-HZSM-5(U) (ultrasonicated). F- incorporation in the HZSM-5 catalyst causes the HZSM-5 crystallites to be smaller and hence the catalyst activity. From SEM of F-HZSM-5(U) catalyst it shows a creation of some agglomerates of the particles,and so its activity became somewhat lower than that of F-HZSM-5.
 Figure 4.
SEM images of fluorinated H-ZSM-5 catalysts
Figure 4.
SEM images of fluorinated H-ZSM-5 catalysts
SEM micrographs of chlorinated HY catalysts are shown in Figure 5. The crystallites in the Cl-HY (U) sample exhibit the least agglomeration. However,the Cl-HY catalyst (Figure 5(b)) indicates that its crystallites suffer higher agglomeration than Cl-HY (U) but suffers less agglomeration than the parent zeolite HY. This can prove that the ultrasonication and physical aspect are more influencing on catalytic activity of Cl-HY(U).
 Figure 5.
SEM images of chlorinated HY catalysts
Figure 5.
SEM images of chlorinated HY catalysts
2.2.3 HY
The results on methanol conversion activities of the H-Y zeolite catalysts are depicted in Figure 13. Evidently NH4Cl or NH4F doping enhances the conversion activities of H-Y zeolite,and the catalysts activities are in the order of Cl-HY > F-HY > HY.
 Figure 13.
Dimethyl ether (DME) in product of methanol conversion using chlorinated and fluorinated H-Y catalysts
Figure 13.
Dimethyl ether (DME) in product of methanol conversion using chlorinated and fluorinated H-Y catalysts
Sonication treatment of halogenated H-Y sample (Figures 13(b) and 13(c)),shows that sonicated Cl-HY has higher activity than unsonicated Cl-HY due to the surface area and pore volume increases with ultrasonication (Table 2). On the contrary,sonication of the fluorinated HY has lower activity than the unsonicated sample,which may because that a fluorinated debris is formed and can cause pore diffusion limitation[25].
2.2.1 H-MOR
In previous work[33-35],fluorination and chlorination using NH4F and NH4Cl with different halogen concentrations (1.0% to 6.0% F or Cl) were carried out. A halogen content of 3.0% was found to be an optimum. Therefore this halogen content was used in the present work.
The results of prepared halogenated and H-MOR catalysts on methanol conversion are shown in Figure 10. It has been found that fluorinated H-MOR acquires significantly higher activity than the chlorinated version (Figure 10(a)). Moreover,ultrasonication increases the activity of the chlorinated H-MOR but decreases the activity of fluorinated H-MOR catalyst (Figure 10(b),10(c)). These can be attributed to higher acidity of Cl-HMOR (U) than that of unsonicated Cl-HMOR (Table 3).
 Figure 10.
Dimethyl ether (DME) in product of methanol conversion using H-MOR catalysts
Figure 10.
Dimethyl ether (DME) in product of methanol conversion using H-MOR catalysts
It can be assumed that chlorination increases the density of Cl- on the surface via substitution of OH- groups,since this halogen on the surface is more strongly acidic,hence enhancing the DME formation activity. Moreover,fluorination gives stronger acid sites on the H-MOR surface than chlorination by virtue of the higher electronegativity of F- than Cl-,so fluorinated H-MOR has higher activity than chlorinated H-MOR. Furthermore,ultrasonication can be assumed to cause some agglomeration of the catalytic particles in the presence of F-,which does not occur in case of the chlorinatied H-MOR[36].
Table 2 shows that the ultrasonication of Cl-HMOR increases the surface area from 350 to 478m2/g whereas chlorination of H-MOR slightly increases the surface area to 368m2/g. Accordingly the ultrasonication is activated for DME formation. Chlorination followed by ultrasonication is preferred for higher catalytic reaction. The pore volume data decrease with chlorination but increase with ultrasonication which activates the catalytic activity.
Figure 11 shows the selectivities of the current methanol dehydration reaction at 300℃ producing DME together with olefinic hydrocarbons (HC) using halogenated and halogenated sonicated H-MOR. The DME selectivity is enhanced by halogenation,and the selectivity of fluorinated H-MOR is higher than that of chlorinated H-MOR. On the other hand,the selectivity for olefins decreases by halogenation. The selectivities of sonicated and chlorinated H-MOR catalysts follows the order of H-MOR< Cl-HMOR < Cl-HMOR (U). For sonicated and fluorinated H-MOR catalysts the selectivities of DME formation using F-HMOR and F-HMOR (U) are nearly the same.
 Figure 11.
Dimethyl ether (DME) and hydrocarbon selectivity at 300℃ using H-MOR catalysts
Figure 11.
Dimethyl ether (DME) and hydrocarbon selectivity at 300℃ using H-MOR catalysts
2.2.2 H-ZSM-5
The results on methanol conversion activities of the H-ZSM-5 zeolite catalysts are illustrated in Figure 12. The activity of the catalyst is increased as function of reaction temperature till reaching a maximum at 275℃,beyond which the activity remained unchanged. The activities of the catalysts are in the order of Cl-HZSM-5 > F-HZSM-5 > H-ZSM-5.
 Figure 12.
Dimethyl ether (DME) in product of methanol conversion using H-ZSM-5 catalysts
Figure 12.
Dimethyl ether (DME) in product of methanol conversion using H-ZSM-5 catalysts
The ultrasonication is found to enhance the activity of the chlorinated catalyst (Figure 12(b)),whereas it decreases the activity of fluorinated catalyst (Figure 12(c)). Table 2 shows that the fluorination of HZSM-5 increases the surface area from 357 to 375m2/g,whereas fluorination flowed by ultrasonication of HZSM-5 decreases the surface area to 346m2/g. Also,the pore volume data increases with fluorination but decrease with ultrasonication due to a fluorinated debris is formed and can cause pore diffusion limitation and large agglomeration[25] (Figure 4).
Aboul-Gheit et al[25] concluded from the TPD of presorbed ammonia from HCl and HF doped H-ZSM-5 zeolite that both acid treatments of zeolite increased its acid sites number and strength,however HCl increased acid sites number more than HF did,whereas,HF increased the acid sites strength more than HCl did. The larger number of acid sites in the HCl promoted catalyst than in HF promoted one can be considered the influencing factor for increasing its activity.
Le Van Mao et al[37] show that doping H-ZSM-5 with a low concentration of fluoride species enhances the surface acidity via: formation of new Brnsted acid sites,strengthening some acid sites of the parent zeolite. Moreover,Arena et al[38] have indicated that Cl- adsorbed on the surface of Al2O3 results in a significant change in the electronic properties of the outer layer of Al2O3 that decreases the basic Lewis sites,or inducing a stronger ‘inductive effect’ of Cl- on the neighboring hydroxyl groups. This electronic effect weakens the O-H bond,rendering the proton more strongly acidic.
3 Conclusions
Ultrasonic irradiation during catalyst preparation affects the catalyst characters because intensive collisions occur between molecules.
Ultrasonication and/or halogenation enhance the acidity of zeolite catalysts leading to higher production of DME.
Ultrasonic irrdiation enhances the proformance of the halogenated zeolite catalysts to DME production.
The chlorinated catalysts with or without ultrasonic irrdiation show significantly enhanced catalyst selectivity to DME formation.
-
-
[1]
FLEISCH T H, BASU A, GRADASSI M J, MASIN J G. Dimethyl ether: A fuel for the 21st century[J]. Stud Surf Sci Catal, 1997, 107: 117-125. doi: 10.1016/S0167-2991(97)80323-0
-
[2]
SEMELSBERGER T A, BORUP R L, GREENE H L. Dimethyl ether (DME) as an alternative fuel[J]. J Power Sources, 2006, 156(2): 497-511. doi: 10.1016/j.jpowsour.2005.05.082
-
[3]
VISHWANATHAN V, JUN K W, KIM J W, ROH H S. Vapour phase dehydration of crude methanol to dimethyl ether over Na-modified H-ZSM-5 catalysts[J]. Appl Catal A: Gen, 2004, 276(1/2): 251-256.
-
[4]
CAI G Y, LIU Z M, SHI R M, HE C Q, YANG L X, SUN C L, CHANG Y J. Light alkenes from syngas via dimethyl ether[J]. Appl Catal A: Gen, 1995, 125(1): 29-38. doi: 10.1016/0926-860X(94)00291-6
-
[5]
XU M T, GOODMAN D W and BHATTACHARYYA A. Catalytic dehydration of methanol to dimethyl ether (DME) over Pd/Cab-O-Sil catalysts[J]. Appl Catal A: Gen, 1997, 149(2): 303-309. doi: 10.1016/S0926-860X(96)00276-1
-
[6]
KIM S D, BAEK S C, LEE Y J, JUN K W, KIM M J, YOO I S. Effect of γ-alumina content on catalytic performance of modified ZSM-5 for dehydration of crude methanol to dimethyl ether[J]. Appl Catal A: Gen, 2006, 309(1): 139-143. doi: 10.1016/j.apcata.2006.05.008
-
[7]
VISHWANATHAN V, ROH H S, KIM J W, JUN K W. Surface properties and catalytic activity of TiO2 ZrO2 mixed oxides in dehydration of methanol to dimethyl ether[J]. Catal Lett, 2004, 96: 23-28. doi: 10.1023/B:CATL.0000029524.94392.9f
-
[8]
FEI J H, HOU Z Y, ZHU B, LOU H, ZHENG X M. Synthesis of dimethyl ether (DME) on modified HY zeolite and modified HY zeolite-supported Cu-Mn-Zn catalysts[J]. Appl Catal A: Gen, 2006, 304: 49-54. doi: 10.1016/j.apcata.2006.02.019
-
[9]
YARIPOUR F, BAGHAEI F, SCHMIDT I, PERREGAARD J. Catalytic dehydration of methanol to dimethyl ether (DME) over solid-acid catalysts[J]. Catal Commun, 2005, 6(2): 147-152. doi: 10.1016/j.catcom.2004.11.012
-
[10]
KIM S M, LEE Y J, BAE J W, POTDAR H S, JUN K W. Synthesis and characterization of a highly active alumina catalyst for methanol dehydration to dimethyl ether[J]. Appl Catal A: Gen, 2008, 348(1): 113-120. doi: 10.1016/j.apcata.2008.06.032
-
[11]
TANG Q, XU H, ZHENG Y, WANG J, LI H, ZHANG J. Catalytic dehydration of methanol to dimethyl ether over micro-mesoporous ZSM-5/MCM-41 composite molecular sieves[J]. Appl Catal A: Gen, 2012, 413: .
-
[12]
KESHAVARZ A R, REZAEI M, YARIPOUR F. Preparation of nanocrystalline γ-Al2O3 catalyst using different procedures for methanol dehydration to dimethylether[J]. J Natur Gas Chem, 2011, 20(30): 334-338.
-
[13]
RAOOF F, TAGHIZADEH M, ELIASSI A, YARIPOUR F. Effects of temperature and feed composition on catalytic dehydration of methanol to dimethyl ether over γ-alumina[J]. Fuel, 2008, 87(13): 2967-2971.
-
[14]
KHOM-IN J, PRASERTHDAM P, PANPRANOT J, MEKASUWANDUMRONG O. Dehydration of methanol to dimethyl ether over nanocrystalline Al2O3with mixed γ-and χ-crystalline phases[J]. Catal Commun, 2008, 9(10): 1955-1958. doi: 10.1016/j.catcom.2008.03.009
-
[15]
MOLLAVALI M, YARIPOUR F, MOHAMMADI-JAM S, ATASHI H. Relationship between surface acidity and activity of solid-acid catalysts in vapour phase dehydration of methanol[J]. Fuel Process Technol, 2009, 90(9): 1093-1098. doi: 10.1016/j.fuproc.2009.04.018
-
[16]
EBEID M F, ALI A, AMIN A, ABOUL-FOTOUH S. Heteropoly acids supported on α-Al2O3 as solid acid catalysts for methanol transformation[J]. Collect Czech Chem Commun, 1993, 58: 2079-2089. doi: 10.1135/cccc19932079
-
[17]
AMIN A, ALI A, ABOUL-FOTOUH S, EBEID E F. Surface studies and nature of active sites of supported heteropolyacids as catalysts in methanol dehydration[J]. Collect Czech Chem Commun, 1994, 59: 820-832. doi: 10.1135/cccc19940820
-
[18]
LIU D, YAO C, ZHANG J, FANG D, CHEN D. Catalytic dehydration of methanol to dimethyl ether over modified γ-Al2O3 catalyst[J]. Fuel, 2011, 90(5): 1738-1742. doi: 10.1016/j.fuel.2011.01.038
-
[19]
JIANG S, HWANG J, JIN T, CAI T, CHO W, BAEK Y, PARK S. Dehydration of methanol to dimethyl ether over ZSM-5 zeolite[J]. Bull Korean Chem Soc, 2004, 25: 185-189. doi: 10.5012/bkcs.2004.25.2.185
-
[20]
SUN KOU M R, MENDIOROZ S, SALERNO P, MUNOZ V. Catalytic activity of pillared clays in methanol conversion[J]. Appl Catal A: Gen, 2003, 240(1/2): 273-285.
-
[21]
LERTJIAMRATN K, PRASERTHDAM P, ARAI M, PANPRANOT J. Modification of acid properties and catalytic properties of AlPO4 by hydrothermal pretreatment for methanol dehydration to dimethyl ether[J]. Appl Catal A: Gen, 2010, 378(1): 119-123.
-
[22]
YARIPOUR F, BAGHAEI F, SCHMIDT I, PERREGAARD J. Synthesis of dimethyl ether from methanol over aluminium phosphate and silica-titania catalysts[J]. Catal Commun, 2005, 6(8): 542-549.
-
[23]
ABOUL-FOTOUH S M K, ABOUL-GHEIT N A K, HASSAN M M I. conversion of methanol using modified H-MOR zeolite catalysts[J]. Chin J Catal, 2011, 32(3): 412-417.
-
[24]
ABOUL-FOTOUH S M, ABOUL-GHEIT A K. Hydroconversion of cyclohexene using platinum-containing catalysts promoted with other noble metals and chlorine or fluorine[J]. Appl Catal A: Gen, 2001, 208(1/2): 55-61.
-
[25]
ABOUL-GHEIT A K, ABOUL-FOTOUH S M, ABDEL-HAMID S M, ABOUL-GHEIT N A K. Effect of hydrochlorination and hydrofluorination of H-ZSM-5 on the catalytic hydroconversion reactions of cyclohexene[J]. Appl Catal A: Gen, 2006, 297(1): 102-110. doi: 10.1016/j.apcata.2005.08.044
-
[26]
LYCZKO N, ESPITALIER F, LOUISNARD O, SCHWARTZENTRUBER J. Effect of ultrasound on the induction time and the metastable zone widths of potassium sulphate[J]. Chem Eng J, 2002, 86(3): 233-241.
-
[27]
TSAI T C. Application of zeolites in petroleum industries[J]. Catal Process, 1995, 3(4): 37-48.
-
[28]
ABOUL-FOTOUH S M. Cyclohexen reactivity using catalysts containing Pt, Re and PtRe supported on Na-and H-mordenite[J]. J Chin Chem Soc, 2003, 50(6): 1151-1158. doi: 10.1002/jccs.v50.6
-
[29]
ASHIM K G, RONALD A K. Fluorine-promoted catalyst[J]. Catal Rev Sci Eng, 1985, 27(4): 539-589. doi: 10.1080/01614948508064233
-
[30]
COVINI R, FATTORE V, GIORDANO N. Acidity of fluorinated aluminas, and their catalytic activity: Meaning and limits of a correlation[J]. J Catal, 1967, 9(4): 315-321. doi: 10.1016/0021-9517(67)90259-X
-
[31]
HIRSCHLER A E. The measurement of catalyst acidity using indicators forming stable surface carbonium ions[J]. J Catal, 1963, 2(5): 428-439. doi: 10.1016/0021-9517(63)90108-8
-
[32]
WEBB A N. Hydrofluoric acid and acidity of alumina[J]. Ind Eng Chem, 1957, 49: 261-263. doi: 10.1021/ie50566a042
-
[33]
ABOUL-FOTOUH S M, ABOUL-GHEIT A K. Hydroconversion of cyclohexene using platinum-containing catalysts promoted with other noble metals and chlorine or fluorine[J]. Appl Catal A: Gen, 2001, 208(1/2): 55-61.
-
[34]
ALI L I, ALI A A, ABOUL-FOTOUH S M, ABOUL-GHEIT A K. Hydroisomerization, hydrocracking and dehydrocyclization of n-pentane and n-hexane using mono-and bimetallic catalysts promoted with fluorine[J]. Appl Catal A: Gen, 2001, 215(1/2): 161-173.
-
[35]
ALI A G A, ALI L I, ABOUL-FOTOUH S M, ABOUL-GHEIT A K. Hydroconversion of n-paraffins in light naphtha using Pt/Al2O3 catalysts promoted with noble metals and/or chlorine[J]. Appl Catal A: Gen, 2001, 205(1/2): 129-146.
-
[36]
ABOUL-FOTOUH S M, ABOUL-GHEIT N A K, HASSAN M M I. Conversion of methanol using modified H-MOR zeolite catalysts[J]. Chin J Catal, 2011, 32(3): 412-417.
-
[37]
LE VAN MAO R, LE T S, FAIRBAIRN M, MUNTASAR A, XIAO S, DENES G. ZSM-5 zeolite with enhanced acidic properties[J]. Appl Catal A: Gen, 1999, 185(1): 41-52. doi: 10.1016/S0926-860X(99)00132-5
-
[38]
ARENA F, FRUSTERL F, MONDELLER N, GIORDANO N. Interaction pathway of chloride ions with γ-Al2O3: Surface acidity and thermal stability of the Cl/γ-Al2O3 System[J]. J Chem Soc Faraday Trans, 1992, 88: 3353-3356. doi: 10.1039/FT9928803353
-
[1]
-

Figure 3 SEM images of halogenated H-MOR catalysts
(a): H-MOR; (b): Cl-HMOR; (c): Cl-HMOR (U); (d): F-HMOR; (e): F-HMOR (U)

Figure 4 SEM images of fluorinated H-ZSM-5 catalysts
(a): H-ZSM-5; (b): F-HZSM-5; (c): F-HZSM-5 (U)

Figure 6 Effect of chlorination and ultrasonication on the pore size distribution in H-MOR catalysts

Figure 7 Effect of fluorination and ultrasonication on the pore size distribution in H-ZSM-5 catalysts

Figure 8 Effect of chlorination and ultrasonication on the pore size distribution in HY catalysts

Figure 10 Dimethyl ether (DME) in product of methanol conversion using H-MOR catalysts

Figure 11 Dimethyl ether (DME) and hydrocarbon selectivity at 300℃ using H-MOR catalysts

Figure 12 Dimethyl ether (DME) in product of methanol conversion using H-ZSM-5 catalysts

Figure 13 Dimethyl ether (DME) in product of methanol conversion using chlorinated and fluorinated H-Y catalysts
Table 1. Crystallite sizes of the phases present in XRD of zeolite catalysts
Cl-HMOR 64.0 Cl-HMOR(U) 56.8 F-HMOR 43.9 F-HMOR (U) 42.4 H-ZSM-5 32.7 Cl-HZSM-5 38.3 Cl-HZSM-5(U) 31.3 F-HZSM-5 32.4  下载: 导出CSV
Table 2. Surface area and total pore volume values of different halogenated zeolites
Cl-HMOR 0.23 368 Cl-HMOR (U) 0.44 478 H-ZSM-5 0.32 357 F-HZSM-5 0.37 375 F-HZSM-5(U) 0.33 346 HY 0.38 435 Cl-HY 0.42 464
下载: 导出CSV
Table 3. Ammonia TPD of the H-MOR catalysts
Cl-HMOR 84.3 204 533 a: proportional to acid sites number
b: proportional to acid sites strength
下载: 导出CSV
-


 扫一扫看文章
计量
- PDF下载量: 0
- 文章访问数: 0
- HTML全文浏览量: 0
 下载:
下载:
