Table 1.
Ultimate and proximate analyses of raw materials
Citation:
JIAN Yi-ming, LI Xian, ZHU Xian-qing, ASHIDA Ryuichi, WORASUWANNARAK Nakorn, HU Zhen-zhong, LUO Guang-qian, YAO Hong, ZHONG Mei, LIU Jing-mei, MA Feng-yun, MIURA Kouichi. Interaction between low-rank coal and biomass during degradative solvent extraction[J]. Journal of Fuel Chemistry and Technology,
2019, 47(1): 14-22.

低阶煤与生物质在热溶剂提质萃取过程中的相互作用
摘要:
作者前期工作中提出了一种针对生物质废弃物或低阶煤的热溶提质萃取方法,该方法可以在350℃下实现生物质或低阶煤的提质及多级分离,获得高附加值的萃取物。与生物质的热溶提质萃取比较,低阶煤的萃取物收率较低。本研究提出对生物质和低阶煤混合物进行热溶提质萃取,通过两者的物理化学相互作用,来提高其萃取收率。研究结果表明,对两者混合物热溶剂提质分离得到萃取物的产率及元素组成与理论计算结果略有不同,理论计算结果是假设生物质与煤之间无交互作用而得到的。煤中的矿物质对生物质热分解起催化作用,导致收率有所增加。煤、生物质及其混合物通过热溶剂提质分离得到的萃取物的元素组成、分子量分布、化学结构、热分解和热塑性非常相似。总体而言,低阶煤与生物质在热溶剂提质萃取过程的交互作用较小。但是,本研究证明了热溶提质萃取方法不仅适用于煤或生物质,也适用于它们的混合物。这意味着热溶剂提质萃取法可以在不改变任何工艺条件参数的情况下,以煤、生物质及其混合物作为原料。
English
Interaction between low-rank coal and biomass during degradative solvent extraction
Abstract:
A degradative solvent extraction at around 350℃ for low-rank coal or biomass wastes upgrading and fractionation was proposed in our previous work. The extraction yield of low-rank coal is relatively lower than that of biomass. In this work the blends of low-rank coal and biomass were treated by this method at 350℃ to investigate the interaction between them. The results showed that the yields and elemental compositions of the extracts obtained from the blends were slight different to the calculated results, which were calculated by assuming that there was no interaction between the coal and biomass. The slight promotion of yield was judged to be caused by the catalytic action of the minerals in the coal for thermal decomposition of biomass. It was worth to note that the elemental composition, molecular weight distribution, chemical structure, thermal decomposition behavior and thermoplastic behavior of the extracts obtained from low-rank coal, biomass and their blend, were rather similar to each other, independent of the properties of the raw feedstocks. Overall, the interaction between low-rank coal and biomass during the extraction was not significant. On the other hand, the proposed degradative solvent extraction method was fit not only by single low-rank coal and biomass but also by their blends to produce the product having similar physicochemical properties. This implied that an industrial system of degradative solvent extraction can use coal, biomass or their blends as feedstock at the same time without modification or adjustment.
-
Key words:
- low-rank coal
- / biomass
- / blends
- / degradative solvent extraction
- / upgrading
-
Efficient utilization of low grade carbonaceous resources, such as low-rank coal and biomass waste, has been paid more and more attention recently. Low-rank coals are inevitably requested to be utilized efficiently because of the rapid depletion of high grade coal, such as bituminous coal, in the world[1-3]. Biomasses, considered as a carbon neutral resource, have received more attention at present not only due to the abundant availability but also the flexibility as a chemical feedstock. Various technologies have been developed for the utilization of these kinds of low grade carbonaceous resources[4-6]. However, rather high contents of oxygen-containing compounds, moisture or ash of them cause various problems for storage, transportation and efficient conversion by existing technologies. Thus, the pretreatment of dewatering and upgrading are essential for efficient utilization of these resources. Furthermore, if these low grade carbonaceous resources are used as the feedstocks of chemicals and carbon materials, it might have to develop methods to effectively convert them to intermediates independent of the raw materials. However, the treatment conditions and product properties of the existing technologies for this low grade carbonaceous resource conversion are usually different because of the different properties of the raw materials[7].
The authors have recently proposed a degradative solvent extraction method which treats low-rank coals or biomass wastes in a nonpolar solvent at around 350 ℃ to dewater and remove oxygen functional groups, and separate them into several fractions[8-13]. The fractions included unextractable fraction (residue) which was the so-called upgraded coal if low-rank coal was the feedstock, the high-molecular-weight extract fraction (deposit) which precipitated as solid from the solvent at room temperature, the low-molecular-weight extract fraction (soluble) which was soluble in the solvent at room temperature and finally recovered as solid by removing the solvent, the liquid fraction (liquid) mainly consisted of water, and gas product with major composition of CO2. The solubles and deposits were almost free from water and ash, have the carbon content of as high as 85% and oxygen content as low as 7%, much lower than their raw biomass. Thus, the degradative solvent extraction process was a "carbon enrichment" process. The promising utilizations of the upgraded coal, soluble and deposit as fuels, chemicals or carbon materials precursors were proved in our previous works[14-21].
However, the soluble and deposit yields of low-rank coal extraction only ranged from 19%-31% and 4%-17%, respectively[3, 10]. They were obviously lower than those of the biomass extraction, which ranged from 26%-51% and 5%-29%, respectively[9, 11, 22]. The relatively lower extraction yield of low-rank coal should be caused by that there were only some noncovalent bonds, such as hydrogen bonds, which were broken during the thermal treatment at the temperature lower than 350 ℃[23]. On the contrary, a series of complex chemical reactions, such as dehydration, decarboxylation and decomposition reactions, occurred during the thermal treatment of biomass at the temperature over 200 ℃[24, 25]. Some researchers used polar solvent, such as alcohols, phenolics and water, for thermal extraction of low-rank coals to enhance the extraction yield[26, 27] because such compounds were act as not only solvent but also reactant during the extraction[23]. It was already found that such kinds of compounds can be formed during thermal treatment of biomass[11, 28, 29]. Therefore, if the blended low-rank coal and biomass were treated by the degradative solvent extraction, such kinds of compounds formed through biomass pyrolysis may improve the extraction yield of low-rank coal extraction. In order to confirm it, in this work the blends of low-rank coal and biomass were thermal extracted at 350 ℃ by this method, to investigate the interaction between low-rank coal and biomass during extraction.
1. Experimental
1.1 Samples and solvents used
Rice straw (from Thailand, abbreviated to RS), Leucaena (woody biomass from Thailand, LC), Mae moh coal (lignite from Thailand, MM), Loy yang coal (lignite from Australia, LY) and the blends of coal and biomass (LC/MM, RS/MM, LC/LY and RS/LY) were employed as raw materials. The ratio of coal to biomass in blends was 1 to 1 on dry basis. The properties of the raw materials were shown in Table 1. 1-methylnaphthalene (1-MN) was used as a non-polar solvent for the degradative solvent extraction.
Table 1

 下载:
导出CSV
下载:
导出CSV
Sample Ultimate analysis wdaf/% Proximate analysis w/% C H N O* Mad Vdb FCdb Adb Rice straw(RS) 49.8 7.0 1.0 42.2 8.5 73.0 11.9 15.1 Leucaena(LC) 49.3 6.6 1.4 42.7 11.2 82.1 16.6 1.3 Mae moh coal (MM) 66.4 3.9 1.9 27.8 21.3 50.2 24.0 25.8 Loy yang coal (LY) 66.7 4.7 0.9 27.7 42.5 51.5 47.0 1.5 *: calculated by difference 1.2 Experimental procedure
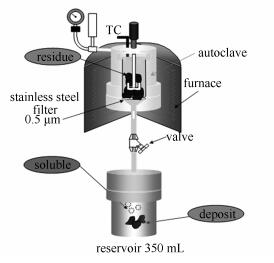
Since the treatment at around 350 ℃ was found to be effective for low-rank coals and biomasses in our previous works[9, 10, 16], the degradative solvent extraction in this work were performed at 350 ℃. Figure 1 shows the schematic diagram of the apparatus (autoclave) used for the extraction. The procedure was described in detail in our previous paper[9, 10]. The reactor was charged with as-received sample (13 g on dry basis) and 1-MN (300 mL). The sealed autoclave, after purged by N2, was heated up to 350 ℃ at a heating rate of 5 K/min and then kept for 60 min under autogenous pressure. The extracts and residue were separated by opening the valve below the filter at the extraction temperature. The extract and solvent were collected in the reservoir which was cooled by circulating cooling water. Part of the extract, precipitated at room temperature from the solvent, was separated from the solvent by filtration and termed deposit. Another part of the extract, soluble in the solvent at room temperature, was obtained as solid by a rotary evaporator and termed soluble. Small amount of light fraction (liquid) was remained in the solvent. The residue, deposit and soluble were then dried under vacuum for 6 h at 150 ℃ to remove the residual solvent. The yields of residue, deposit and soluble were determined by weight. The gaseous products were quantified by GC. The yield of liquid was determined by difference.
Figure 1
1.3 Product analyses
The thermal decomposition behavior analyses were performed using a thermogravimetric analyzer (Shimadzu, TGA50). The elemental analysis was performed by a CHN analyzer (Yanaco, CHN MT-6 M). The molecular weight distribution (MWD) was measured by a laser desorption/ionization time-of-flight mass spectrometry (Shimadzu/Kratos, KOMPACT-MALDI-II). Chemical structure was estimated by the FT-IR (JEOL, JIR-WINSPEC 50). The softening/melting behavior was examined by a thermomechanical analyzer (Shimadzu, TMA). The TMA estimates the relative displacement of the sample when the sample in a platinum pan of 6 mm I.D. was heated under 10 g of load.
2. Results and discussion
2.1 Extraction yields
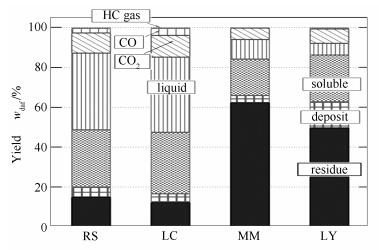
Figure 2 shows the yields of single raw material extractions on weight basis. The yields of gaseous products, consisting of mainly CO2, were from 2.8% to 10.9%. The yields of biomass extracts including soluble and deposit, ranged from 33.6% to 35.1%, are significantly higher than those of low-rank coal extracts. On the contrary, the yields of low-rank coal residues were significantly higher than those of biomass residues. It was found in our previous work that the extracts were much more valuable products than residues because of their characteristics of high carbon content, low ash and moisture content, and so on[16, 17, 19, 30]. Thus, on the viewpoint of practical utilization it is beneficial to improve the extraction yield of low-rank coal. The liquid yields of biomass extractions are around as high as 38.0%, which consists of around 5.0% of organics and 33.0% of water[9]. It is found that much oxygen containing compounds, such as alcohols and phenolics, are formed during biomass pyrolysis or hydrothermal treatment[29, 31]. However, the liquid obtained from low-rank coal extraction has relatively low yield with almost solely of water[32].
Figure 2
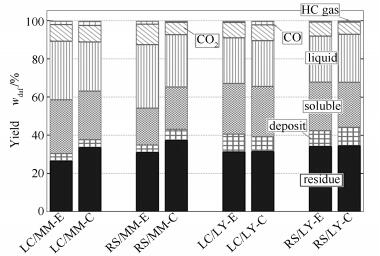
Figure 3 shows the yields of blend extractions. The yields, calculated by assuming that there was no interaction between the coal and biomass during the extraction, are also added for comparison purpose.
Figure 3
The figure shows that the experimental yield distributions of RS/LY and LC/LY extractions are rather close to their calculated yield distributions. However, the experimental yields of RS/MM and LC/MM residues are 31.1% and 26.6%, respectively, lower than their calculated yields. The experimental yields of RS/MM and LC/MM Liquids are higher than their calculated yields. It implies that there are some interaction between biomasses and MM. However, there is no clear interaction between biomasses and LY. One of the main differences between the two low-rank coals is the ash content and composition[33]. The LY coal has the ash content of as low as 1.5% on dry basis, as shown in Table 1. On the contrary, the MM coal has the ash content of as high as 25.8%. Furthermore, the major constituents of the MM coal ash include Al, Fe and Ca[34]. It is well known that such metals can catalyze the thermal decomposition of biomass[35-37]. This should be one of the main reasons for the extraction yield difference between experimental and calculated values.
2.2 Proximate and elemental composition
Table 2 shows the results of ultimate and proximate analyses of the three solid fractions.
Table 2
Table 2. Ultimate and proximate analyses of products下载:
导出CSV
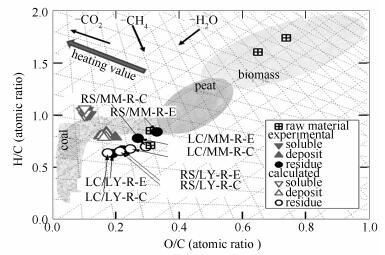
Sample Ultimate analysis wdaf/% Proximate analysis wdb/% Atomic ratio C H N O* V FC A H/C O/C residuel 79.5 5.7 2.0 12.8 24.0 22.8 53.2 0.86 0.12 RS deposit 81.4 5.5 1.6 11.5 37.9 60.0 2.1 0.81 0.11 soluble 80.1 6.4 1.4 12.1 76.4 22.8 0.8 0.96 0.11 residuel 86.4 5.3 1.9 6.4 35.7 54.9 9.4 0.74 0.06 LC deposit 76.5 5.5 2.6 15.4 36.5 62.1 1.4 0.86 0.15 soluble 81.5 6.4 2.2 9.9 75.2 24.8 0.0 0.94 0.09 residuel 69.8 3.8 3.4 25.0 27.1 34.4 38.5 0.65 0.27 MM deposit 76.4 5.1 3.8 14.7 39.9 58.7 1.4 0.80 0.14 soluble 82.4 7.4 2.3 7.8 78.7 21.1 0.2 1.08 0.07 residuel 77.4 4.0 1.0 17.6 31.8 66.0 2.3 0.62 0.17 LY deposit 77.5 5.0 1.0 16.9 42.2 57.2 0.7 0.77 0.16 soluble 81.8 7.5 0.5 10.2 79.5 20.2 0.3 1.10 0.09 residuel 69.0 4.5 2.1 24.4 32.5 32.7 34.8 0.78 0.27 LC/MM deposit 75.6 5.3 2.3 16.9 38.8 60.5 0.7 0.84 0.17 soluble 80.1 6.7 1.3 11.9 76.9 23.1 0.0 1.0 0.11 residuel 64.9 4.6 1.9 28.7 16.7 39.3 44.0 0.85 0.33 RS/MM deposit 76.9 5.1 2.5 15.5 39.2 58.4 2.4 0.80 0.15 soluble 80.0 7.0 1.7 11.3 74.2 25.4 0.4 1.05 0.11 residuel 75.8 4.0 1.1 19.1 30.4 66.3 3.3 0.63 0.19 LC/LY deposit 74.3 4.9 1.2 19.7 41.9 58.1 0.0 0.79 0.20 soluble 80.0 6.7 0.7 12.6 73.1 26.9 0.0 1.01 0.12 residuel 73.0 4.1 1.4 21.6 27.1 54.6 18.3 0.67 0.22 RS/LY deposit 77.0 5.2 1.6 16.2 42.3 57.1 0.5 0.81 0.16 soluble 81.2 7.1 0.9 10.9 77.2 22.8 0.0 1.05 0.10 *: calculated by difference The proximate analysis indicates that the volatile matter (V) contents of all of the solubles converge on the value of 73.1%-79.5% regardless of single material or blend. It is also the case for deposit. The solubles and deposits have rather low ash content, especially for the solubles. The ultimate analysis shows that the carbon and oxygen contents of the three solid fractions are respectively higher and lower than those of their raw materials, indicating that the raw materials are indeed upgraded. The elemental compositions of the solubles obtained from all of the single raw materials and blends are rather close to each other: carbon contents = 80.0%-82.4%, hydrogen contents = 6.4%-7.5% and oxygen contents = 7.8%-12.1%. It is also the case for deposits. These interesting results show that the proposed degradative extraction method can convert rather wide range of low grade carbonaceous materials into extracts having similar elemental compositions regardless of the raw material type. The carbon and oxygen contents of the blend residues are similar to the corresponding raw coal residues and differ with the corresponding raw biomass residues. This is because that most of the residues formed are from the coal rather than the biomass in the blends, as shown in Figure 2. Figure 4 indicates the relationships between H/C and O/C atomic ratio of the three solid fractions obtained from blends and single raw materials. The calculated results are also added in the figure for comparison. The figure clearly shows that all of the data points of solubles converge to a small region, which is H/C atomic ratio: 1.00-1.05 and O/C atomic ratio: 0.10-0.12 similar as those of bituminous coal regardless of the raw material type and their blends. It is also the case for deposits. Furthermore, there is no clear difference between the experimental and calculated results for the solubles, deposits and residues from biomass and LY blends. The H/C and O/C atomic ratio of the LC/MM and RS/MM residues are higher than their calculated results. It should be caused by the minerals in MM as mentioned above. More detailed examinations are necessary to investigate the effect of coal minerals for the thermal decomposition of biomass during the extraction. Overall, in term of elemental composition there is no obvious interaction between low-rank coal and biomass during the degradative solvent extraction.
Figure 4
 Figure 4. Experimental and calculated results of the relationships between H/C and O/C of the three fractions from blend extraction
2.3 Molecular weight distribution
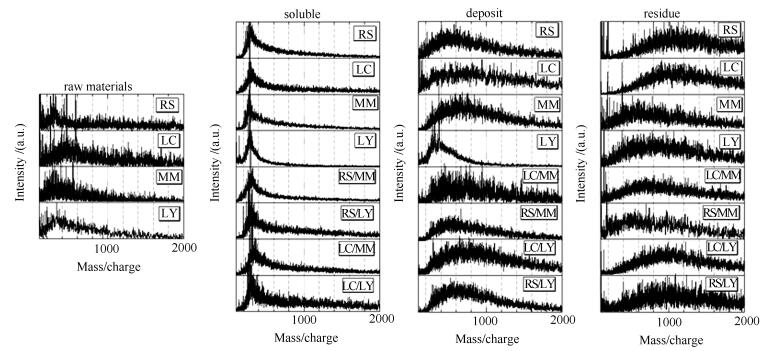
Figure 5 shows the MWDs of the three solid fractions and raw materials.
Figure 5
 Figure 5. Molecular weight distributions of raw materials, solubles, deposits and residues
The MWDs of the solubles are in low molecular weight regions and have a sharp peak at around 300, indicating that the compounds of solubles are rather uniform. The MWDs of all of the solubles obtained from single raw materials and blends are rather similar to each other although the MWDs of the raw materials are significantly different. It is also the case for the deposits, which has a peak at around 500. Residues have higher molecular weight and wider MWD than solubles, deposits and raw materials. It is also found that the molecular weights of the residues obtained from biomasses are higher than those obtained from the low-rank coals. After comparing the MWDs of residues carefully, it can be seen that the MWDs of the blend residues are slightly higher than those of the coal residues and relatively lower than those of the biomass residues since most of the blend residues are from the coal rather than from the biomass, as discussed above.
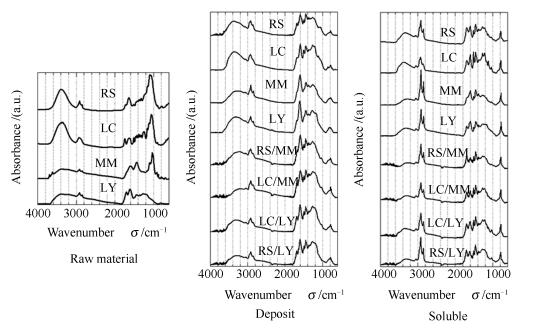
2.4 FT-IR analyses
The FT-IR spectra of raw materials, solubles and deposits are shown in Figure 6. The FT-IR spectra of raw materials are obviously different to each other. The biomasses have more significant OH stretching bands than low-rank coal at around 3400 cm-1. There is a sharp peak at 1050-1000 cm-1 attributed to C (aliphatic)-O stretching in the spectra of raw RS, LC and MM. However, the FT-IR spectra of all of the solubles obtained from single materials and blends are rather similar to each other regardless of the raw material type. It is also the case for the deposits. Besides, the main changes in the spectra from the raw materials to solubles and deposits are weakening of OH stretching bands at around 3400 cm-1, appearance of sharp peaks attributed to aliphatic C-H at 2850-2960 cm-1, appearance of other several peaks attributed to aromatic moieties at 3050 cm-1 and at 770 cm-1, and disappearing of the sharp peak at 1050-1000 cm-1.
Figure 6
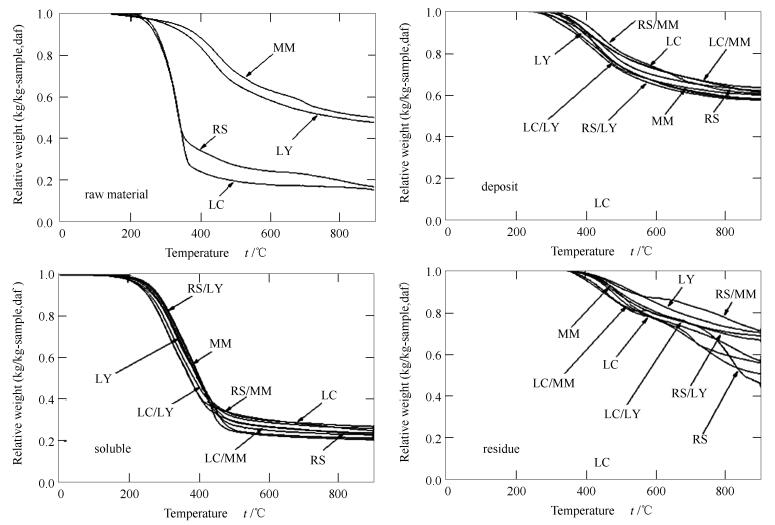
2.5 Thermal behavior examination
The thermal decomposition and thermoplastic behaviors of three solid fractions obtained from single materials and blends are also compared. Figure 7 shows the weight decreasing curves of the three fractions and raw materials obtained by TGA.
Figure 7
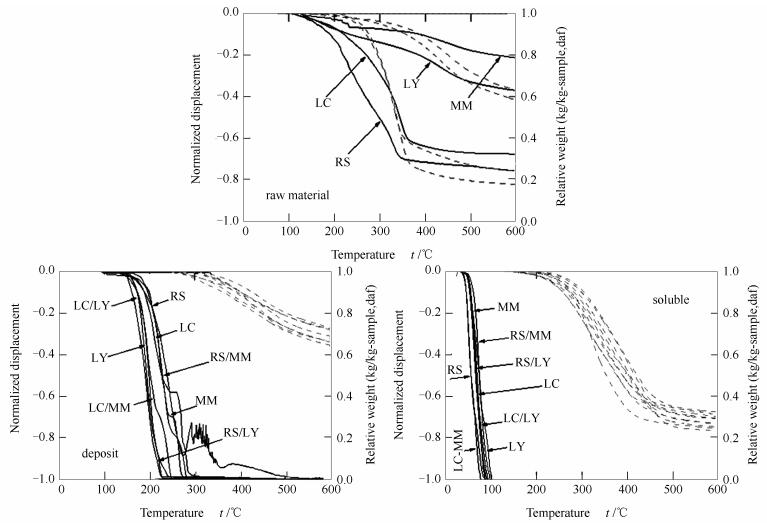
Thermal decomposition behaviors of the low-rank coals and biomasses are significantly different to each other. However, the weight decrease curves of all of the solubles are rather similar to each other, regardless of single material or blend. The weight decreases of solubles start at around 200 ℃, and the main temperature range is from 250 to 450 ℃. The deposits also has similar weight decrease curves as shown in the figure. The thermoplastic behaviors of solubles, deposits and raw materials estimated by TMA are shown in Figure 8 by the solid lines. The TGA curves are also added by dotted lines in the figures to confirm that the displacement is not caused by the mass loss of thermal decomposition. The figure shows that the raw biomasses and low-rank coals have no thermoplastic behavior. However, the displacement curves of deposits and solubles reach to -1.0 at around 250 and 100 ℃, respectively before starting the decomposition reaction. It indicates that all of the deposits and solubles are completely softened and melted before starting decomposition reaction. Furthermore, the displacement curves of all of the solubles obtained from single materials and blends are rather close to each other.
Figure 8
 Figure 8. TMA profiles (solid lines) and TGA curves (dotted lines) of solubles, deposits and raw materials
3. Conclusions
The blends of low-rank coal and biomass were treated by a degradative solvent extraction method to investigate the interaction between the low-rank coal and biomass during the extraction. The results showed that the yields and elemental compositions of the three solid fractions obtained from blends were just slight different to their calculated results. The slight differences of the yields were judged to be caused by the catalytic effect of the minerals in coal for the thermal decomposition of the biomass. The elemental composition, molecular weight distribution, chemical structure, thermal decomposition behavior and thermoplastic behavior of the extracts obtained from low-rank coal, biomass and their blends, were rather similar to each other, independent of the properties of the raw feedstocks. Overall, the interaction between low-rank coal and biomass during the degradative solvent extraction was not significant. On the other hand, the proposed degradative solvent extraction method was fit not only for single low-rank coal and biomass but also for their blends to produce the product having similar physicochemical properties.This implies that an industrial system of degradative solvent extraction can use coal, biomass or their blends as feedstock at the same time without modification or adjustment.
-
-
[1]
WU F P, LU H, YAN J, WANG R Y, ZHAO Y P, WEI X Y. Differences in molecular composition of soluble organic species in two Chinese sub-bituminous coals with different reducibility[J]. J Fuel Chem Technol, 2018, 46(7): 769-777. doi: 10.1016/S1872-5813(18)30033-1
-
[2]
JING G, ZHENG D. Thermodynamic analysis of low-rank-coal-based oxygen-thermal acetylene manufacturing process system[J]. Ind Eng Chem Res, 2012, 51(41): 13414-13422. doi: 10.1021/ie301986q
-
[3]
LI X, ZHU X Q, XIAO L, ASHIDA R, MIURA K, LUO G Q, YAO H. Degradative solvent extraction of demineralized and ion-exchanged low-rank coals[J]. J Fuel Chem Technol, 2014, 42(8): 897-904. doi: 10.1016/S1872-5813(14)60038-4
-
[4]
HASSAN K, RAJENDER G. Low-grade coals:A review of some prospective upgrading technologies[J]. Energy Fuels, 2009, 23(7): 3392-3405. doi: 10.1021/ef801140t
-
[5]
AYHAN D. Biomass resource facilities and biomass conversion processing for fuels and chemicals[J]. Energy Convers Manage, 2001, 42(11): 1357-1378. doi: 10.1016/S0196-8904(00)00137-0
-
[6]
DAVID J B, EARL W E, JEFFRE M P. An overview of peat research, utilization, and environmental considerations[J]. Int J Coal Geol, 1987, 8(1): 1-31.
-
[7]
AKGUL O, ZAMBONI A, BEZZO F, SHAH N, PAPAGEORGIOU L G. Optimization-based approaches for bioethanol supply chains[J]. Ind Eng Chem Res, 2011, 50(9): 4927-4938. doi: 10.1021/ie101392y
-
[8]
MIURA K, SHIMADA M, MAE K. Extraction of coal at 300 to 350℃ to produce precursors for chemicals[C]. 15th International Pittsburgh Coal Conference, Pittsburgh, 1998, 30-31. https://www.osti.gov/biblio/349224-extraction-coal-produce-precursors-chemicals
-
[9]
WANNAPEERA J, LI X, WORASUWANNARAK N, MIURA K, ASHIDA R. Production of high-grade carbonaceous materials and fuel having similar chemical and physical properties from various types of biomass by degradative solvent extraction[J]. Energy Fuels, 2012, 26: 4521-4531. doi: 10.1021/ef3003153
-
[10]
LI X, ASHIDA R, MIURA K. Preparation of high-grade carbonaceous materials having similar chemical and physical properties from various low-rank coals by degradative solvent extraction[J]. Energy Fuels, 2012, 26: 6897-6904. doi: 10.1021/ef301364p
-
[11]
ZHU X Q, XUE Y, LI X, ZHANG Z, SUN W, ASHIDA R, MIURA K, YAO H. Mechanism study of degradative solvent extraction of biomass[J]. Fuel, 2016, 165: 10-18. doi: 10.1016/j.fuel.2015.10.021
-
[12]
LI X, ZHANG Z, ZHANG L, ZHU X Q, HU Z Z, QIAN W X, ASHIDA R, MIURA K, HU H Y, LUO G Q, YAO H. Degradative solvent extraction of low-rank coals by the mixture of low molecular weight extract and solvent as recycled solvent[J]. Fuel Process Technol, 2018, 173: 48-55. doi: 10.1016/j.fuproc.2018.01.005
-
[13]
ZHU X Q, TANG J, LI X, LAN W, XU K, FANG Y, ASHIDA R, MIURA K, LUO G Q, YAO H. Modelling and kinetic study of degradative solvent extraction of biomass wastes[J]. Energy Fuels, 2017, 31(5): 5097-5103. doi: 10.1021/acs.energyfuels.6b03442
-
[14]
OKUDA K, LI X, ASHIDA R, MIURA K. Carbon fiber preparation by low-molecular-weight extracts obtained from low-rank coal or biomass by degradative solvent extraction[C]. 19th Regional Symposium of Chemical Engineering, Bali Indonesia, 2012: 8-9.
-
[15]
MIURA K, MIYABAYASHI K, KAWANARI M, ASHIDA R. Enhancement of reduction rate of iron ore by utilizing low grade iron ore and brown coal derived carbonaceous materials[C]. The Iron and Steel Institute of Japan, 2011, 51: 6.
-
[16]
ZHU X Q, LI X, XIAO L, ZHANG X, TONG S, WU C, ASHIDA R, LIU W, MIURA K, YAO H. Novel carbon-rich additives preparation by degradative solvent extraction of biomass wastes for coke-making[J]. Bioresource Technol, 2016, 207: 85-91. doi: 10.1016/j.biortech.2016.01.105
-
[17]
LI X, PRIYANTO D E, ASHIDA R, MIURA K. Two-stage conversion of low-rank coal or biomass into liquid fuel under mild conditions[J]. Energy Fuels, 2015, 29: 3127-3133. doi: 10.1021/ef502574b
-
[18]
LI X, ASHIDA R, MAKINO M, NISHIDA A, YAO H, MIURA K. Enhancement of gasification reactivity of low-rank coal through high-temperature solvent treatment[J]. Energy Fuels, 2014, 28: 5690-5695. doi: 10.1021/ef501305s
-
[19]
LI J H, ZHOU Q X, MI H Y, LI X, LI H P. Preparation and capacitive properties of graphite-like porous carbon based on coal extracts[J]. J Inorg Mater, 2016, 1: 39-46.
-
[20]
LI X, ZHU X Q, OKUDA K, ZHANG Z, ASHIDA R, YAO H, MIURA K. Preparation of carbon fibers from low-molecular-weight compounds obtained from low-rank coal and biomass by solvent extraction[J]. New Carbon Mater, 2017, 32(1): 41-47. doi: 10.1016/S1872-5805(17)60106-9
-
[21]
ZHU X Q, TONG S, LI X, GAO Y X, XU Y, DACRES O D, ASHIDA R, MIURA K, LIU W Q, YAO H. Conversion of biomass into high-quality bio-oils by degradative solvent extraction combined with subsequent pyrolysis[J]. Energy Fuels, 2017, 31(4): 3987-3994. doi: 10.1021/acs.energyfuels.6b03162
-
[22]
ZHU X Q, ZHANG Z, ZHOU Q X, CAI T, QIAO E, LI X, YAO H. Upgrading and multistage separation of rice straw by degradative solvent extraction[J]. J Fuel Chem Technol, 2015, 43(4): 422-428. doi: 10.1016/S1872-5813(15)30010-4
-
[23]
LIU F J, WEI X Y, FAN M, ZONG Z M. Separation and structural characterization of the value-added chemicals from mild degradation of lignites:A review[J]. Appl Energy, 2016, 170: 415-436. doi: 10.1016/j.apenergy.2016.02.131
-
[24]
HU M, CHEN Z, WANG S, GUO D, MA C, ZHOU Y, CHEN J, LAGHARI M, FAZAL S, XIAO B, ZHANG B, MA S. Thermogravimetric kinetics of lignocellulosic biomass slow pyrolysis using distributed activation energy model, Fraser-Suzuki deconvolution, and iso-conversional method[J]. Energy Convers Manage, 2016, 118: 1-11. doi: 10.1016/j.enconman.2016.03.058
-
[25]
YANG H, YAN R, CHEN H, ZHENG C, LEE D H, LIANG D T. In-depth investigation of biomass pyrolysis based on three major components:Hemicellulose, cellulose and lignin[J]. Energy Fuels, 2006, 20: 388-393. doi: 10.1021/ef0580117
-
[26]
CHEN B, WEI X Y, ZONG Z M, YANG Z S, QING Y, LIU C. Difference in chemical composition of supercritical methanolysis products between two lignites[J]. Appl Energy, 2011, 88: 4570-4576. doi: 10.1016/j.apenergy.2011.05.052
-
[27]
LU H Y, WEI X Y, YU R, PENG Y L, QI X Z, QIE L M, WEI Q, LV J, ZONG Z M, ZHAO W, ZHAO Y P, NI Z H, WU L. Sequential thermal dissolution of huolinguole lignite in methanol and ethanol[J]. Energy Fuels, 2011, 25: 2741-2745. doi: 10.1021/ef101734f
-
[28]
CARLSON T, TOMPSETT G, CONNER W, HUBER G. Aromatic production from catalytic fast pyrolysis of biomass-derived feedstocks[J]. Top Catal, 2009, 52: 241-252. doi: 10.1007/s11244-008-9160-6
-
[29]
MENG A, ZHOU H, QIN L, ZHANG Y, LI Q. Quantitative and kinetic TG-FTIR investigation on three kinds of biomass pyrolysis[J]. J Anal Appl Pyrolysis, 2013, 104: 28-37. doi: 10.1016/j.jaap.2013.09.013
-
[30]
LI X, OKUDA K, ASHIDA R, MIURA K, LUO G, YAO H. Carbon Fibers Preparation by Biomass or Low-Rank Coal Extracts Obtained by Degradative Solvent Extraction[C]. International Symposium on EcoTopia Science, Nagoya Japan, 2013.
-
[31]
TIAN C, LIU Z, ZHANG Y, LI B, CAO W, LU H, DUAN N, ZHANG L, ZHANG T. Hydrothermal liquefaction of harvested high-ash low-lipid algal biomass from Dianchi Lake:Effects of operational parameters and relations of products[J]. Bioresource Technol, 2015, 184: 336-343. doi: 10.1016/j.biortech.2014.10.093
-
[32]
LI X, PRIYANTO D E, ASHIDA R, MIURA K. Two-Stage Conversion of Low-Rank Coal and Biomass into Liquid Fuel under Mild Condition[C]. 29th International Pittsburgh Coal Conference, Pittsburgh USA. 2012. https://www.researchgate.net/publication/275233397_Two-Stage_Conversion_of_Low-Rank_Coal_or_Biomass_into_Liquid_Fuel_under_Mild_Condition
-
[33]
SKODRAS G, GRAMMELIS P, BASINAS P, KAKARAS E, SAKELLAROPOULOS G. Pyrolysis and combustion characteristics of biomass and waste-derived feedstock[J]. Ind Eng Chem Res, 2006, 45: 3791-3799. doi: 10.1021/ie060107g
-
[34]
PIPATMANOMAI S, FUNGTAMMASAN B, BHATTACHARYA S. Characteristics and composition of lignites and boiler ashes and their relation to slagging:The case of Mae Moh PCC boilers[J]. Fuel, 2009, 88: 116-123. doi: 10.1016/j.fuel.2008.08.007
-
[35]
KARAGOZ S, BHASKAR T, MUTO A, SAKATA Y, OSHIKI T, KISHIMOTO T. Low-temperature catalytic hydrothermal treatment of wood biomass:Analysis of liquid products[J]. Chem Eng J, 2005, 108: 127-137. doi: 10.1016/j.cej.2005.01.007
-
[36]
MATSUI T, NISHIHARA A, UEDA C, OHTSUKI M, IKENAGA N, SUZUKI T. Liquefaction of micro-algae with iron catalyst[J]. Fuel, 1997, 76: 1043-1048. doi: 10.1016/S0016-2361(97)00120-8
-
[37]
ELLIOTT D C, BECKMAN D, BRIDGWATER A V, DIEBOLD J P, GEVERT S B, SOLANTAUSTA Y. Developments in direct thermochemical liquefaction of biomass:1983-1990[J]. Energy Fuels, 1991, 5: 399-410. doi: 10.1021/ef00027a008
-
[1]
-
Figure 4 Experimental and calculated results of the relationships between H/C and O/C of the three fractions from blend extraction
Figure 5 Molecular weight distributions of raw materials, solubles, deposits and residues
Figure 8 TMA profiles (solid lines) and TGA curves (dotted lines) of solubles, deposits and raw materials
Table 1. Ultimate and proximate analyses of raw materials
Sample Ultimate analysis wdaf/% Proximate analysis w/% C H N O* Mad Vdb FCdb Adb Rice straw(RS) 49.8 7.0 1.0 42.2 8.5 73.0 11.9 15.1 Leucaena(LC) 49.3 6.6 1.4 42.7 11.2 82.1 16.6 1.3 Mae moh coal (MM) 66.4 3.9 1.9 27.8 21.3 50.2 24.0 25.8 Loy yang coal (LY) 66.7 4.7 0.9 27.7 42.5 51.5 47.0 1.5 *: calculated by difference  下载: 导出CSV
Table 2. Ultimate and proximate analyses of products
Sample Ultimate analysis wdaf/% Proximate analysis wdb/% Atomic ratio C H N O* V FC A H/C O/C residuel 79.5 5.7 2.0 12.8 24.0 22.8 53.2 0.86 0.12 RS deposit 81.4 5.5 1.6 11.5 37.9 60.0 2.1 0.81 0.11 soluble 80.1 6.4 1.4 12.1 76.4 22.8 0.8 0.96 0.11 residuel 86.4 5.3 1.9 6.4 35.7 54.9 9.4 0.74 0.06 LC deposit 76.5 5.5 2.6 15.4 36.5 62.1 1.4 0.86 0.15 soluble 81.5 6.4 2.2 9.9 75.2 24.8 0.0 0.94 0.09 residuel 69.8 3.8 3.4 25.0 27.1 34.4 38.5 0.65 0.27 MM deposit 76.4 5.1 3.8 14.7 39.9 58.7 1.4 0.80 0.14 soluble 82.4 7.4 2.3 7.8 78.7 21.1 0.2 1.08 0.07 residuel 77.4 4.0 1.0 17.6 31.8 66.0 2.3 0.62 0.17 LY deposit 77.5 5.0 1.0 16.9 42.2 57.2 0.7 0.77 0.16 soluble 81.8 7.5 0.5 10.2 79.5 20.2 0.3 1.10 0.09 residuel 69.0 4.5 2.1 24.4 32.5 32.7 34.8 0.78 0.27 LC/MM deposit 75.6 5.3 2.3 16.9 38.8 60.5 0.7 0.84 0.17 soluble 80.1 6.7 1.3 11.9 76.9 23.1 0.0 1.0 0.11 residuel 64.9 4.6 1.9 28.7 16.7 39.3 44.0 0.85 0.33 RS/MM deposit 76.9 5.1 2.5 15.5 39.2 58.4 2.4 0.80 0.15 soluble 80.0 7.0 1.7 11.3 74.2 25.4 0.4 1.05 0.11 residuel 75.8 4.0 1.1 19.1 30.4 66.3 3.3 0.63 0.19 LC/LY deposit 74.3 4.9 1.2 19.7 41.9 58.1 0.0 0.79 0.20 soluble 80.0 6.7 0.7 12.6 73.1 26.9 0.0 1.01 0.12 residuel 73.0 4.1 1.4 21.6 27.1 54.6 18.3 0.67 0.22 RS/LY deposit 77.0 5.2 1.6 16.2 42.3 57.1 0.5 0.81 0.16 soluble 81.2 7.1 0.9 10.9 77.2 22.8 0.0 1.05 0.10 *: calculated by difference
下载: 导出CSV
-


 扫一扫看文章
计量
- PDF下载量: 5
- 文章访问数: 2739
- HTML全文浏览量: 173
