Received Date:
09 December 2021 Accepted Date:
15 February 2022 Revised Date:
31 December 2021 Available Online:
15 February 2023
Abstract:
Polyoxometalates (POMs) are important inorganic photochromic materials to be potentially applied in photo-induced switch, energy storage, and even the detection of light. However, due to the limited sensitivity of POMs, it is difficult to realize the photochromic response to weak visible light. In this paper, by the coordination of solvated Pb(II), a new structure-defined chain-like polyoxomolybdate complex of [(Pb(DMF)4)3(P2Mo18O62)2]n (Pb3Mo18, DMF = dimethylformamide) has been demonstrated by a facile solvent-diffusion approach. By virtue of interactions between Pb(DMF)4 and polyoxoanions, Pb3Mo18 shows an ultrasensitive photochromic response to weak visible lights and forms the reduced 'heteropoly blue' species through ligand-to-metal charge transfer (LMCT) process. A new mechanism is firstly proposed here that the 6s orbital lone electron pair on Pb(II) can effectively stabilize the generated hole of oxygen atoms as a result of O→Mo charge transfer. Through the proposed mechanism, the LMCT barrier is drastically lowered and allows the coloration to be occurred even upon weak visible light. Also, because the conductivity of Pb3Mo18 enhances with the increase of reduction extent, its electrochemical impedance signals are proportionally response to irradiation intensity. Especially, for the first time, the polyoxomolybdate composite can be used to detect weak visible light, in which the optical signal can be converted into electrical signal output. Moreover, Pb3Mo18 can be drip-coated on the surface of the screen printed chip electrode, which is facile to the detection of light by portable devices compatible with computers, mobile phones and other electronic equipment. This work not only highlights a new approach to the molecular design of photochromic POMs by the coordination of metal ions with the effect of inert electron pair, but also lays a foundation to extend the application of POMs as light signal sensors.
Photochromism and related photochromic materials attract much attention in consideration of their potential applications in diverse fields, such as optical switching material, display device, energy storage, and photomechanics [1-9]. In this area, many investigations focus on inorganic materials, which show more stable photochromic performance than the organic composites [10-14]. For example, most of the UV-light sensors are based on the strength of semiconductor materials such as ZnO [15], ZnS [16] and SnO2 [17], and are usually depending on the photovoltaic or photocurrent mechanism. For the semiconductors, the photocurrent generation depends on the wavelength of light exceeding a certain threshold, which limits their detection capability of different wavelength lights [18].
Polyoxometalates (POMs) are widely considered as active components for constructing functional materials because of their potential application in energy storage, photo- or electro-chemical catalysis, antibacteria and fluorescent sensors [19-34]. One of the most interesting functions of POMs is photochromism, which is induced by photo-generated electron transfer to the high-valent metal center (such as WVI, MoVI or VV) in the POMs skeleton to form lower-valent metal ions [4, 35-40]. Different from classical metal oxide semiconductors, Keggin or Dawson type POM features a spherical or ellipsoidal structure, by which the inserted photo-generated electrons can be delocalized in the different metal centers and thus it is a superior candidate to facilitate the photochromism [41-48]. As such, diverse POMs have been explored as photochromic materials to be applied in photochromic device, molecular sensor, humidity and light detection [49-54]. However, most of photochromic POMs materials are only sensitive to the intensify UV- or vis-light. While for the weak visible light, the photochromism behavior of POM is silence, which limits its potential applications in ultrasensitive light sensors and low power information storage. As a result, the photochromic POMs with high sensitivity to weak visible light remains an urgent issue to be explored.
In this paper, using a facile solution diffusion method, we have designed and synthesized a solvated Pb2+ modified Dawson type polyoxomolybdate of [(Pb(DMF)4)3(P2Mo18O62)2]n (Pb3Mo18). Due to the modification of PbDMF4 units, Pb3Mo18 shows a facile reduction upon both strong light and weak visible light. When Pb3Mo18 is loaded on a screen printing chip surface, the determined impedance signals also proportionally decrease with the irradiation increasement even upon low power LED light. Under the same weak irradiations, the commercial illuminance meter does not show corresponding varied signals. It is the first time that the photochromic signals can be converted into electrical signal output to indicate the variation of weak visible light. In addition, the utility of screen printing chip electrode also facilitates the application of such POM sensors in compatibility with computers, mobile phones and other portable electronic devices.
Synthesis of [(Pb(DMF)4)3(P2Mo18O62)2]n: [(Pb(DMF)4)3(P2Mo18O62)2]n was prepared by using a facile solvent-diffusion method. Firstly, (NH4)6[P2Mo18O62]·11H2O (0.5856 g, 0.2 mmol) was dissolved in 3 mL DMF, and then Pb(NO3)2 (0.1990 g, 0.6 mmol) in 2 mL DMF was added dropwise. After being stirred vigorously for about 12 h at ambient temperature, the mixture was filtrated, whereas the collected filtrate was transferred to a 20 mL beaker. By diffusion with ethanol at room temperature in dark for about 10 days, the yellow block single crystals suitable for X-ray crystallography investigation were obtained with 35% yield based on Mo. Elemental analysis: calcd. (%) for [(Pb(DMF)4)3(P2Mo18O62)2]n, C 10.21, H 2.05, N 3.13, Pb 14.45, Mo 48.46; found, C 10.16, H 1.98, N 3.03, Pb 14.52, Mo 48.39. CCDC number of 1962864 contains the supplementary crystallographic data for this paper. These data can be obtained free of charge from The Cambridge Crystallographic Data centre.
Preparation of the electrode composite: 0.1 g of Pb3Mo18 and 0.1 g of LiClO4 were simultaneously added in a glass vial, followed by the addition of 250 µL of H2O and 50 µL of 0.5 mol/L H2SO4 solution, respectively. The resultant mixture was ground slowly for 30 min under dark, and the sample became sticky. Subsequently, 50 µL of the above mixture was dropped onto the surface of the flexible screen printed chip electrode to form a thin layer of uniform thickness. The entire procedure for the preparation should be carried out under dark to avoid the illumination of light.
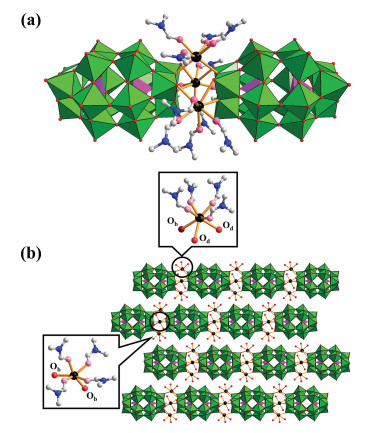
The crystallographic data for Pb3Mo18 is summarized in Table S1 (Supporting information). The structure analysis of X-ray single crystal diffraction reveals that the complex of Pb3Mo18 belongs to monoclinic crystal system with the space group of I2. Pb3Mo18 consists of [P2Mo18O62]6− polyoxoanions and two kinds of [Pb(DMF)4]2+ cations, as shown in Fig. 1a. [P2Mo18O62]6− is a typical Dawson polyoxoanion, which is composed of eighteen MoO6 octahedra and two PO4 tetrahedra. The MoO6 octahedra can be divided into two parts. In the polar position, each Mo3O13 group is built up by three plane-sharing MoO6 octahedra. In the central belt, six MoO6 octahedra link each other through corner-sharing or edge-sharing mode to form a Mo6O27 group, which further link the neighbouring Mo6O27 group or Mo3O13 by sharing bridging oxygen atoms. Three oxygen atoms in PO4 tetrahedron are arising from Mo6O27 group, while the other oxygen atom is from the Mo3O13 group. The P−O distance is in the range of 1.50−1.64 Å The bond length of Mo−Ob is in the range of 1.79−1.95 Å (Ob, the bridging oxygen atom linked to two Mo atoms). The bond length of Mo−Oc is longer than that of Mo−Ob length as in the range of 2.34−2.52 Å (Oc, the bridging O atom connected to three Mo atoms). The shorter Mo=Od bond length is in the range of 1.66−1.72 Å (Od represents the terminal O atom being connected to Mo atom). All the above values are similar to the reported P−O or Mo−O bonding distances [55].
Figure 1
Figure 1.
(a) The ball-stick presentation of the crystal structure of Pb3Mo18. Polyhedra represent polyoxoanion; color codes: Pb, black; O, pink or red; N, blue; C, gray. H atoms are omitted for clarity. (b) The ball-stick presentation of the local coordination mode in the connection between [P2Mo18O62]6− and Pb2+ along ac plane. Polyhedra represent polyoxoanion; color codes: Pb, black; O, pink or red; N, blue; C, gray. H atoms are omitted for clarity.
As shown in Fig. 1b, in Pb3Mo18, there exists two kinds of [Pb(DMF)4]2+ cations, in which the central Pb2+ is six- or seven-coordinated by oxygen atoms arising from four DMF ligands and two terminal O atoms from neighboring two [P2Mo18O62]6− polyoxoanions. The bond length of Pb−Ob/Od is in the range of 2.52−2.81 Å, which is close to that of 2.34−2.82 Å in the literature [56]. The bonding distance between Pb2+ and Od from [P2Mo18O62]6− is in the range of 2.78−2.88 Å, which is close to the reported values (2.66−2.89 Å) [56]. By the interaction between Pb2+ and Od atoms, the [P2Mo18O62]6− polyoxoanions are further linked each other to formulate a one-dimensional chain-like structure along a axis. It is interesting to note that the three-dimensional supramolecular framework of Pb3Mo18 can be considered to be built by the widespread non-classical C−H⋯O interactions between DMF ligands and oxygen atoms in the polyoxoanions along different directions. It is beyond any doubt that these C−H⋯O interactions between DMF ligands and [P2Mo18O62]6− polyoxoanions play a crucial role in the crystal growth and the stabilization of the three-dimensional network of Pb3Mo18 (Figs. S1 and S2 in Supporting information).
To further confirm the composition of Pb3Mo18, FTIR and XRD spectra are also performed. As shown in Fig. S3 (Supporting information), the peaks at 1079, 941, 835 and 782 cm−1, correspond to the asymmetric vibrations of P−O, Mo=Od, Mo−Ob−Mo, Mo−Oc−Mo, respectively, confirming the existence of Dawson-type (NH4)6(P2Mo18O62)·11H2O (P2Mo18). The other peaks at 2927, 1645, 1497, 1439, 1417 and 1253 cm−1 are ascribed to the constituent of DMF ligand.
As shown in Fig. S4 (Supporting information), for the XRD pattern of Pb3Mo18, it can be clearly observed four peaks that can be ascribed to [213], [013], [011] and [002] planes, which are close to the simulated results and illustrate the purity of the complex. Both FTIR and XRD spectra further support the composition of Pb3Mo18, which are in agreement to the crystal structure analysis result. In addition, we also investigate the thermal stability of Pb3Mo18. The FTIR spectra indicate that Pb3Mo18 does not decompose even it is heated to 120 ℃ for 6 h (Fig. S5 in Supporting information), which proves that Pb3Mo18 has satisfactory thermal stability. In order to further investigate the thermostability of Pb3Mo18, thermogravimetric (TG) analysis is carried out as shown in Fig. S6 (Supporting information). The first weight loss of 12.4% from 130 ℃ to 260 ℃ corresponds to the removal of DMF ligands. When the temperature reaches to 660 ℃, the complex exists eventually in the form of PbO and MoO2.
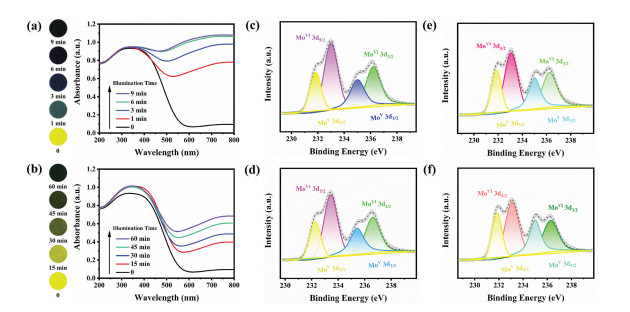
During the synthesis of Pb3Mo18, it is observed that the crystal color changed from yellow to dark green if the samples are not protected under dark. This phenomenon indicates that Pb3Mo18 is a new kind of photochromic complex. Therefore, the photochromic behavior is explored by solid state UV–vis spectra. As can be seen from Fig. 2a, when the crystalline samples of Pb3Mo18 are illuminated upon 300 W Xe lamp, the samples quickly change from light yellow to dark-green. Moreover, the maximum absorbance of the solid state UV–vis spectra at 500 nm attains 0.9 for only 6 min and remains constant. As for the solid powder of P2Mo18, the illumination of the same Xe lamp does not induce the color change significantly as illustrated in Fig. S7a (Supporting information), which suggests that [(Pb(DMF)4]2+ plays a key role to the coloration of Pb3Mo18. To further confirm the effectiveness of [(Pb(DMF)4]2+, the coloration behavior of P2Mo18 is also explored. As shown in Fig. S7b (Supporting information), the coloration of P2Mo18 is transparently slower than that of Pb3Mo18, in which the maximum absorption only reaches 0.35 by 300 W Xe lamp. In addition, with the increasing of the exposure time, the color of P2Mo18 remain unchanged and the maximum absorption only maintains 0.35 for the 9 min illumination. These results indicate that the existence of Pb2+ is very important to facilitate O→Mo charge transfer in the [P2Mo18O62]6− polyoxoanion.
Figure 2
Figure 2.
(a) Colour changes of Pb3Mo18via the 300 W Xe lamp exposure for different time (left) and UV–vis diffuse reflectance spectra of Pb3Mo18 in the solid state upon the 300 W Xe lamp irradiation at room temperature in air (right). (b) Color changes of Pb3Mo18via the 5 W LED light exposure for different time (left) and UV–vis diffuse reflectance spectra of Pb3Mo18 in the solid state upon different time of 5 W LED irradiation at room temperature (right). XPS spectra of Mo 3d in the illuminated Pb3Mo18 by the LED light for different time: (c) 15 min; (d) 30 min; (e) 45 min and (f) 60 min.
Besides the strong visible light, it is also observed that the weak visible light can induce the coloration of Pb3Mo18. When the samples are illuminated by LED light, the coloration can be determined by naked eyes or UV–vis spectra. As illustrated in Fig. 2b, the absorbance values of UV–vis spectra increase along with the incremental illumination time. Accordingly, the solid samples of Pb3Mo18 change from light yellow to dark green. As shown in Fig. S8 (Supporting information), under such conditions, it does not show color change for P2Mo18, and the maximum absorption also unalters with the increasing of the exposure time. In order to check out the variation tendency of Pb3Mo18 illuminated by the two kinds of photo-source, the absorbance values of UV–vis spectra for the illumination with different time are carried out (Fig. S9 in Supporting information). It is apparent to see that under the Xe lamp illumination, the absorbance of Pb3Mo18 at 750 nm changes rapidly with the incremental exposure time, while P2Mo18 increases slightly and keeps stable values after 3 min. Furthermore, the absorbance of Pb3Mo18 shows a greatly rising tendency under the LED irradiation, beyond any doubt, P2Mo18 is almost constant during this period. These results indicate that the coloration reactivity of Pb3Mo18 is distinctly enhanced. To date, it remains unreported for the POM complex that shows high sensitivity to the weak visible light, which may extend the detection ability of POMs for the diverse artificial light sources.
Fig. S10 (Supporting information) exhibits the Raman spectra of Pb3Mo18 before and after irradiation, in which the characteristic absorption peak is located at 968 cm−1 belonging to Mo=Od vibration. It can be observed for the decrease of the peak intensity for the reduced species via LMCT process after irradiation, which indicates the change of Mo=Od vibration. As is known for Dawson-type POMs, the photochromism usually relates to the fact that O2p electron can be transferred to Mo6+ or W6+ and forms Mo5+ or W5+ center, namely, it occurs O→MoVI/WVI LMCT to become 'polyblue' species upon outside irradiation [57]. Therefore, the detection of the reduced Mo species is vital evidence to the photochromism of Pb3Mo18, which can be unveiled by X-ray photoelectron spectroscopy (XPS) spectra. It can clearly be seen from the high definition XPS measurement of Mo 3d binding energy regions for Pb3Mo18 upon the different illumination time by LED light that the characteristic peaks of Mo 3d are composed of Mo 3d5/2 and Mo 3d3/2 (Figs. 2c-f). The percentage of the reduced Mo5+ species increases accordingly with the incremental illumination time. Among these, the binding energy peaks of Mo 3d5/2 and Mo 3d3/2 appear two stronger positions at 233.03 and 236.18 eV respectively, which can be logically attributed to the highest oxidation states of MoVI. While those peaks in doublets at 231.83 and 235.03 eV belong to the lower oxidation states of MoV. The XPS spectra indicate that the molybdenum ions present in Pb3Mo18 are +6 and +5 mixed states. Upon 15, 30, 45 and 60 min illumination, it can be seen that the calculation for the peak area ratio of the reduced Mo5+ species reaches 36.27%, 37.85%, 39.70% and 42.65%, respectively, which are also in agreement with the solid state UV–vis spectra results.
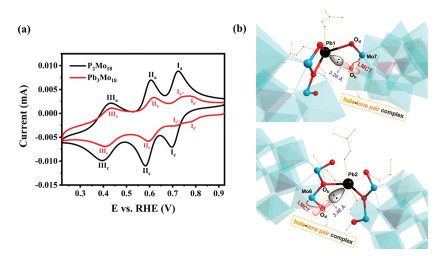
The photochromic behavior indicates that Pb3Mo18 is very sensitive to diverse lights, even for the weak visible light induced by LED source. The reported technique to implement POM chromism usually depends on the modification of organic ligands to stabilize donor oxygen atoms and then allows the stable existence of d1 electron distribution in the Mo site [49, 58]. For Pb3Mo18, the polyoxoanions are only covalently linked by Pb2+ ions, therefore, the photochromism cannot be explained by classical mechanism. As such, the redox property of Pb3Mo18 is investigated as compared to pure P2Mo18 without Pb2+ coordination. As shown in Fig. 3a, Pb3Mo18 shows four redox couples featuring as Ia'/Ic' (0.778 V/0.775 V), Ia''/Ic'' (0.751 V/0.705 V), IIa/IIc (0.618 V/0.595 V) and IIIa/IIIc (0.434 V/0.407 V) four redox couples. While the peaks obtained for the pure [P2Mo18O62]6− polyoxoanion, only three redox couples of Ia/Ic (0.724 V/0.697 V), IIa/IIc (0.605 V/0.581 V) and IIIa/IIIc (0.432 V/0.396 V) can be observed. By comparison, the first redox couple of Pb3Mo18 split into two overlapped redox couples of Ia'/Ic' and Ia''/Ic'', which indicates that the coordination with Pb2+ affects the redox process of the polyoxoanion. The other two couples of Pb3Mo18 also shift into more positive positions, which suggests that the oxidation ability is enhanced for Pb3Mo18 and its photochromism is more easily occurred.
Figure 3
Figure 3.
(a) Cyclic voltammograms of Pb3Mo18 and P2Mo18. (b) The coordination environments of the seven-coordinated (top) and six-coordinated (bottom) Pb(II) ions in Pb3Mo18.
Detailed analysis of the crystal structure of Pb3Mo18 indicates that there exist two kinds of coordination spheres for different Pb2+ ions, both of which show hemidirected coordination geometry with an identifiable void in the distribution of bonds to the ligands [59]. It can be seen from Fig. 3b, for the seven-coordinated Pb2+, four positions are occupied with DMF ligands with short distances (2.38–2.51 Å), while the other three positions are coordinated by three oxygen atoms (2.78–2.88 Å) from [P2Mo18O62]6− polyoxoanions respectively. An evident void can be identified pointing to a bridging oxygen atom (Pb⋯O distance of 3.26 Å), which can be explained that the void is occupied by an inert 6 s electron pair belonging to Pb2+ ion. For the six-coordinated Pb2+, the similar void is observed that directing to a terminal oxygen atom with a longer Pb⋯O distance of 3.48 Å. Based on the above structure analysis, it can be proposed a new mechanism for the photochromic behavior of Pb3Mo18. Upon outside irradiation, a 2p electron from terminal or birding oxygen can be transferred into Mo6+ site to form a low-valence Mo5+ ion bearing with a d1 electron. Then, the cationic hole is generated on the oxygen atom as a result of O→Mo LMCT transition. Due to the coordination environment, the generated hole can be stabilized by a lone electron pair in Pb2+ to form a hole-lone pair complex, which allows the stable existence of d1 electrons without recombination. As illustrated in Fig. S11 (Supporting information), 1H MAS NMR spectra indicate that DMF molecules do not present any change of the H chemical shift, which further confirms that the 6 s orbital inert electron pair of the Pb(II) ions can severely increase the photochromic properties of Pb3Mo18. This mechanism is different to that deduced by Yamase's group [49], in which the coloration is accompanied with a proton transfer process to form charge-transfer complex. Due to the electrostatic attraction of the hole-lone pair complex, the proposed mechanism in this work also suggests that the coloration state of Pb3Mo18 is relatively stable and cannot be easily bleached by heat. As shown in Fig. S12 (Supporting information), the bleaching experiments indicate that even upon 80 ℃ heating for 6 h, the blue colored Pb3Mo18 does not recover to its original yellow color state. Furthermore, the FTIR spectra indicate that the composition and structure of Pb3Mo18 remain unchanged after photoirradiation or annealing. And the solid state UV–vis spectra in Fig. S13 (Supporting information) show that the maximum absorbance values of the illuminated Pb3Mo18 are consistent even the annealing temperature reaches to 120 ℃ for 6 h, confirming that the excellent stability of Pb3Mo18. Because Pb3Mo18 can receive electrons after photoirradiation and become the reduced 'heteropoly blue' species, which remains unchanged of the structure even being heated to 120 ℃. The experimental results indicate that the reduced Pb3Mo18 is hard to lose electrons, which relates to its strong oxidation ability. Such stability also facilitates the signal storage, in which the light or electric information for Pb3Mo18 in the different state can be identified more accurately. As a result, Pb3Mo18 can be considered as an excellent light signal recorder material that may be applied in the diversified fields.
For the practical application of photosensitive materials, the best way to achieve the detection is to convert the optical signal obtained by sensors into electrical signals. The Pb3Mo18 crystalline material prepared in this work shows a good response to different kinds of lights, especially the weak visible light, so it is expected to be used as a well-defined weak light detection sensor. Considering that the reduced Pb3Mo18 can induce the variation of resistance, the electrochemical impedance spectra (EIS) has been explored. The light originated from LED lamp is common in the daily life, but the intensity of such light is too weak to be detected even by commercial photo-intensity meters. As shown in Fig. S14a (Supporting information), upon the irradiation of LED lamp with the rated power of 5 W at different illumination distance, the optical signal cannot be detected accurately via commercial photo-intensity meter, and the determined optical power fluctuates over a certain range. When the detection distance is more than 10 cm, the optical power for commercial photo-intensity meter has been measured as low as 0.10 mW. Moreover, the intensity of the photoresponse can be normally monitored by commercial photo-intensity meter under 300 W Xe lamp irradiation as shown in Fig. S14b (Supporting information), and the closer the illumination distance is, the stronger the optical power is. In order to compare with the detectable level of the photoresponse in different dim light, the signal response of 254 nm and 365 nm are also carried out. As illustrated in Fig. S15 (Supporting information), the optical power values determined by commercial photo-intensity meter are still irregular, and the signal response is completely failed to capture even when the detection distance is higher than 10 cm.
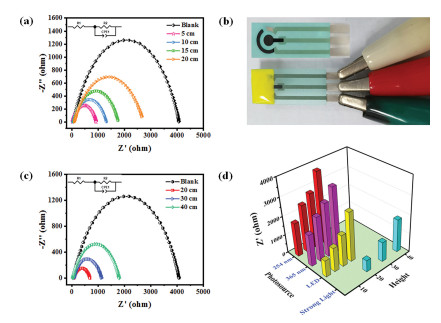
However, as demonstrated from Figs. 4a and b, for Pb3Mo18 coated on the surface of the screen printed chip electrode, the different impedance signals can be observed upon LED illumination for different distance. It can be found that the illumination distance is proportional to the resistance values. Subsequently, the irradiation distance is fixed at 10 cm to detect the impedance values upon different irradiation time. As demonstrated in Fig. S16 (Supporting information), the different impedance signals can be observed upon LED illumination for different time. When the illumination time increases, the resistance values decrease due to that more active d1 electrons enhance the conductivity. In order to compare the effect of different illuminant on the resistance values of Pb3Mo18, we also test the impedance signals of 254 nm, 365 nm and 300 W Xe lamp with different height, respectively. As shown in Fig. 4c and Fig. S17 (Supporting information), the resistance values also increase gradually with the increasing of the light height. When the illumination distance decreases, the resistance values change to smaller one also due to that more d1 electrons enhance the conductivity. It is interesting to find that the impedance signals of Pb3Mo18 are not only proportional to the height of the illuminant, but also to the intensity or time of the illuminant. As shown in Fig. 4d, the resistance values decrease with the increasing of the illuminant intensity. It should be also noted here that the impedance signal output on the screen printed chip electrode allows the detection of weak light to be easily realized by portable devices.
Figure 4
Figure 4.
(a) Nyquist plots of Pb3Mo18 illuminated by 5 W LED light; Inset: the equivalent circuit diagram. (b) The schematic diagram of the blank screen printed chip electrode (top) and Pb3Mo18 coated on the screen printed chip electrode (bottom). (c) Nyquist plots of Pb3Mo18 illuminated by 300 W Xe lamp. Inset: the equivalent circuit diagram. (d) The values of Rp obtained at different height for 254 nm, 365 nm, 5 W LED light and 300 W Xe lamp.
In this work, by the coordination of Pb2+, a new chain-like polyoxomolybdate complex of Pb3Mo18 has been obtained by a facile solution method. By the introduction of [Pb(DMF)4]2+ cations, Pb3Mo18 shows an ultrahigh sensitivity to weak visible light and become the reduced 'heteropoly blue' species. Especially, a new mechanism is unveiled that the coordination environment between Pb(II) and oxygen plays a key role to promote the LMCT process, namely, the 6 s orbital lone electron pair on Pb(II) can stabilize the generated hole of oxygen atoms as a result of O→Mo charge transfer. Furthermore, because of the increased electrical conductivity of the reduced species, the variation of its electrochemical impedance signal can be used to detect the light signal variation. The reduction of polyoxomolybdate is firstly used to detect weak visible light, and the optical signals can be converted into electrical signals. Moreover, the polyoxomolybdate composite can be drip-coated on the surface of the screen printed chip electrode, which not only realizes the rapid detection of weak lights, but also shows the potential compatibility with portable devices.
Declaration of competing interest
All the authors declare that they have no known competing financial interests or personal relationships that could have appeared to influence the work reported in this paper.
Acknowledgments
We gratefully acknowledge the financial support from the National Natural Science Foundation of China (No. 21971085) and the Natural Science Foundation of Shandong Province (No. ZR2019MB004).
Supplementary materials
Supplementary material associated with this article can be found, in the online version, at doi:10.1016/j.cclet.2022.02.036.
[1]
C.B. Fan, L. Le Gong, L. Huang, et al., Angew. Chem. Int. Ed. 56 (2017) 7900–7906. doi: 10.1002/anie.201702484
[2]
R. Pardo, M. Zayat, D. Levy, Chem. Soc. Rev. 40 (2011) 672–687. doi: 10.1039/c0cs00065e
[3]
Y. Qi, W. Niu, S. Zhang, et al., ACS Appl. Mater. Interfaces 12 (2020) 9664–9672. doi: 10.1021/acsami.9b21947
[4]
L. Li, J.R. Wang, Y. Hua, et al., J. Mater. Chem. C 7 (2019) 38–42. doi: 10.1039/c8tc03172j
Figure 1
(a) The ball-stick presentation of the crystal structure of Pb3Mo18. Polyhedra represent polyoxoanion; color codes: Pb, black; O, pink or red; N, blue; C, gray. H atoms are omitted for clarity. (b) The ball-stick presentation of the local coordination mode in the connection between [P2Mo18O62]6− and Pb2+ along ac plane. Polyhedra represent polyoxoanion; color codes: Pb, black; O, pink or red; N, blue; C, gray. H atoms are omitted for clarity.
Figure 2
(a) Colour changes of Pb3Mo18via the 300 W Xe lamp exposure for different time (left) and UV–vis diffuse reflectance spectra of Pb3Mo18 in the solid state upon the 300 W Xe lamp irradiation at room temperature in air (right). (b) Color changes of Pb3Mo18via the 5 W LED light exposure for different time (left) and UV–vis diffuse reflectance spectra of Pb3Mo18 in the solid state upon different time of 5 W LED irradiation at room temperature (right). XPS spectra of Mo 3d in the illuminated Pb3Mo18 by the LED light for different time: (c) 15 min; (d) 30 min; (e) 45 min and (f) 60 min.
Figure 3
(a) Cyclic voltammograms of Pb3Mo18 and P2Mo18. (b) The coordination environments of the seven-coordinated (top) and six-coordinated (bottom) Pb(II) ions in Pb3Mo18.
Figure 4
(a) Nyquist plots of Pb3Mo18 illuminated by 5 W LED light; Inset: the equivalent circuit diagram. (b) The schematic diagram of the blank screen printed chip electrode (top) and Pb3Mo18 coated on the screen printed chip electrode (bottom). (c) Nyquist plots of Pb3Mo18 illuminated by 300 W Xe lamp. Inset: the equivalent circuit diagram. (d) The values of Rp obtained at different height for 254 nm, 365 nm, 5 W LED light and 300 W Xe lamp.

 DownLoad:

 下载:
下载:


