引用本文:
王建国, 李纯斌, 姜国玉. 氨肽酶N荧光探针的研究进展[J]. 化学通报,
2018, 81(11): 972-980.

Citation: Wang Jianguo, Li Chunbin, Jiang Guoyu. Progress in Fluorescent Probes for Aminopeptidase N[J]. Chemistry, 2018, 81(11): 972-980.
Citation: Wang Jianguo, Li Chunbin, Jiang Guoyu. Progress in Fluorescent Probes for Aminopeptidase N[J]. Chemistry, 2018, 81(11): 972-980.
氨肽酶N荧光探针的研究进展
English
Progress in Fluorescent Probes for Aminopeptidase N
Abstract:
Aminopeptidase N (APN) is an exopeptidase that widely exists in the body of mammals. It is recognized to have various physiological functions in human body. Herein, the development of fluorescent probes for aminopeptides N was reviewed and generally divided into two categories:affinity based fluorescent probes and reaction based fluorescent probes, with their advantages and shortcomings compared, which may illuminate the future development of APN fluorescent probes.
-
Key words:
- Aminopeptidase N
- / Fluorescent probe
- / Affinity based probes
- / Reaction based probes
-
氨肽酶N(Aminopeptidase N,APN,EC 3.4.11.2,又叫丙氨酸氨基肽酶或CD13)是一种锌离子依赖的外肽酶,可从蛋白质多肽链的N末端水解中性或碱性氨基酸,从而激活体内一系列重要的生化反应。APN广泛存在于哺乳动物体内,以同源二聚体的形式存在于细胞膜上,并且在人体中具有多种重要的生理功能[1~3]。尿液中APN可在尿微蛋白仍在正常水平时就能指示早期肾脏损伤,因此可作为肾小球肾炎的早期生物标志物[4]。另一方面,研究发现,APN在肿瘤细胞表面大量表达,并在癌症侵袭、转移和血管生产过程中具有重要作用[5~9]。近年来的研究结果表明,APN与原发肿瘤和继发肿瘤的生长,血管生成密切相关,并对肿瘤的增殖分化起到促进作用[10, 11]。因此APN也可作为癌症诊断的标志物。鉴于此,发展高灵敏度、高选择性的APN实时检测方法将为APN相关疾病的诊断及病理生理学说明提供可能性。
荧光光谱法由于具有简单方便、无损伤、可实时检测、灵敏度高、时空分辨率高、可用于活体成像等独特优势备受关注[12~17]。目前用于APN检测的荧光探针主要分为两大类:一类是亲和力型探针,另一类是反应型荧光探针。本文将对这两类APN荧光探针进行综述。
1. 氨肽酶N荧光探针
1.1 亲和力型APN荧光探针
1.1.1 NGR(Asn-Gly-Arg)亲和力型APN荧光探针
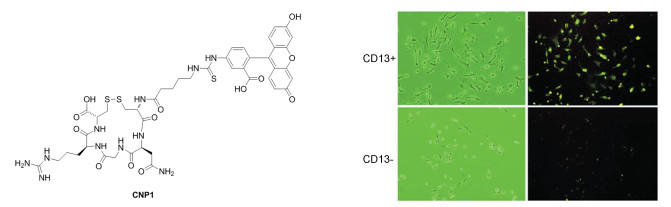
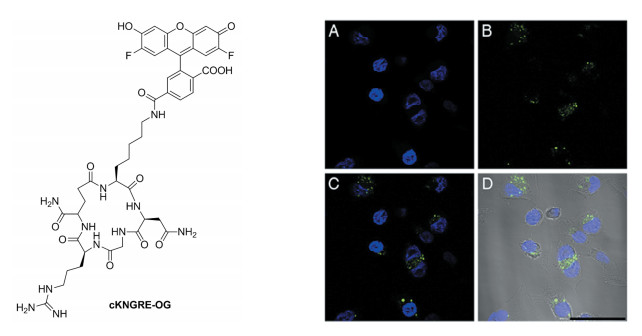
NGR是一个三肽,可以特异性地固定在肿瘤内皮的APN上,因此对APN具有一定的亲和力[18, 19]。基于NGR对APN的亲和力,许多科学家设计合成了NGR为基础的APN荧光探针。2005年,Zhang等[20]设计合成了三种荧光素-多肽复合物CNP1-3,如图 1所示,其中连接有NGR的分子CNP-1能够选择性地标记HT-1080癌细胞表面过表达的APN,产生荧光信号,从而使CNP-1有望用作癌细胞靶向分子成像的荧光探针。2008年,Wallbrunn等[21]将NGR键合到花菁染料Cy5.5上得到NGR-Cy5.5,并将其应用于裸鼠移植瘤中的APN表达量的检测。虽然环状NGR对APN的亲和力较强,但是在应用到脂质体中时,环状NGR中的二硫键容易与脂质体表面的邻近多肽形成二硫键,从而导致脂质体的失活,这在脂质体载药过程中是非常不利的。2010年,Negussie等[22]对NGR进行改进,合成了不含有二硫键的环状NGR,将其与荧光素Oregon Green 488共价键合,得到cKNGRE-OG,如图 2所示。荧光成像结果显示,cKNGRE-OG对APN过表达的HT-1080细胞仍保持较强的结合能力,同时对不表达APN的MCF7细胞保持较低的结合率[22]。
图 1
图 2
 图 2. 探针cKNGRE-OG的结构及其在HT-1080(CD13+)细胞中的荧光成像图[22] (A)细胞核定位试剂DAPI的蓝色荧光,(B) cKNGRE-OG的绿色荧光,(C) A和B的叠加图,(D) A和B的叠加图与Dodt contrast显示细胞边界(标尺表示50μm)Figure 2. Structure of probe cKNGRE-OG and confocal microscopy to evaluate internalization of cKNGRE-OG in HT-1080 cells at 37℃[22] Blue signal from the nuclear staining agent DAPI (A), Green signal from cKNGRE-OG (B), merged image of A and B (C), and merged image of A and B with Dodt contrast to visualize cell boundaries (D). Bar equals 50μm
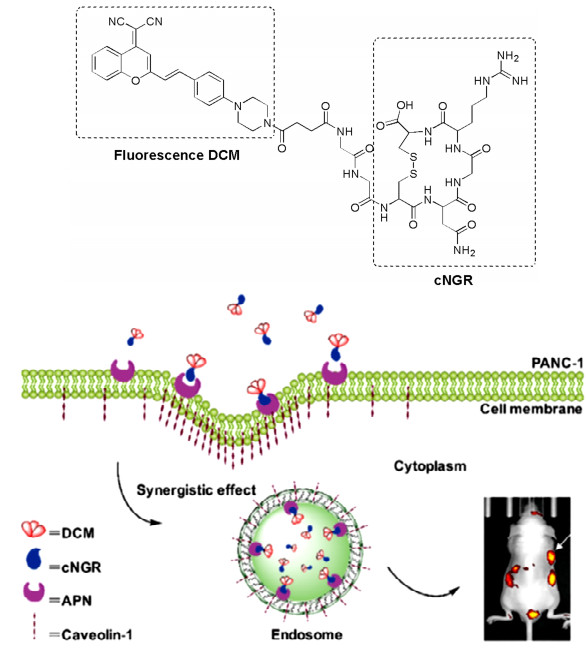
2018年,Tang等[23]报道了APN荧光探针DCM-cNGR(图 3),它在近红外长波长发光,具有良好的光稳定性和低毒性,并能与小窝蛋白-1(caveolin-1)介导的细胞内吞协同作用,迅速在胰腺导管腺癌(PDAC)细胞中富集。通过静脉注射,DCM-cNGR能够在裸鼠PANC-1移植瘤中实现无损伤NIR成像,为胰腺癌的精准诊断和治疗提供可能性。
图 3

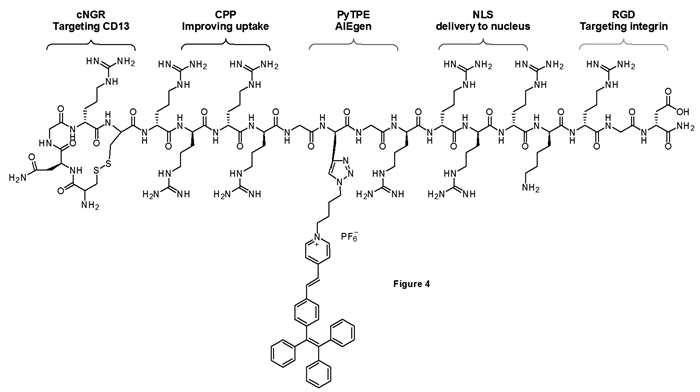
聚集诱导发光(Aggregation-induced emission,AIE)是2001年由唐本忠提出的一种不同于传统荧光材料的独特发光现象,经过近20年研究,AIE材料已经在化学/生物传感[24]、生物成像[25~28]、工程材料等领域取得了巨大的研究进展。其中,四苯乙烯更是作为AIE材料的明星分子被广泛研究。2017年,Cheng等[29]利用AIE现象在四苯乙烯荧光分子上共价修饰了两种靶向多肽(NGR和RGD)、一种细胞穿膜肽(CPP)和一种细胞核定位信号,得到了具有双重靶向能力和细胞核定位能力的多功能荧光探针TCNTP,用于癌细胞长时荧光跟踪成像(图 4)。由于修饰了多肽,TCNTP在水溶液中具有很好的水溶性,能量通过非辐射失活的方式耗散,荧光被猝灭。当存在APN和整合蛋白αvβ3时,TCNTP可以分别利用NGR和RGD的靶向能力特异性地结合到两种蛋白上,此时,分子内的运动受到限制,非辐射失活大大降低,发出强的黄色荧光。由于含有CPP,TCNTP可以有效穿过细胞膜进入细胞质,并通过NLS的定位作用进入细胞核,在APN和αvβ3过表达的细胞中产生强荧光。该探针细胞毒性低,并可用于细胞中长时跟踪荧光成像。
图 4
1.1.2 抑制剂亲和力型APN荧光探针
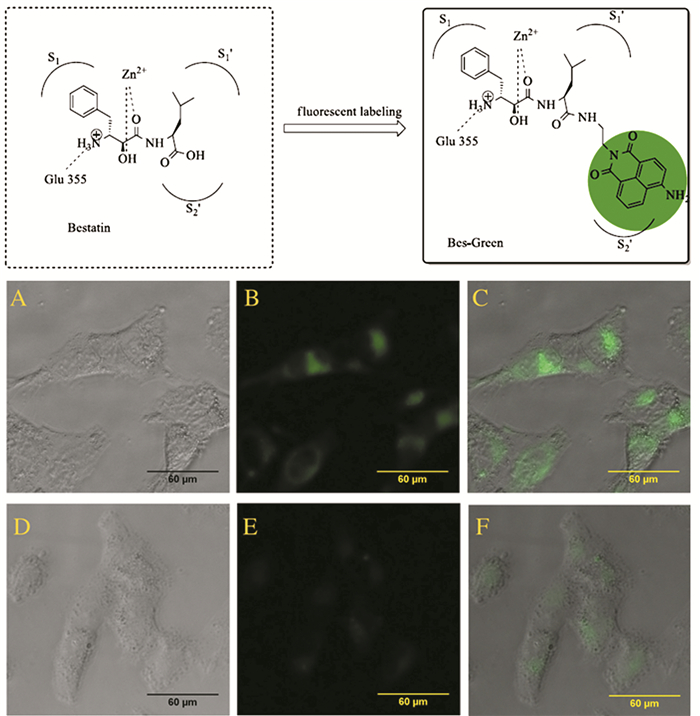
目前文献已经报道了多种天然的或者人工合成的APN抑制剂,详见参考文献[2, 18]。其中应用最为广泛的抑制剂是乌苯美司(Ubenime,又名bestatin),它是1976年由日本学者梅泽滨夫从橄榄网状链霉菌(Streptomyces olivoreticuli)的培养液中分离出来的一种低分子二肽化合物(图 5),其结构中的芳香环和亮氨酸残基的脂肪链可以通过疏水作用嵌入APN的S1和S1′空腔中,而2-羟基和羧基基团可以与APN的Zn2+配位,质子化的氨基可以提供与近S1空腔的Glu344结合的盐桥,因此bestatin对APN具有很好的抑制作用[18, 30]。2015年,Chen等[31]将bestatin中的羧基与4-氨基-1, 8-萘二酰亚胺缩合得到APN荧光探针Bes-Green,它具有与bestatin相当的APN抑制能力,并且能够用于ES-2活细胞中内源性APN荧光成像。
图 5
 图 5. Bes-Green的设计策略示意图及其在ES-2活细胞中荧光成像图[31]:ES-2细胞与Bes-Green孵化2h后的亮场(A),绿色通道(B)及叠加图(C);ES-2细胞与Bes-Green及APN抑制剂Bestatin孵化2h后的亮场(D),绿色通道(E)及叠加图(F)Figure 5. The design strategy of probe Bes-Green and fluorescence images of living ES-2 cells with Bes-Green[31]: ES-2 cells incubated with the Bes-Green for 2 h: (A) bright-field, (B) green channel, (C) merge of (A) and (B); ES-2 cells incubated with the Bes-Green and Bestatin for 2 h: (D) bright-field, (E) green channel, (F) merge of (D) and (E)
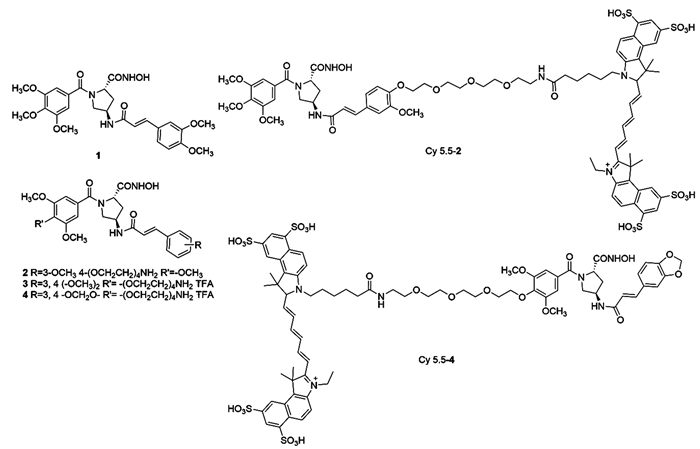
2013年,Höltke等以APN抑制剂1为先导化合物,设计合成出三种新型非肽类小分子APN抑制剂2~4,并将化合物2和4共价键合到Cy5.5上,得到两种APN荧光探针Cy5.5-2和Cy5.5-4,如图式 1所示。其中,Cy5.5-4能够在APN过表达的人乳腺癌细胞BT-549细胞中荧光成像[32]。
图式 1

1.2 反应型APN荧光探针
亲和力型APN荧光探针虽然能够用于癌细胞或者肿瘤移植裸鼠中进行荧光成像,但是其背景干扰大,严重影响成像的质量。为了解决这一问题,科学家们逐渐开发了反应型APN荧光探针。反应型APN荧光探针本身不发光,只有被APN降解后才能发出强荧光,因此能够大大降低非靶背景信号。
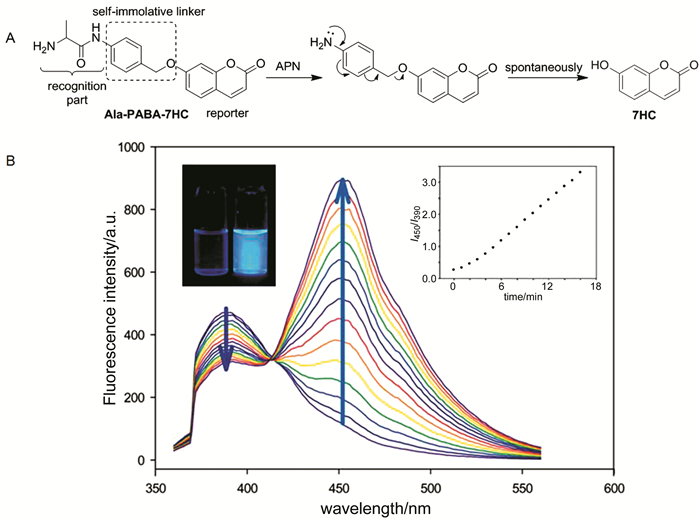
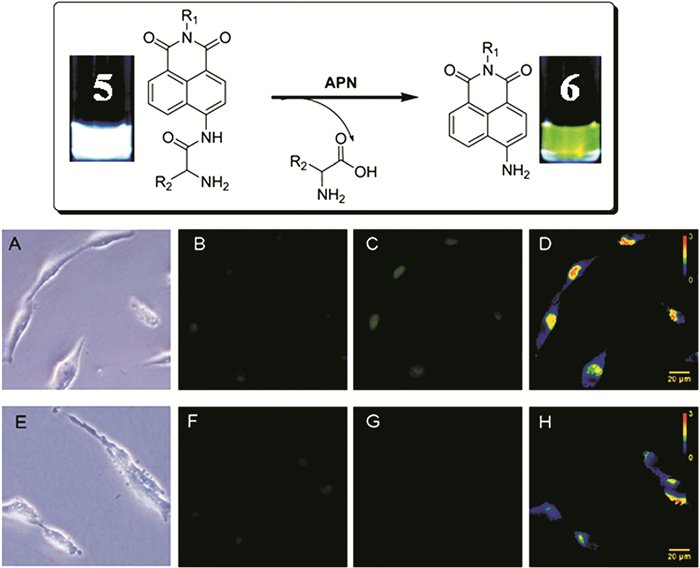
2012年,Li等[33]报道了第一个反应型比率APN荧光探针Ala-PABA-7HC。他们将丙氨酸残基与7-羟基香豆素通过对氨基苯甲醇linker共价键合,得到Ala-PABA-7HC,如图 6所示。Ala-PABA-7HC在390nm处具有强荧光。当Ala-PABA-7HC中氨基酸与linker之间的酰胺键被APN催化断裂之后,可发生自降解,释放出在450nm具有强荧光的7-羟基香豆素。Ala-PABA-7HC可用于简便经济的APN抑制剂高通量筛选方法中,但是由于其发光波长较短,细胞或组织背景干扰大,因此不适合用于细胞或活体成像中。为了解决这一问题,2013年,他们又用同样的方法设计合成了第一个用于细胞内APN荧光成像的比率型APN荧光探针5(图 7)。它能够在APN高表达的ES-2细胞中产生强的蓝色荧光,并且能够进入细胞核。分子5有望作为APN高表达癌细胞系的诊断探针[34]。
图 6
 图 6. (A) 荧光探针Ala-PABA-7HC的结构及其检测APN的响应机制示意图;(B) Ala-PABA-7HC在Tris-HCl缓冲液(100mmol/L, pH 7.5)中与APN反应前后的荧光光谱。左侧插图为Ala-PABA-7HC在加入APN前后在紫外灯照射下的荧光照片;右侧插图为450nm和390nm处荧光强度的比值与APN孵化时间的关系图[33]Figure 6. (A) Structures of Ala-PABA-7HC and mechanism for the detection of APN activity. (B) Emission spectra of Ala-PABA-7HC in the presence of APN (0.01U) in a Tris-HCl buffer (100mmol/L, pH 7.5). Insets: (left) fluorescence images of Ala-PABA-7HC before and after addition of APN (0.01U) in a Tris-HCl buffer; (right) ratios of fluorescent intensities at 450 and 390nm as a function of time after addition of APN[33]
图 7
 图 7. 上图:探针5的检测机制。中图:ES-2活细胞荧光成像图:ES-2细胞与探针5孵化15min的亮场(A),蓝色通道(B),绿色通道(C)及(B)和(C)的比值(D)。底图:ES-2细胞与探针5和Bestatin孵化15min的亮场(E),蓝色通道(F),绿色通道(G)及(F)和(G)的比值(H)[34]Figure 7. Top: plausible detection mechanism of probe 5. Middle: fluorescence images of living ES-2 cells: ES-2 cells incubated with the probe 5 (5μM) for 15 min: (A) bright- field, (B) blue channel, (C) green channel, (D) ratio of (C) and (B). Bottom: ES-2 cells incubated with the probe 5 (5μM) and Bestatin (4.9 mM) for 5 min: (E) bright-field, (F) blue channel, (G) green channel, (H) ratio of (G) and (F)[34]
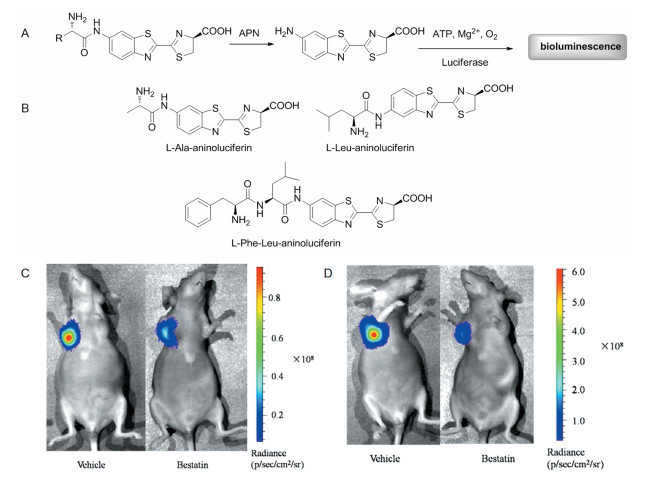
2014年,Li等[35]又利用生物发光法设计合成了3个反应型APN探针,L-Ala-aminoluciferin,L-Leu-aminoluciferin和L-Phe-Leu-aminoluciferin(图 8)。生物发光法利用萤火虫的荧光素酶在ATP、氧气和Mg2+存在条件下可自发产生发光而不需要激发光源的特点,被广泛应用于生命科学领域的病原菌检测、癌细胞成像及治疗药物的筛选中。三个探针均可在APN高表达的ES-2细胞中产生强的生物发光。L-Ala-aminoluciferinL和L-Leu-aminoluciferin能够在带有移植瘤的裸鼠中进行生物成像,是第一次用于深层组织和小动物活体生物成像的APN探针。
图 8
 图 8. (A) APN生物发光探针的检测机制;(B) APN生物发光探针的结构;(C)探针L-Ala-aminoluciferin在ES-2-luc细胞中对APN活性的生物发光成像图;(D)探针L-Leu-aminoluciferin在ES-2-luc细胞中对APN活性的生物发光成像图[35]Figure 8. (A) Schematic of bioluminogenic probes for detecting APN activity; (B) The structures of APN probes; (C) Representative bioluminescence imaging of APN activity in the implanted ES-2-luc cells for probe L-Ala-aminoluciferin; (D) Representative bioluminescence imaging of APN activity in the implanted ES-2-luc cells for probe L-Leu-aminoluciferin[35]
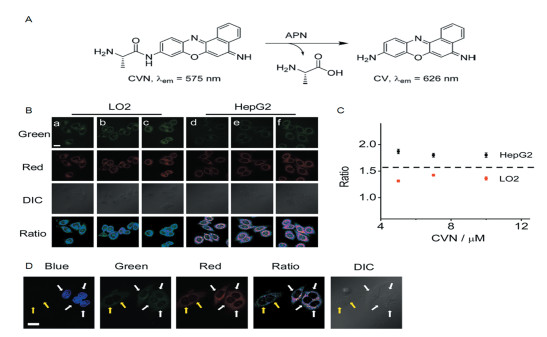
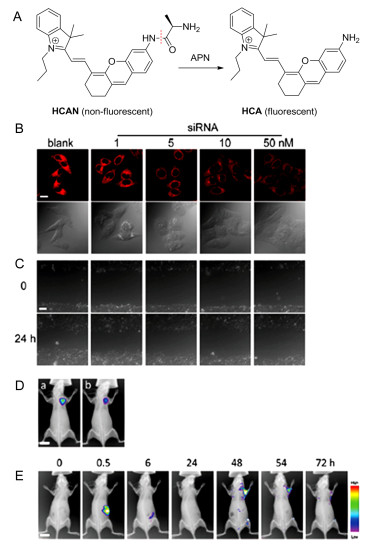
为了进一步延长探针的激发波长和发射波长,降低生物组织背景干扰,增加组织穿透深度和成像深度,He等[36]设计了具有红色荧光发射的反应型APN荧光探针CVN(图 9)。CVN是将丙氨酸通过酰胺键与荧光化合物甲酚紫键合得到,CVN与APN反应之前,在575nm具有强荧光,与APN反应之后,生成在626nm具有强荧光的结晶紫(CV),因此CVN可以是一个比率型的APN荧光探针。CVN对APN的灵敏度非常高,检测限可达33pg/mL,可在稀释了500倍的尿液中定量检测APN,为肾小球性肾炎的临床诊断应用奠定了实验基础。通过荧光成像,CVN可有效区分APN过表达的肝癌细胞HepG和APN低表达的正常肝细胞LO2,有望用于APN相关疾病的诊断和研究中。随后,该小组又进一步合成了具有近红外发光能力的反应型APN荧光探针HCAN(图 10)。他们将丙氨酸通过酰胺键键合到半花菁荧光染料上,酰胺键的强拉电子能力可以有效猝灭探针HCAN的发光,背景荧光非常低。只有和APN反应之后,HCAN中的酰胺键被断裂释放出具有强近红外光发射能力的HCA,从而可以用于生物样品中高灵敏度检测APN。HCAN也可通过荧光成像用于区分APN过表达的肝癌细胞HepG和APN低表达的正常肝细胞LO2,并且结合划痕实验,他们发现,肝癌细胞的迁移能力与APN的活性呈现正相关。HCAN还被首次用于荷瘤小鼠中APN荧光成像,有望为癌症诊断和细胞内APN功能的研究提供可视化手段[37]。
图 9
 图 9. (A) CVN的结构及其与APN的反应机制;(B)与不同浓度的CVN(a和d:5μmol/L;b和e:7μmol/L;c和f:10μmol/L)孵化50min后的LO2细胞(a~c)和HepG细胞(d~f)的荧光成像示意图;(C)图(B)中相应荧光成像图的荧光比率(红光/绿光);(D)LO2和HepG2细胞的混合物与探针CVN的激光共聚焦成像图;HepG2细胞预先与Hoechst-33342(蓝色荧光)共染;白色箭头指示HepG2细胞,其细胞核为蓝色荧光,黄色箭头指示LO2细胞;标尺:20μm[36]Figure 9. (A) Structure of CVN and its reaction with APN; (B) Fluorescence images of (a~c) LO2 and (d~f) HepG2 cells incubated with varied concentrations of CVN (columns a and d: 5μmol/L; columns b and e: 7μmol/L columns c and f: 10μmol/L) for 50 min; (C) Fluorescence ratios (red/green) of the corresponding fluorescence images in panel B; (D) Representative bioluminescence imaging of APN activity in the implanted ES-2-luc cells for probe L-Leu-aminoluciferin[36]
图 10
 图 10. (A) HCAN的化学结构及其与APN的反应;(B) HepG2细胞的激光共聚焦荧光成像图,HepG2细胞预先用不同浓度的siRNA (0, 1, 5, 10, 50 nmol/L)处理4h,之后再与5μmol/L HCAN孵化,相应样本的DIC图放在其荧光图的下面,标尺:20μm;(C)不同浓度的siRNA (0, 1, 5, 10, 50nmol/L)处理之后的HepG2细胞24h的划痕迁移图,标尺:100μm;(D)荷瘤小鼠的体内荧光成像:对小鼠瘤内注射50μL生理盐水(a)或bestatin (100μmol/L的生理盐水溶液) (b),1h后再瘤内注射50μmol/L的HCAN的生理盐水50μL;(E)尾静脉注射100μLHCAN后的荷瘤小鼠的体内成像图:标尺:1cm[37]Figure 10. (A) Structure of HCAN and its reaction with APN; (B) Confocal fluorescence images of HepG2 cells pretreated with varied concentrations of siRNA (0, 1, 5, 10 and 50nmol/L) for 4 h and then incubated with HCAN (5μmol/L). The DIC images of the corresponding samples are shown below. Scale bar, 20μm; (C) Scratch assay images of HepG2 cells with varied concentrations of siRNA (0, 1, 5, 10 and 50nmol/L) for 24 h migration. Scale bar, 100μm; (D) In vivo fluorescence imaging of tumor-bearing mice. The mice were intratumorally injected with 50 μL of (a) saline and (b) bestatin (100μmol/L in saline) for 1 h, and then subjected to the intratumoral injection of 50 μL of HCAN (50μmol/L) in saline; (E) In vivo fluorescence imaging of tumor-bearing mice after intravenous injection of 100 μL of probe HCAN (300μmol/L in saline) via the tail vein. Scale bar, 1cm[37]
2. 结语
综上所述,APN荧光探针的研究近年来备受国内外学者的关注,并在改进其灵敏度及设计近红外荧光探针用于活体细胞或小动物原位实时在线检测和图像传感、降低背景干扰等方面取得了一定的成就。比较亲和力型和反应型APN荧光探针可以发现,反应型荧光探针通过探针与APN的作用引起反应前后荧光强度或者比率的较大变化,能够有效降低背景干扰,因此在近年来APN荧光探针的设计开发中越来越受到关注。今后,综合考虑荧光探针分子设计的有关因素,设计合成廉价易得、生物兼容性强、和光化学性能优异的探针分子,如利用聚集诱导发光分子的独特发光优势设计合成反应型APN荧光探针,或者通过键合抗癌药物设计合成兼具荧光成像和抗癌活性于一身的癌症诊疗试剂,并将其应用于临床疾病诊断或生物化学中APN功能的研究将是人们努力的方向。
-
-
[1]
Y P Luan, W F Xu. Curr. Med. Chem., 2007, 14(6): 639~647. doi: 10.2174/092986707780059571
-
[2]
B Bauvois, D Dauzonne. Med. Res. Rev., 2006, 26(1): 88~130. doi: 10.1002/med.20044
-
[3]
P Mina-Osorio. Trends Mol. Med., 2008, 14(8): 361~371. doi: 10.1016/j.molmed.2008.06.003
-
[4]
B Holdt-Lehmann, A Lehmann, G Korten et al. Clin. Chim. Acta, 2000, 297(1): 93~102. https://www.sciencedirect.com/science/article/pii/S0009898100002370
-
[5]
S X Cui, X J Qu, Z H Gao et al. Cancer Lett., 2010, 292(2): 153~162. doi: 10.1016/j.canlet.2009.11.021
-
[6]
D Fontijn, M C Duyndam, M P van Berkel et al. Br. J. Cancer, 2006, 94(11): 1627~1636. doi: 10.1038/sj.bjc.6603157
-
[7]
T Tokuhara, N Hattori, H Ishida et al. Clin. Cancer Res., 2006, 12(13): 3971~3978. doi: 10.1158/1078-0432.CCR-06-0338
-
[8]
C Mawrin, C Wolke, D Haase et al. Brain Pathol., 2010, 20(1): 200~210. doi: 10.1111/j.1750-3639.2009.00267.x
-
[9]
N Petrovic, W Schacke, J R Gahagan et al. Blood, 2007, 110(1): 142~150. doi: 10.1182/blood-2006-02-002931
-
[10]
M Terauchi, H Kajiyama, K Shibata et al. BMC Cancer, 2007, 7(1): 140~153. doi: 10.1186/1471-2407-7-140
-
[11]
P Mina-Osorio. Trends Mol. Med., 2008, 14(8): 361~371. doi: 10.1016/j.molmed.2008.06.003
-
[12]
X C Gao, R X Cui, G F Ji et al. Nanoscale, 2018, 10(13): 6205~6211. doi: 10.1039/C7NR08892B
-
[13]
Y Z Chen, X M Shi, Z L Lu et al. Anal. Chem., 2017, 89(10): 5278~5284. doi: 10.1021/acs.analchem.6b04810
-
[14]
J G Wang, X G Gu, P F Zhang et al. J. Am. Chem. Soc., 2017, 139(46): 16974~16979. doi: 10.1021/jacs.7b10150
-
[15]
G Y Jiang, G J Zeng, W P Zhu et al. Chem. Commun., 2017, 53(32): 4505~4508. doi: 10.1039/C7CC00249A
-
[16]
F Hu, Y Y Huang, G X Zhang et al. Anal. Chem., 2014, 86(15): 7987~7995. doi: 10.1021/ac502103t
-
[17]
X G Gu, G X Zhang, D Q Zhang, Analyst, 2012, 137(2): 365~369.
-
[18]
L Z Chen, J J Mou, Y Y Xu et al. Drug Discov. Ther., 2011, 5(2): 61~65. doi: 10.5582/ddt.2011.v5.2.61
-
[19]
Y Ma, Q Y Tang, J Zhu et al. Chin. Chem. Lett., 2014, 25(5): 680~686. doi: 10.1016/j.cclet.2014.01.048
-
[20]
Z E Zhang, H Harada, K Tanabe et al. Peptides, 2005, 26(11): 2182~2187. doi: 10.1016/j.peptides.2005.03.049
-
[21]
A von Wallbrunn, J Waldeck, C H ltke et al. J. Biomed. Opt., 2008, 13(1): 011007. doi: 10.1117/1.2839046
-
[22]
A H Negussie, J L Miller, G Reddy et al. J. Control. Release, 2010, 143(2): 265~273. doi: 10.1016/j.jconrel.2009.12.031
-
[23]
Y Tang, A Shao, J Cao et al. Sci China Chem., 2018, 61(2): 184~191. doi: 10.1007/s11426-017-9092-9
-
[24]
Y Zhang, W Xu, L Kong et al. Mater. Chem. Front., 2018, DOI: 10.1039/C8QM00235E.
-
[25]
X Gu, X Zhang, H Ma et al. Adv. Mater., 2018, DOI: 10.1002/adma.201801065.
-
[26]
X Gu, E Zhao, T Zhao et al. Adv. Mater., 2016, 28(25): 5064~5071. doi: 10.1002/adma.201505906
-
[27]
X Gu, E Zhao, J W Y Lam et al. Adv. Mater., 2015, 27(44): 7093~7100. doi: 10.1002/adma.201503751
-
[28]
X Gu, R T K Kwok, J W Y Lam et al. Biomaterials, 2017, 146: 115~135. doi: 10.1016/j.biomaterials.2017.09.004
-
[29]
Y Cheng, C L Sun, X W Ou et al. Chem. Sci., 2017, 8(6): 4571~4578. doi: 10.1039/C7SC00402H
-
[30]
W Xu, Q Li. Curr. Med. Chem., 2005, 5(3): 281~301. https://www.researchgate.net/publication/8013661_Novel_Anticancer_Targets_and_Drug_Discovery_in_Post_Genomic_Age
-
[31]
H Chen, H Wang, X J Qin et al. Chin. Chem. Lett., 2015, 26(5): 513~516. doi: 10.1016/j.cclet.2015.01.023
-
[32]
A Hahnenkamp, M Schäfers, C Bremer et al. Bioconjugate Chem., 2013, 24(6): 1027~1038. doi: 10.1021/bc400074w
-
[33]
L Chen, W Sun, W Li et al. Anal. Methods, 2012, 4(9): 2661~2663. doi: 10.1039/c2ay25556a
-
[34]
L Chen, W Sun, J Li et al. Org. Biomol. Chem., 2012, 11(2): 378~382. https://www.researchgate.net/publication/233750313_The_first_ratiometric_fluorescent_probe_for_aminopeptidase_N
-
[35]
J Li, L Chen, W Wu et al. Anal. Chem., 2014, 86(5): 2747~2751. doi: 10.1021/ac404176x
-
[36]
X He, Y Xu, W Shi et al. Anal. Chem., 2017, 89(5): 3217~3221. doi: 10.1021/acs.analchem.7b00021
-
[37]
X He, Y Hu, W Shi et al. Chem. Commun., 2017, 53(68): 9438~9441. doi: 10.1039/C7CC05142E
-
[1]
-

图 2 探针cKNGRE-OG的结构及其在HT-1080(CD13+)细胞中的荧光成像图[22] (A)细胞核定位试剂DAPI的蓝色荧光,(B) cKNGRE-OG的绿色荧光,(C) A和B的叠加图,(D) A和B的叠加图与Dodt contrast显示细胞边界(标尺表示50μm)
Figure 2 Structure of probe cKNGRE-OG and confocal microscopy to evaluate internalization of cKNGRE-OG in HT-1080 cells at 37℃[22] Blue signal from the nuclear staining agent DAPI (A), Green signal from cKNGRE-OG (B), merged image of A and B (C), and merged image of A and B with Dodt contrast to visualize cell boundaries (D). Bar equals 50μm
图 5 Bes-Green的设计策略示意图及其在ES-2活细胞中荧光成像图[31]:ES-2细胞与Bes-Green孵化2h后的亮场(A),绿色通道(B)及叠加图(C);ES-2细胞与Bes-Green及APN抑制剂Bestatin孵化2h后的亮场(D),绿色通道(E)及叠加图(F)
Figure 5 The design strategy of probe Bes-Green and fluorescence images of living ES-2 cells with Bes-Green[31]: ES-2 cells incubated with the Bes-Green for 2 h: (A) bright-field, (B) green channel, (C) merge of (A) and (B); ES-2 cells incubated with the Bes-Green and Bestatin for 2 h: (D) bright-field, (E) green channel, (F) merge of (D) and (E)
图 6 (A) 荧光探针Ala-PABA-7HC的结构及其检测APN的响应机制示意图;(B) Ala-PABA-7HC在Tris-HCl缓冲液(100mmol/L, pH 7.5)中与APN反应前后的荧光光谱。左侧插图为Ala-PABA-7HC在加入APN前后在紫外灯照射下的荧光照片;右侧插图为450nm和390nm处荧光强度的比值与APN孵化时间的关系图[33]
Figure 6 (A) Structures of Ala-PABA-7HC and mechanism for the detection of APN activity. (B) Emission spectra of Ala-PABA-7HC in the presence of APN (0.01U) in a Tris-HCl buffer (100mmol/L, pH 7.5). Insets: (left) fluorescence images of Ala-PABA-7HC before and after addition of APN (0.01U) in a Tris-HCl buffer; (right) ratios of fluorescent intensities at 450 and 390nm as a function of time after addition of APN[33]
图 7 上图:探针5的检测机制。中图:ES-2活细胞荧光成像图:ES-2细胞与探针5孵化15min的亮场(A),蓝色通道(B),绿色通道(C)及(B)和(C)的比值(D)。底图:ES-2细胞与探针5和Bestatin孵化15min的亮场(E),蓝色通道(F),绿色通道(G)及(F)和(G)的比值(H)[34]
Figure 7 Top: plausible detection mechanism of probe 5. Middle: fluorescence images of living ES-2 cells: ES-2 cells incubated with the probe 5 (5μM) for 15 min: (A) bright- field, (B) blue channel, (C) green channel, (D) ratio of (C) and (B). Bottom: ES-2 cells incubated with the probe 5 (5μM) and Bestatin (4.9 mM) for 5 min: (E) bright-field, (F) blue channel, (G) green channel, (H) ratio of (G) and (F)[34]
图 8 (A) APN生物发光探针的检测机制;(B) APN生物发光探针的结构;(C)探针L-Ala-aminoluciferin在ES-2-luc细胞中对APN活性的生物发光成像图;(D)探针L-Leu-aminoluciferin在ES-2-luc细胞中对APN活性的生物发光成像图[35]
Figure 8 (A) Schematic of bioluminogenic probes for detecting APN activity; (B) The structures of APN probes; (C) Representative bioluminescence imaging of APN activity in the implanted ES-2-luc cells for probe L-Ala-aminoluciferin; (D) Representative bioluminescence imaging of APN activity in the implanted ES-2-luc cells for probe L-Leu-aminoluciferin[35]
图 9 (A) CVN的结构及其与APN的反应机制;(B)与不同浓度的CVN(a和d:5μmol/L;b和e:7μmol/L;c和f:10μmol/L)孵化50min后的LO2细胞(a~c)和HepG细胞(d~f)的荧光成像示意图;(C)图(B)中相应荧光成像图的荧光比率(红光/绿光);(D)LO2和HepG2细胞的混合物与探针CVN的激光共聚焦成像图;HepG2细胞预先与Hoechst-33342(蓝色荧光)共染;白色箭头指示HepG2细胞,其细胞核为蓝色荧光,黄色箭头指示LO2细胞;标尺:20μm[36]
Figure 9 (A) Structure of CVN and its reaction with APN; (B) Fluorescence images of (a~c) LO2 and (d~f) HepG2 cells incubated with varied concentrations of CVN (columns a and d: 5μmol/L; columns b and e: 7μmol/L columns c and f: 10μmol/L) for 50 min; (C) Fluorescence ratios (red/green) of the corresponding fluorescence images in panel B; (D) Representative bioluminescence imaging of APN activity in the implanted ES-2-luc cells for probe L-Leu-aminoluciferin[36]
图 10 (A) HCAN的化学结构及其与APN的反应;(B) HepG2细胞的激光共聚焦荧光成像图,HepG2细胞预先用不同浓度的siRNA (0, 1, 5, 10, 50 nmol/L)处理4h,之后再与5μmol/L HCAN孵化,相应样本的DIC图放在其荧光图的下面,标尺:20μm;(C)不同浓度的siRNA (0, 1, 5, 10, 50nmol/L)处理之后的HepG2细胞24h的划痕迁移图,标尺:100μm;(D)荷瘤小鼠的体内荧光成像:对小鼠瘤内注射50μL生理盐水(a)或bestatin (100μmol/L的生理盐水溶液) (b),1h后再瘤内注射50μmol/L的HCAN的生理盐水50μL;(E)尾静脉注射100μLHCAN后的荷瘤小鼠的体内成像图:标尺:1cm[37]
Figure 10 (A) Structure of HCAN and its reaction with APN; (B) Confocal fluorescence images of HepG2 cells pretreated with varied concentrations of siRNA (0, 1, 5, 10 and 50nmol/L) for 4 h and then incubated with HCAN (5μmol/L). The DIC images of the corresponding samples are shown below. Scale bar, 20μm; (C) Scratch assay images of HepG2 cells with varied concentrations of siRNA (0, 1, 5, 10 and 50nmol/L) for 24 h migration. Scale bar, 100μm; (D) In vivo fluorescence imaging of tumor-bearing mice. The mice were intratumorally injected with 50 μL of (a) saline and (b) bestatin (100μmol/L in saline) for 1 h, and then subjected to the intratumoral injection of 50 μL of HCAN (50μmol/L) in saline; (E) In vivo fluorescence imaging of tumor-bearing mice after intravenous injection of 100 μL of probe HCAN (300μmol/L in saline) via the tail vein. Scale bar, 1cm[37]
-

 下载:
下载:

 下载:
下载:


 扫一扫看文章
计量
- PDF下载量: 36
- 文章访问数: 3211
- HTML全文浏览量: 868
