Citation:
Cen Shouyi, Zhang Zhipeng. The Differences between Dormant Period and Induction Period in Catalytic Reactions[J]. Chemistry,
2020, 83(4): 369-376.
Received Date:
26 November 2019 Accepted Date:
15 January 2020 Available Online:
18 April 2020
Abstract:
An initial slow phase which is nominated as induction period usually occurs in many chemical reactions such as some radical reactions, exothermic reactions and catalytic reactions. In contrast, a special phase during which the reaction rate is zero and after which the reaction starts spontaneously, has rarely been observed in a few catalytic reactions. The formation of these two kinds of periods is related to the mechanism of the reaction especially to the catalyst activation or deactivation. However, the two periods have been confused and their obvious distinctions have been neglected in the past. In this perspective, typical kinetic features of induction period and dormant period are demonstrated with selected catalytic reactions, and the differences between them are discussed. In-depth understanding of the pre-catalytic cycle and detailed mechanism of organic reactions are expected if more attentions would be paid to these hidden processes in front of the steady state catalytic cycle.
An initial slow phase during which the formation of desired products is slow, has been observed in a lot of chemical reactions. For instance, the reaction of an organic halide with magnesium, which provides the Grignard reagent, is notorious for having such a slow phase[1]. This is mainly due to the thin film of oxide covered on the magnesium reagent and the heat generated from this exothermic reaction. These external causes are easy to understand and the slow phase doesn't have much to do with the reaction mechanism. While such a slow phase has also been observed in many catalytic reactions, in which the added "catalyst" actually is a pre-catalyst and it takes time for this pre-catalyst to undergo transformation to form catalytically active catalyst. The time required for this transformation is usually considered as the induction period. Although this initial slow phase is not as productive as the steady state catalytic cycle, it is related to the real catalytically active species and crucial to the desired reaction.
1.
Typical Kinetic Features of Cata-lytic Reactions Which Possess an Induction Period
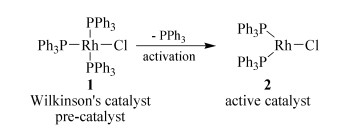
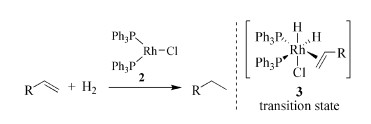
To depict the typical kinetic features of catalytic reactions with an induction period, we take the well-known hydrogenation of alkenes catalyzed by Wilkinson's catalyst as the first example[2~3]. Wilkinson's catalyst is the common name for a coordination complex of Rhodium: chloridotris(triphenylphosphine)rhodium(Ⅰ) 1 (Scheme 1), while this complex actually is a pre-catalyst for the hydrogenation as one of the three triphenylphosphine (PPh3) ligands must be dissociated to generate a coordinatively unsaturated and catalytically active species 2 (Scheme 1) to catalyze the hydrogenation reaction. This pre-catalyst activation process could also be considered as an independent reaction in which the Wilkinson's catalyst 1 is reactant and the generated active species 2 is product, which will further take part in the following catalytic cycle (Scheme 2). As the reaction shown in Scheme 1 proceeds during the induction period, the concentration of the 2 increases gradually which means the catalyst concentration for the reaction shown in Scheme 2 increases. Thus, the reaction rate for Scheme 2 increases gradually until it reaches maximum at a certain time point. After this time point, the steady state catalytic cycle starts and the reaction rate decreases gradually as the concentration of the reactants decreases with the catalytic reaction proceeds.
Scheme 1
图式 1.
Wilkinson催化剂催化的烯烃氢化反应催化剂前体活化过程
Scheme 1.
Pre-catalyst activation process for hydrogenation of alkenes catalyzed by Wilkinson's catalyst
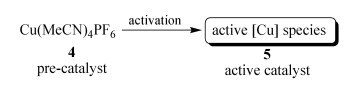
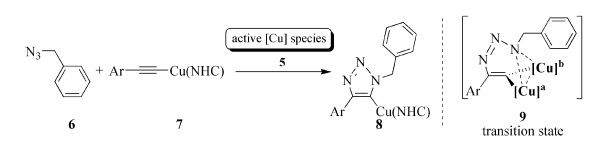
The famous copper(Ⅰ)-catalyzed azide-alkyne cycloaddition (CuAAC) has drawn wide attention in the past two decades, and extensive efforts have been devoted to elucidating the mechanism[4~9]. In 2013, Fokin and coworkers reported their mech-anistic study on the reaction of azide with preformed mononuclear σ-bound copper(Ⅰ)-acetylide catalyzed by exogenous copper species[10] (Scheme 3 and 4). The reaction progress was monitored through real-time heat-flow reaction calorimetry. It shows that there is a clear induction period which lasts for a few minutes before the reaction rate reaches maximum. The existence of the induction period is a sign of pre-catalyst activation process (Scheme 3) in the beginning of the reaction. Although the authors showed clear evidence of a dinuclear copper transition state, they didn't explain why the induction period exists and what the real active [Cu] species is.
Scheme 3
图式 3.
叠氮与σ键一价铜炔环加成反应的催化剂前体活化过程
Scheme 3.
Pre-catalyst activation process for cycloaddition reaction of azide and σ-bound copper(Ⅰ)-acetylide
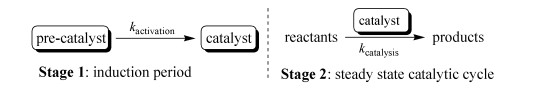
The origin of the frequently observed induction periods in catalytic reactions is easy to understand. The catalytically active species(real catalyst) in catalytic reactions are usually unstable and difficult to isolate, while they can be generated in situ from pre-catalysts, which are catalytically inactive or at least much less active than the real catalysts under related reaction conditions. As aforementioned, it takes time for the pre-catalyst to undergo trans-formation to form catalytically active catalyst, and the time for the pre-catalyst activation process is the induction period (Scheme 5, Stage 1). Theore-tically, any catalytic reaction beginning with a pre-catalyst rather than a real active catalyst should possess an induction period. During the induction period, the concentration of the real catalyst increases. Since the real catalyst usually has a positive order in the rate equation, the gradual increase of its concentration means the reaction rate also increases gradually as shown in Fig. 1A (the reaction accelerates). According to the Compendium of Chemical Terminology, IUPAC[11], "the initial slow phase of a chemical reaction which later accelerates" is termed as induction period. This terminology means during induction period the chemical reaction which forms the desired products is slow, and the reaction rate certainly is not zero. It also means that after the induction period the reaction accelerates, in other words, the reaction rate for generating the desired products will increase. However, here comes some questions: what is the time point between the induction period and later rate-increasing process? When does the induction period end and when does the steady state catalytic cycle start? For a catalytic reaction, according to the IUPAC definition, it would be difficult to determine the time point when the induction period ends, because during the induction period the reaction accelerates and after it the reaction accelerates too. Actually, the period between the starting time point (T0) and the maximum rate time point (Tmax) as shown in Fig. 1A has been widely recognized as the induction period. It is reasonable to pick Tmax as the end of the induction period because it is difficult to figure out another time point on the smoothly increasing reaction rate curve between T0 and Tmax. Although IUPAC definition may still work for radical reactions and exothermic reactions, it is confusing when directly apply it to catalytic reactions. A revised definition: "the initial phase of a catalytic chemical reaction which accelerates" would suit catalytic reactions better.
Scheme 5
图式 5.
催化反应中的催化剂前体活化过程(诱导期)和稳态催化循环
Scheme 5.
Pre-catalyst activation stage (induction period) and steady state catalytic cycle of a catalytic reaction
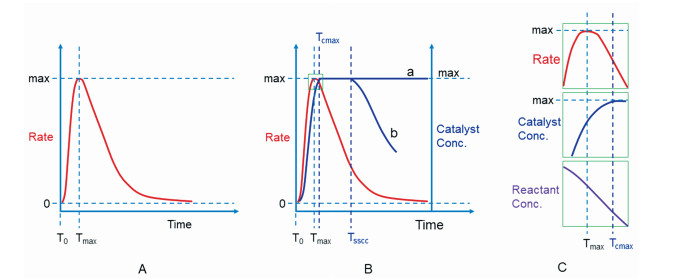
Figure 1.
Typical kinetic features of catalytic reactions which possess induction period. (A) General diagram of rate versus time; (B) General diagram of catalyst concentration versus time; (C) Detailed diagram around the time range from maximum rate time point (Tmax) to maximum active catalyst concentration time point (Tcmax)
We have answered when the induction period ends, while when does the steady state catalytic cycle start? Figure 1B not only shows a general rate versus time profile, but shows active catalyst concentration versus time profile. During the induction period (between T0 and Tmax), the concentration of the active catalyst increases, and it is expected to reach maximum value, which will be the steady state concentration of the catalyst, hence the steady state catalytic cycle starts. However, as shown in Fig. 1C, the maximum active catalyst concentration time point (Tcmax) is not the same as the maximum rate time point (Tmax). Tcmax actually comes shortly after the Tmax because when the active catalyst concentration increases and approaches the maximum value, the concentration of the reactants decreases. Whenever the decreasing effect of the reactant concentration decrease on the reaction rate overrides the increasing effect of the active catalyst concentration increase, the Tmax arrives. Therefore, strictly speaking the steady state catalytic cycle starts from Tcmax. Since these two time points (Tmax and Tcmax) should be very close to each other and it is usually very difficult to determine when the concentration of the catalytically active but unstable species reaches maximum. In contrast, it is much easier to determine the maximum reaction rate through modern in situ monitoring techniques, and it is reasonable to take Tmax as the start point of the steady state catalytic cycle. Once it starts, the steady state catalyst concentration will remain until the end of the reaction (pathway a in Fig. 1B, if there is no catalyst deactivation) or a certain time point Tsscc when the catalyst deactivation process proceeds (pathway b in Fig. 1B). The length of the steady state catalytic cycle (between Tmax and Tsscc) varies on the types of the reactions and reactions conditions. It would be helpful to keep these time points, which separate the whole reaction progress into different stages, in mind when conduct kinetic and mechanistic studies on a catalytic reaction. It is noteworthy that the catalytic reaction shown in Scheme 5 stage 2 not only takes place during steady state catalytic cycle, but also accompanies the pre-catalyst activation process during the induction period (Scheme 5, stage 1), because once the active catalyst generates it will start to catalyze the reaction. Ignoring the induction period could possibly induce incorrect conclusions when study the orders of the reactants and catalyst in a rate equation, especially with the method of initial rates.
2.
Dormant Period-a Special Phase in Catalytic Reactions
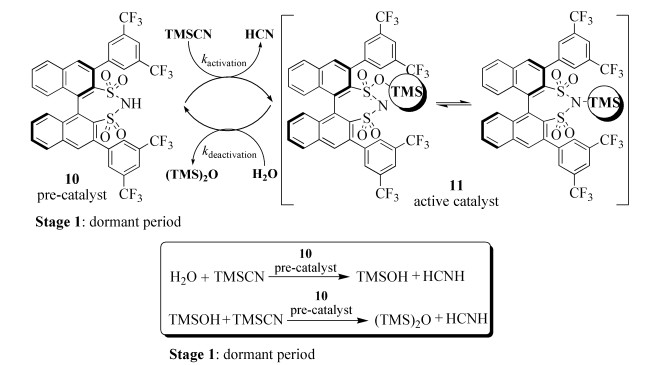
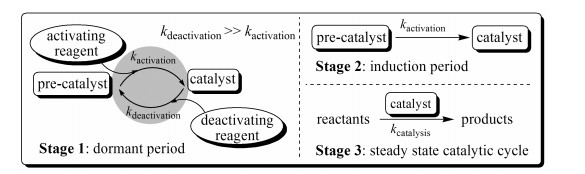
In 2016, List and coworkers reported chiral Lewis acid catalyzed asymmetric cyanosilylation of aldehydes[12]. An interesting phenomenon was obse-rved during their study: absolutely no product was detected up to a few hours in the early stage of the reaction while the reaction suddenly started at a particular time point and proceeded rapidly. Detailed mechanistic study using in situ FT-IR analysis revealed that an unusual competing catalyst deacti-vation and activation process existed in the pre-catalytic cycle. To distinguish this special phase, in which the reaction rate is zero, from the frequently observed traditional induction period, the "dormant period" was used to describe it. As shown in Scheme 6, Brønsted acid 10 is the pre-catalyst and catalyti-cally inactive for the cyanosilylation reaction. Trime-thylsilyl cyanide (TMSCN) reacts with 10 slowly to generate the active catalyst 11 which is immediately quenched by water or trimethylsilanol (TMSOH). This process takes up to a few hours, indicating that the activation rate is very slow, and the deactivation rate constant is much bigger than the activation rate constant so that the deactivation rate can completely surpass the activation rate (ratedeactivation>rateactivation) during such a long dormant period. Although pre-catalyst 10 is catalytically inactive for the cyanosilylation reaction, it is a catalyst for another two reactions: the hydrolysis of TMSCN to trimethylsilanol and the reaction of trimethylsilanol with TMSCN which produces (TMS)2O and HCN.
Scheme 6
图式 6.
手性路易斯酸催化的醛的不对称硅氰化反应的前催化循环(休眠期)
Scheme 6.
Pre-catalytic cycle (dormant period) of chiral Lewis acid catalyzed asymmetric cyanosilylation of aldehydes
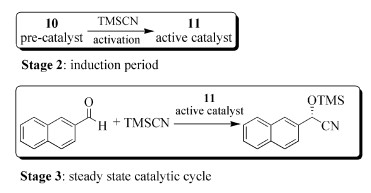
Once the water and trimethylsilanol in the reaction mixture are completely consumed, the reaction enters the traditional induction period (Scheme 7, stage 2) during which the reaction rate of the desired reaction increases from zero to maximum. After the induction period, the reaction enters the steady state catalytic cycle (Scheme 7, stage 3). In addition, the authors could even create a dormant period in the progress of the catalytic cycle by injecting catalytic amount of water or trimethylsilanol into the reaction mixture.
Scheme 7
图式 7.
手性路易斯酸催化醛的不对称硅氰化反应的诱导期和稳态催化循环
Scheme 7.
Induction period and steady state catalytic cycle of chiral Lewis acid catalyzed asymmetric cyanosilylation of aldehydes
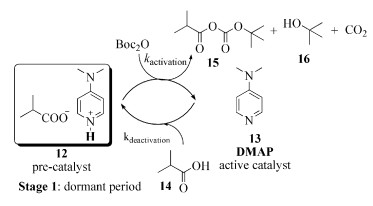
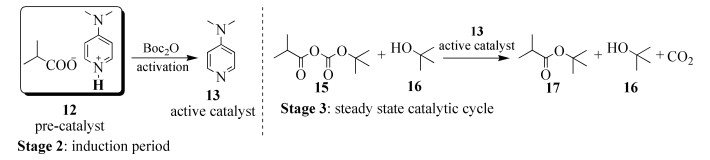
Although the phenomenon of existing a dormant period is very unusual, it is not the only example, as similar dormant periods also have been found in few other catalytic reactions. For example, in 2008, Zipse and coworkers reported a protocol for rapid synthesis of sterically hindered carboxylic acid esters at room temperature[13]. A dormant period (about 20 minutes) during which no ester product was formed, was observed when they conducted the kinetic study of DMAP-catalyzed reaction of isobutyric acid with tert-butanol in the presence of Boc2O using 1H NMR spectroscopy analysis. As shown in Scheme 8 and 9, DMAP is the active catalyst while substrate isobutyric acid 14 is acidic enough to protonate all the catalytic amount of DMAP once the reaction is set up, gener-ating carboxylic salt 12 which can be considered as a pre-catalyst. The reaction of 12 with Boc2O produces anhydride 15 as the real reactant of the esterification (Scheme 9, stage 3), while activating the pre-catalyst 12 to generate the active catalyst DMAP. As long as there are some isobutyric acids 14 left, the active catalyst DMAP will be protonated and deactivated immediately. After most of the isobutyric acid 14 is converted to anhydride 15, the sleeping catalyst wakes up (Scheme 9, stage 2) and starts to catalyze the reac-tion of 15 and 16 producing 17 (Scheme 9, stage 3).
Scheme 8
图式 8.
Boc2O存在下DMAP催化的异丁酸与叔丁醇反应的前催化循环(休眠期)
Scheme 8.
Pre-catalytic cycle (dormant period) of DMAP- catalyzed reaction of isobutyric acid with tert-butanol in the presence of Boc2O
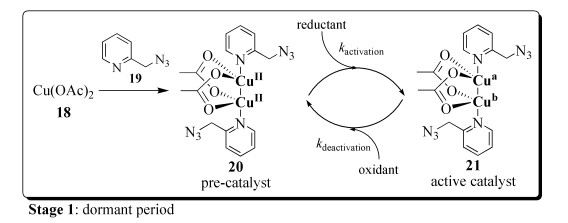
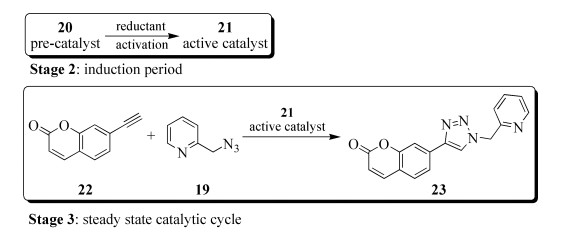
Another example is the copper(Ⅱ) acetate catalyzed chelating azide alkyne cycloaddition reported by Zhu and coworkers[14]. In 2011, they reported their detailed mechanistic investigation on this reaction and during their study clear dormant periods up to a few hours were found under certain reaction conditions[15], although they were mistaken for induction periods. As shown in Scheme 10, copper(Ⅱ) acetate reacts with azide 19 forming a dinuclear Cu(Ⅱ) species 20 which is catalytically inactive for the cycloaddition. Dinuclear copper pre-catalyst 20 could be reduced by reductants (methanol if methanol is used as solvent, or alkyne if acetonitrile is used as solvent via alkyne oxidative homocoupling) to the active dinuclear copper catalyst 21 in which the valency of one copper is +1 and the other is +2 as proposed by the authors. Possibly the active catalyst 21 could be easily oxidized to pre-catalyst 20 by oxidants such as oxygen in the reaction mixture. As long as there are some oxidants which could deactivate 21 left, the cycloaddition will not start and the reaction stays in dormant period. The length of the dormant period depends on the types of the reductants, the oxidants, the concentrations of the species involved in the pre-catalytic cycle, and the reduction and oxidation rate constants.
Once the oxidants in the reaction mixture are completely consumed, the reaction enters the indu-ction period which is much shorter than the dormant periods in this case, and the reaction rate increases from zero to maximum. Then the steady state catalytic cycle of the cycloaddition of azide 19 and alkyne 22 starts (Scheme 11, stage 3).
From these three examples we can see that dormant period is a very special phase in catalytic reactions and it is very different from the traditional induction period. Unfortunately, such an interesting period, which is related to the detailed mechanism of the catalytic reaction especially the catalytically active species and catalyst activation/deactivation process, in the past has been either ignored or mistaken for the induction period. As aforementioned, any catalytic reaction beginning with a pre-catalyst rather than a real active catalyst should possess an induction period (Scheme 5) during which the reaction rate increases from zero to maximum. Although the length of the induction period varies on the reactions, it does exist, no matter it is detectable or not. In contrast, dormant period isn't as common as the induction period. To form a dormant period (as shown in Scheme 12, stage 1), a catalytic reaction should meet the following requirements: 1, the reaction begins with a pre-catalyst, which is catalytically inactive for catalyzing the desired reaction, rather than a real active catalyst; 2, besides the catalyst activation process, there is a catalyst deactivation process (the forming catalytically active species can be quenched quickly by some reagents in the reaction mixture, such as water and oxygen); 3, the deactivation rate constant (kdeactivation) is much bigger than the activation rate constant (kactivation), so that the deactivation rate can surpass the activation rate completely (ratedeactivation > rateactivation) during a detectable period (usually much longer than the induction period).
Scheme 11
图式 11.
Cu(OAc)2催化的螯合叠氮与炔环加成反应的诱导期和稳态催化循环
Scheme 11.
Induction period and steady state catalytic cycle of Cu(OAc)2 catalyzed chelating azide alkyne cycloaddition
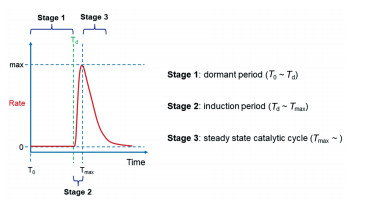
The typical kinetic feature of dormant period is that the rate of the desired reaction is zero and no product can be detected during this period (Fig. 2, stage 1, from T0 to Td). However, this doesn't mean that nothing happens in this period. Some other reactions which consume the activating reagents and deactivating reagents are ongoing. Once there are not enough deactivating reagents left in the reaction mixture to quench the newly generated active species, the reaction enters the induction period (Scheme 12 and Fig. 2, Stage 2, from Td to Tmax) and the reaction rate starts to increase. Shortly after the rate reaches maximum, the steady state catalytic cycle starts (Scheme 12 and Fig. 2, Stage 3). Based on these examples and analyses, we suggest a definition for dormant period: "a special phase of a catalytic chemical reaction during which the reaction rate is zero and after which the reaction starts spontaneously".
Figure 2
图 2.
具有休眠期和诱导期的催化反应的反应速率对时间曲线代表性特征示意图
Figure 2.
Typical rate versus time diagram of catalytic reactions which possess both dormant period and induction period
We have shown the typical kinetic features of catalytic reactions which possess an induction period and analyzed the widely recognized end point of the induction period in catalytic reactions. More importantly, we introduced the dormant period which is a special phase in catalytic reactions through a few examples and discussed its origin and typical features. The differences between dormant period and induction period have been clearly demonstrated. In addition, a revised definition for induction period and a definition for dormant period are suggested. We speculate that this perspective will draw attention to the time points (Td, Tmax, Tcmax and Tsscc) which separate the whole reaction progress into very different stages including dormant period, induction period and steady state catalytic cycle, and facilitate in-depth understanding of pre-catalytic cycle and detailed mechanism of catalytic organic reactions.
#中国化学会“中国青年化学家元素周期表”活动特约稿件
[1]
Richey R S. Grignard Reagents, New York:John Wiley & Sons, 2000:185~275.
[2]
Osborn J A, Wilkinson G. Inorg. Synth., 1967, 10:67~71.
Figure 1
Typical kinetic features of catalytic reactions which possess induction period. (A) General diagram of rate versus time; (B) General diagram of catalyst concentration versus time; (C) Detailed diagram around the time range from maximum rate time point (Tmax) to maximum active catalyst concentration time point (Tcmax)

 下载:
下载:

 下载:
下载:


