Table 1.
Proximate and ultimate analyses of raw materials
Citation:
LI Xiao-ming, ZHANG Hong, LIU Meng-jie, ZHI Li-fei, BAI Jin, BAI Zong-qing, LI Wen. Investigation of coal-biomass interaction during co-pyrolysis by char separation and its effect on coal char structure and gasification reactivity with CO2[J]. Journal of Fuel Chemistry and Technology,
2020, 48(8): 897-907.

采用焦分离方法研究共热解时煤与生物质的相互作用及对焦结构和CO2气化反应性的影响
摘要:
煤与生物质的相互作用已被广泛研究。但是,其相互作用机制通常是基于混合焦样的物理化学结构和反应性而提出。在这项工作中,基于不同形状和粒度将无烟煤与生物质共热解后的混合焦分离,然后通过分析分离后煤焦的结构和反应性来揭示煤与生物质相互作用机制。在热解温度为600和900℃条件下,在固定床反应器中制备了混合有不同比例的秸秆(CS)的无烟煤焦样。采用了电感耦合等离子体发射光谱法(ICP-OES)和X射线衍射(XRD)对煤焦的AAEM浓度和微晶结构进行了检测。利用TGA设备分析了分离后的煤焦与CO2的气化反应性。结果表明,随着掺混比例从0增加到80%,煤焦中活性K和Mg的浓度逐渐增加,并形成更为无序的碳结构。共热解过程中,更多的AAEM种类被混合物中的煤焦通过挥发分-焦相互作用捕获,而不是随生物质挥发分逸出。同时,热解温度的升高引起了K和Na挥发和失活,也导致石墨化度的降低。而且,CS的添加和更低的热解温度均可提高煤焦的气化反应性。此外,在煤焦的碱性指数AI与反应性指数R0.5之间建立了较好的线性关系(R2=0.9009),表明在煤与生物质共气化过程中,AAEMs对提高煤焦气化反应活性起主导作用。
-
关键词:
- 煤与生物质的相互作用
- / 焦分离
- / 共热解
- / 气化反应性
- / 碱性指数
English
Investigation of coal-biomass interaction during co-pyrolysis by char separation and its effect on coal char structure and gasification reactivity with CO2
Abstract:
The interaction between coal and biomass has been widely investigated. However, the mechanism is always proposed based on physicochemical structure and reactivity of char mixture. In this work, char mixture after co-pyrolysis of anthracite and biomass was separated based on different shape and size, and then structure and reactivity of the coal char were analyzed to reveal mechanism of coal-biomass interaction. Anthracite char samples with different corn straw (CS) blending ratios were prepared by pyrolysis in a fixed bed reactor at 600 and 900℃. The AAEM concentration and microcrystalline structures of coal char were examined by inductively coupled plasma-optical emission spectrometry (ICP-OES) system and X-ray diffraction (XRD). The gasification reactivity of char sample after separation was analyzed by TGA under CO2. The results show that concentration of active K and Mg in coal char samples gradually increased and more disordered carbon structure formed as the CS proportion in the blending increased from 0 to 80%. The coal char in the blending captured more AAEM species by volatile-char interactions instead of escaping with volatile from biomass during co-pyrolysis process. Meanwhile, higher pyrolysis temperature led to volatilization and inactivation of K and Na, and also decrease in graphitization degree. Moreover, both addition of CS and low pyrolysis temperature could promote gasification reactivity of coal char sample. Furthermore, a satisfactory linear correlation (R2=0.9009) between alkali index AI and R0.5 of the char samples was established. This indicated that AAEMs performed the dominate effect to enhance gasification reactivity of coal char during co-gasification of coal and biomass.
-
Key words:
- coal-biomass interaction
- / char separation
- / co-pyrolysis
- / gasification reactivity
- / alkali index
-
Biomass is the fourth largest energy source after coal, oil and natural gas and it has the characteristics of renewable, transportable, storable, low pollution and high reactivity. Utilization of biomass energy in the world has attracted great attention for low carbon footprint[1, 2]. Meanwhile, gasification is the indispensable way to achieve carbon cycle utilization of carbonaceous materials including biomass[3, 4]. However, biomass gasification is restricted due to its disadvantages of low density, low calorific value and low thermal efficiency[5, 6]. Co-gasification of biomass and coal overcomes various disadvantages in the process of biomass gasification, and also optimizes the utilization of fossil fuels[7]. What's more, abundant alkali and alkaline earth metals (AAEMs) in biomass are the potential catalyst to enhance coal gasification reactivity. In hence, it is of great practical significance to investigate co-gasification of biomass and coal.
Pyrolysis is regarded as the first step of gasification, and coal-biomass interaction during co-pyrolysis dominates the coal char structure. Coal char gasification is rate controlling step of co-gasification of biomass and coal due to the slower gasification rate compared to co-pyrolysis. The interaction between coal and biomass and the potential synergistic effect during gasification has been widely investigated in the last decades[8]. The dominating factors affecting char gasification reactivity are physicochemical structure and inorganic minerals with catalytic action. In co-pyrolysis process, the physicochemical properties of coal char are changed by biomass composition, and further affects gasification reactivity of coal char[9]. There are different conclusions about effect of biomass on microcrystalline structure of co-pyrolysis char. Cellulose promoted ordering of micro-scale structure and uniformity of both anthracite and bituminous char[10], and then cellulose had negative synergetic effect during the gasification process. Adversely, wheat straw might enhance coal char reactivity by inhibiting ordering and uniformity of char structure[11]. Additionally, pore structure was also influenced during co-pyrolysis due to the difference in volatile content and properties between biomass and coal. Wu et al[11] showed the addition of wheat straw promoted the increase in number of mesopores within the range of 2-7 nm from co-pyrolysis char of coal and biomass, which improved the specific surface area and led to promotion effect on co-gasification reactivity. In contrast, most scholars pointed out that char gasification reactivity was closely associated with the content of AAEM in biomass ash. Li et al[12] reported that the reactivity index of co-pyrolysis char of sawdust and bituminous coal reached maximum when the mass ratio of sawdust was 80%, demonstrating that the increasing mass ratios of biomass could promote content of AAEM and specific surface area of co-pyrolysis chars. Zhu et al[13] mixed coal samples with raw and acid washed wheat straw, and then co-pyrolysis and co-gasification characteristics of the blend were systematically examined. The results showed that the gasification reactivity could be associated with catalysis of AAEM from biomass.
Much attention has been paid on physicochemical structure and the subsequent gasification characteristics of co-pyrolysis char samples, and then the interaction mechanism between coal and additives was proposed. However, the coal char sample has not been separated from the mixed sample, which would confuse one with these conclusions. To make an in-depth and intuitive understanding of effect of biomass additive on coal char structure and gasification behavior during co-gasification, it is imperative to study the separated coal char sample.
Notably, effect of volatile-char interactions on char structure and AAEMs in char during co-pyrolysis of biomass and coal has been widely studied. The H radicals formed from thermal cracking and reforming of volatiles are easily released by the volatile-char interactions. Meanwhile, these radicals could penetrate deeply into the char matrix, thus condensation reaction of aromatic rings is enhanced, leading to those small aromatic rings converted into large ones[14]. Besides, the volatiles are passed through the fine char under the top frit during co-pyrolysis, leading to the AAEM species are deposited on external surface of the char[15]. Also, the literature[15] reported that there was a competition between escaping of volatiles from the carbon matrix and deposition of volatiles in the pore structure surface. The influence of volatile-char interactions on the separated coal char sample was remain unclear.
In addition, pyrolysis conditions and raw material composition have a significant influence on the char structure. Liang et al[16] found that increasing pyrolysis temperature could greatly decrease graphitization degree and slightly change crystal plane spacing when the temperature was below 1000 ℃. Moreover, many researchers claimed that the synergy effect between biomass and coal might be related to the mass ratio of biomass. Yuan et al[17] carried out co-pyrolysis of bituminous coal and rice straw, and then showed that synergy effect promoting char conversion was reduced when the mass ratio of biomass was from 20% to 80%, while synergy effect promoting conversion of tar to gas was on the contrast. The reason was that the heating rate was changed by the increased mass ratio of rice straw and packing density was viewed as crucial factor on the heat transfer rate and heating rate. From scientific and engineering points of view, an in-depth knowledge of pyrolysis conditions and raw material composition could provide valuable reference for designing gasification reactors. Meanwhile, the quantitative correlation between structural parameters and reactivity of the char sample should be further explored to clarify the dominant factor affecting the co-gasification reactivity.
In this work, the char mixture after co-pyrolysis of anthracite and biomass was separated based on the different shape and size, and then structure and reactivity of the coal char were analyzed to reveal the mechanism of coal-biomass interaction. Corn straw (CS) was co-pyrolyzed with an thracite (AC) in a fixed bed reactor at 600 and 900 ℃. After pyrolysis, the biomass char and coal char were physically separated. Inductively coupled plasma-optical emission spectrometry (ICP-OES) system and X-ray diffraction (XRD) were employed to analyze AAEM concentration and microcrystalline structures of coal char samples, respectively. At the same time, thermogravimetric analyzer (TGA) was used for gasification reactivity with CO2 at 900 ℃. Moreover, relationship between physicochemical structure and reactivity of the char sample was explored.
1. Experimental materials and methods
1.1 Raw materials and preparation of coal char samples
The typical anthracite (AC) was selected from Shanxi province, and local corn straw (CS) was collected for co-gasification. Raw AC and CS samples were dried at 60 ℃ for 24 h. For the subsequent separation of coal char from co-pyrolysis char sample, AC was grounded and sieved to less than 200 mesh, while the CS was sieved to 40-60 mesh. Table 1 lists the proximate and ultimate analyses of AC and CS samples. The ash chemical compositions (%) of AC and CS ash samples are shown in Table 2. The experimental temperature of the typical anthracite (AC) ash preparation was set at 815 ℃, and the specific procedures followed Chinese National Standards of GB/T 1574—2007. The corn straw (CS) ash was performed at 550 ℃ on the basis of Chinese National Standards of GB/T 30725—2014. The heating rate of both typical anthracite (AC) and corn straw (CS) was controlled at 5 ℃/min Under air atmosphere in the muffle.
Table 1

 下载:
导出CSV
下载:
导出CSV
Sample Proximate analysis w/% Ultimate analysis wdaf/% St, d Mad Ad Vdaf FCd C H Oa N AC 0.80 25.19 14.00 64.33 89.52 4.02 4.42 1.59 0.34 CS 4.98 5.01 80.58 18.45 48.53 5.64 45.17 0.47 0.19 ad: air dried basis, d: dry-basis, daf: dry ash-free basis, a: by difference Table 2
Table 2. Chemical compositions of AC ash and CS ash下载:
导出CSV
Sample Content w/% SiO2 Al2O3 Fe2O3 CaO MgO SO3 TiO2 K2O P2O5 Na2O AC ash 49.11 29.02 12.04 3.91 0.50 2.36 1.91 0.52 0.12 0.51 CS ash 27.01 0.86 0.43 7.95 12.01 7.54 0.05 35.91 5.86 2.39 Prior to pyrolysis experiments of the mixture, CS sample was sufficiently blended with AC sample using a mechanical method. The char samples, including AC char, CS char, and the mixture chars of AC with different CS mixing ratios, were obtained from pyrolysis in a fixed bed reactor. The sample was heated from ambient temperature to target temperature (600 and 900 ℃) under high-purity nitrogen. The heating rate was 10 ℃/min. It was kept for 30 min after the temperature reached target temperature, and then cooled down by high purity nitrogen. After co-pyrolysis, the biomass char and coal char were separated physically. The coal char samples separated from that the mixed char samples were named as "CS2-AC8", "CS5-AC5", and "CS8-AC2", indicating that the mass ratio of CS in the mixed sample was 20%, 50%, and 80%, respectively.
1.2 Concentration of elements in char sample
The catalytic activity of inorganic minerals was determined by the chemical forms and concentration of different elements in char samples. The measurement was carried out on the basis of Chinese National Standards of MT/T 1014—2006. The detailed procedures were as follows: the coal char sample was heated up to a specific temperature in a muffle furnace. The corresponding ash sample was decomposed with hydrofluoric acid-perchloric acid. Then inductive-coupled plasma optical emission spectroscopy (ICP-OES) was used to determine the contents of K, Na, Ca, Mg, Al, Fe, Si, P, Ti and S. Afterward, the results were given as the form of oxides.
1.3 Microcrystalline structure analysis of the char sample
The coal char samples separated from char mixture was characterized by a PANalytical X'Pert3 Powder diffractometer. The sample was scanned at a speed of 4(°)/min with a step length of 0.02° between 10°-80°.
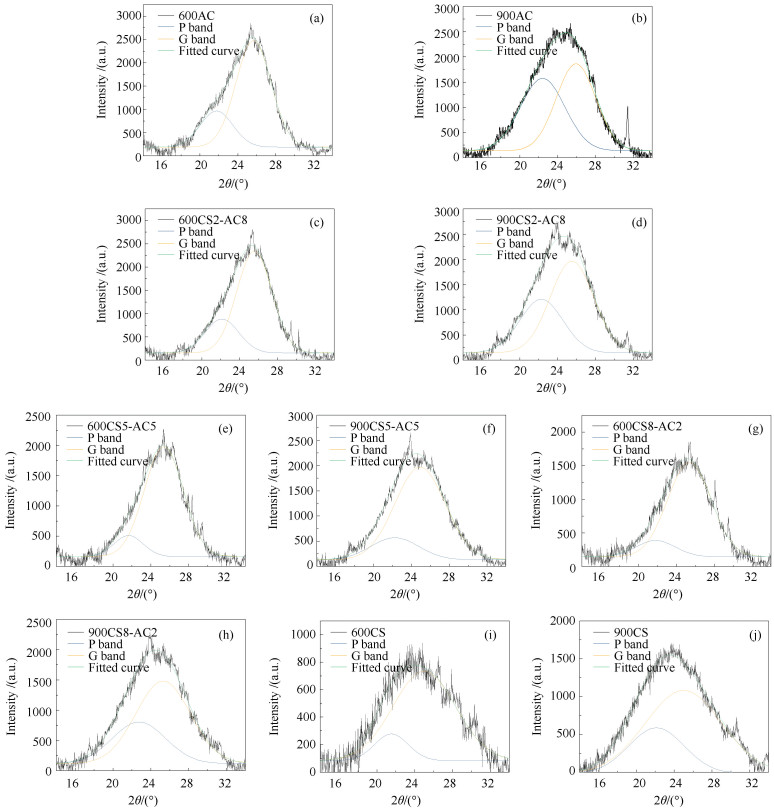
According to the references[18, 19] carbon structure has three different forms, including poor quality (broad amorphous carbon), a better setting degree (relatively broad turbostratic carbon) and graphite-like (graphitic carbon) carbon structure. In order to obtain the quantitative information about graphitization degree of the char samples, 002 peak was divided into two parts, which were relatively poorly-defined microcrystalline structure (P band) and good microcrystalline structure (G band). The curve-fitted results of peak analysis from XRD pattern of the different char samples are shown in Figure 2. The microcrystalline structure parameters of separated parts could be calculated according to the following conventional Bragg's law and Scherrer equations[20].
Figure 2
$ {d_{{\rm{002, P}}}} = \frac{\lambda }{{2\sin \left( {{\theta _{002, {\rm{P}}}}} \right)}} $
(1) $ {d_{{\rm{002, G}}}} = \frac{\lambda }{{2\sin \left( {{\theta _{002, {\rm{G}}}}} \right)}} $
(2) $ {L_{{\rm{C, P}}}} = \frac{{0.94\lambda }}{{{\beta _{002, {\rm{P}}}}\cos \left( {{\theta _{002, {\rm{P}}}}} \right)}} $
(3) $ {L_{{\rm{C, G}}}} = \frac{{0.94\lambda }}{{{\beta _{002, {\rm{G}}}}\cos \left( {{\theta _{002, {\rm{G}}}}} \right)}} $
(4) where λ is the wavelength of X-radiation, 2 θ002, P and 2 θ002, G mean the scattering angles of P and G peak respectively, d002, P and d002, G represent the corresponding interplanar spacings of the P and G peak, LC, P and LC, G are the crystallite thickness of the P and G peak, β002, P and β002, G are the full widths at half maximum of the P and G peak. The final results of the crystalline structure parameters of char samples could be calculated by following equations:
$ {d_{{\rm{002, a}}}} = {X_{\rm{P}}}{d_{{\rm{002, p}}}} + {X_{\rm{G}}}{d_{{\rm{002, G}}}} $
(5) $ {L_{{\rm{c, a}}}} = {X_{\rm{P}}}{L_{{\rm{C, P}}}} + {X_{\rm{G}}}{L_{{\rm{C, G}}}} $
(6) $ {X_{\rm{P}}} = \frac{{{S_{\rm{P}}}}}{{{S_{\rm{P}}} + {S_{\rm{G}}}}} $
(7) $ {X_{\rm{G}}} = \frac{{{S_{\rm{G}}}}}{{{S_{\rm{P}}} + {S_{\rm{G}}}}} $
(8) where d002, a and Lc, a represent the final values of interplanar spacing and the stacking heights of char samples; XP and XG is the percentages. In addition, SP and SG is the band areas of the P and G part, respectively[18].
1.4 Char gasification
The gasification reactivity of char samples after pyrolysis were performed via a SETSYS thermogravimetric analyzer (TGA). About 10 mg of the char was used in each experiment. TGA temperature was raised from room temperature to 900 ℃ at 30 ℃/min under inert atmosphere (Ar, 140 mL/min). When the temperature reached 900 ℃, Ar was cut off and CO2 was immediately injected to start isothermal gasification until the sample mass did not change. The experimental was optimized to eliminate influence of internal and external diffusion.
$ {x_{\rm{C}}} = \frac{{{m_{\rm{0}}} - {m_t}}}{{{m_{\rm{0}}} - {m_{\rm{a}}}}} \times 100\% $
(9) where xC is carbon conversion (%); m0 is initial quality of char sample (mg); mt is the char quality at time t (mg) and ma is mass of the char at the end of reaction (mg)[21].
The gasification activity index (R0.5) of the char sample is defined as follows:
$ {R_{{\rm{0}}{\rm{.5}}}} = \frac{{0.5}}{{{\tau _{{\rm{0}}{\rm{.5}}}}}} $
(10) where τ0.5 refers to the required time when the carbon conversion reaches 50%.
The carbon conversion rate (xC) was differentiated with the corresponding gasification reaction time (t), and the gasification rate (dXc/dt) was obtained.
$ r = -\frac{1}{{{m_0} - {m_{{\rm{ash}}}}}}\frac{{{\rm{d}}m}}{{{\rm{d}}t}} = \frac{{{\rm{d}}Xc}}{{{\rm{d}}t}} $
(11) 2. Results and discussion
2.1 Effect of biomass on physicochemical structure of the coal char samples during co-pyrolysis
2.1.1 Evolution of active AAEM concentration in char samples
The active AAEM concentration of char samples with various CS mixing ratio at different pyrolysis temperatures are shown in Table 3. Water-soluble and ion-exchanged AAEMs are considered as active AAEMs due to their favorable catalytic effects on coal pyrolysis and gasification. Water-soluble AAEMs mainly contain KCl, K2CO3, CaCl2, etc., while ion-exchanged ones chiefly consist of AAEMs with oxygen-containing functional groups, such as COOK, COK, (COO)2Ca, etc.[22-24]. As literature reported, active AAEM concentration was abundant in biomass sample[13]. It was obviously observed that the active AAEM concentration (especially K and Mg) of the separated coal char samples increased with the CS addition, which could be attributed to the active mineral transformation during co-pyrolysis. Meanwhile, effect of biomass addition on the active AAEM content of coal char was closely associated with the blending ratio of biomass. With the increase of the CS blending ratio, active K and Mg concentration of coal char samples gradually increased. It could be inferred that K and Mg were easily released from biomass during co-pyrolysis, and then usually deposited within the coal char matrix. Taken the volatile-char interactions on char structure into consideration, deposition of AAEM species in the coal char structure was more than its escaping from the carbon matrix during co-pyrolysis process.
Table 3
Table 3. AAEM concentration in different char samples下载:
导出CSV
Sample Content w/% SiO2 Al2O3 Fe2O3 CaO MgO TiO2 SO3 K2O Na2O P2O5 600AC 50.42 31.19 9.05 3.52 0.43 2.03 2.29 0.46 0.45 0.16 600CS2-AC8 56.62 27.41 3.69 3.59 0.94 1.24 2.21 3.2 0.81 0.29 600CS5-AC5 54.65 25.46 3.66 3.52 1.06 1.14 2.37 7.00 0.82 0.32 600CS8-AC2 54.41 20.92 3.62 3.70 1.78 0.85 2.32 10.93 0.96 0.51 600CS 18.07 0.74 0.64 10.17 15.14 0.03 7.02 39.73 4.59 3.87 900AC 51.67 32.76 8.17 3.04 0.66 2.15 0.49 0.43 0.45 0.18 900CS2-AC8 56.63 28.42 3.96 3.47 1.13 1.28 0.66 3.41 0.74 0.3 900CS5-AC5 54.42 26.38 3.45 3.64 1.66 1.19 1.42 6.88 0.6 0.36 900CS8-AC2 52.45 21.98 2.94 4.16 2.89 0.96 2.5 10.9 0.58 0.64 900CS 26.1 0.81 0.56 10.78 15.62 0.04 4.78 34.08 3.16 4.07 In addition, pyrolysis temperature had a slightly negative influence on K and Na contents of the char samples. In contrast, Ca and Mg contents slightly increased with the rise of temperature. It may be attributed to the slight inactivation and volatilization of active AAEM content at higher pyrolysis temperature. Also, volatilization of K and Na through volatile-char interaction was more remarkable compared with Ca and Mg.
2.1.2 Evolution of microcrystalline structure of char samples
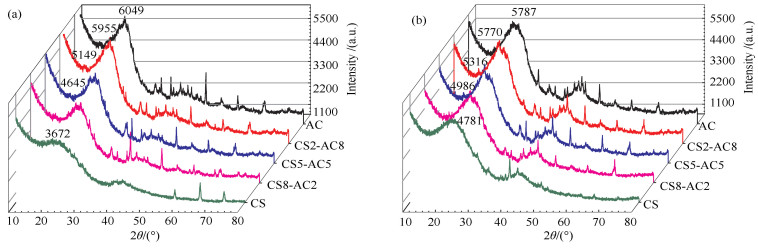
As shown in Figure 1, two obvious peaks at 2 θ angle range of 14°-37.5° and 38°-50° existed in XRD patterns of char samples, which corresponded to diffraction planes (002) and (100), respectively. With the increase of CS proportion, the 002 peak intensity of coal char samples at 600 ℃ decreased from 6049 to 3672, while that at 900 ℃ reduced from 5787 to 4781. Besides, the shape of 002 peak gradually became asymmetrical and broad. It could be rationally inferred that addition of CS could hinder the order degree of AC char, and inhibition effect on the graphitization process was gradually promoted with increasing CS proportion. Also, pyrolysis temperature played a significant role in the variations of the microcrystalline structure of the co-pyrolysis char samples.
Figure 1
 Figure 1. XRD patterns of different char samples at a pyrolysis temperature of (a) 600 ℃ and (b) 900 ℃
To quantitatively determine graphitization degree of the char samples, the 002 peak was well curve-fitted in Figure 2, which could provide reliable structure parameters. The microcrystalline structure parameters of the char samples are listed in Table 4. At a pyrolysis temperature of 600 ℃, Lc, a of coal char decreased from 1.974 to 1.215 nm with increasing CS proportion, and N value reduced from 5.453 to 3.338. Similarly, Lc, a of coal char samples at 900 ℃ decreased from 1.633 to 0.989 nm, and N value reduced from 4.425 to 2.680. It could be concluded that the stacking heights Lc, a and the stacking layer number N of coal char samples at the same pyrolysis temperature gradually decreased with increasing CS proportion, while the interplanar spacing d002, a showed negligible changes. Also, at the same mixing ratio, the Lc, a and N of coal char samples significantly decreased with the increase of pyrolysis temperature, indicating that a more disordered structure in the char samples formed with the treatment of higher temperature. Combined the qualitative and quantitative results, it was conspicuous that the additive CS promoted the disorder of coal char, and then reduced the degree of graphitization. Meanwhile, the inhibition effect on the graphitization process was enhanced at a higher pyrolysis temperature. Liang et al[16] obtained the similar conclusions that the band area ratios ID/IG increased with increasing pyrolysis temperature from 300 to 900 ℃, indicating that pyrolysis temperature had a negative influence on the graphitization process below 900 ℃. These phenomena could be attributed to inhibition effect of AAEM species on the graphitization process and volatile-char interaction. As mentioned above, the deposited AAEM species on the char matrix might be fixed on adjacent basic structural units, resulting in destruction of parallelism of the layers. Accordingly, the literature supported that the AAEM species could obviously hinder graphitization process of coal sample at a relatively low temperature[25, 26]. Although the volatile-char interaction could enhance condensation reaction of aromatic rings[14], the inhibition effect of AAEM species on the graphitization process played a decisive role in the microcrystalline structure of coal char instead of the promotion effect of volatile-char interaction. Therefore, the more disordered structure formed with increasing CS proportion.
Table 4
Table 4. Microcrystalline parameters of studied char samples下载:
导出CSV
Sample d002, P/nm LC, P/nm d002, G/nm LC, G/nm XP XG d002, a/nm Lc, a/nm N(Lc, a/ d002, a) 600AC 0.408 2.063 0.347 1.945 24.09 75.91 0.362 1.974 5.453 600CS2-AC8 0.402 2.014 0.348 1.939 24.25 75.75 0.361 1.957 5.421 600CS5-AC5 0.411 2.308 0.351 1.747 12.64 87.36 0.358 1.818 5.078 600CS8-AC2 0.408 1.725 0.351 1.561 13.53 86.47 0.359 1.583 4.409 600CS 0.413 2.020 0.356 1.087 13.77 86.23 0.364 1.215 3.338 900AC 0.397 1.528 0.343 1.732 48.40 51.60 0.369 1.633 4.425 900CS2-AC8 0.399 1.574 0.349 1.562 36.58 63.42 0.367 1.567 4.270 900CS5-AC5 0.400 1.417 0.357 1.351 18.48 81.52 0.365 1.363 3.734 900CS8-AC2 0.391 1.273 0.352 1.253 33.05 66.95 0.365 1.259 3.449 900CS 0.402 1.231 0.356 0.892 28.55 71.45 0.369 0.989 2.680 The decreasing extent of graphitization degree was controlled by the pyrolysis temperature, which could be resulted from two aspects. During pyrolysis the macromolecular network structure of coal sample will undergo polycondensation, and then form condensed aromatic structural units. Meanwhile, the chemical bonds in the macromolecular compounds break to form small molecular compounds. Accordingly, some small compounds are deposited on the surface of char sample, forming a large number of defects and amorphous structures. On the other hand, coal char sample is still in carbonization stage at low pyrolysis temperature, and the graphitization process has not yet begun[16].
2.2 Effect of biomass on the gasification characteristic
2.2.1 Effect of biomass blending ratio
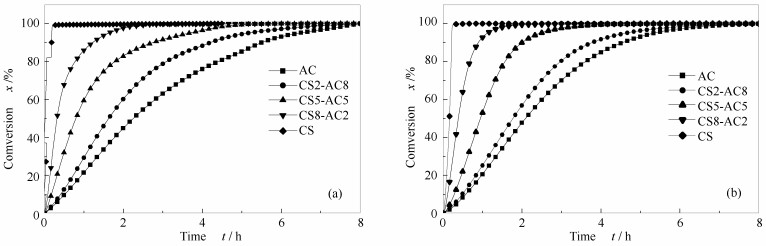
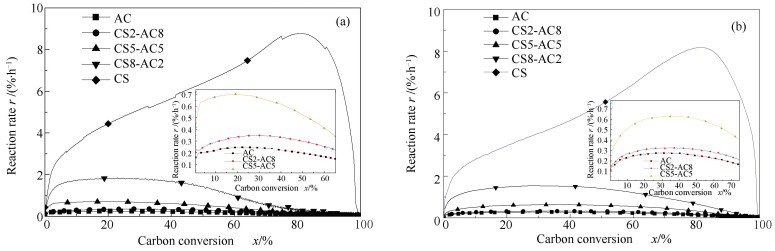
The gasification characteristic curves of different char samples are shown in Figure 3 and Figure 4. As illustrated in Figure 3, carbon conversion and reaction time curves showed that the gasification reactivity was significantly influenced by the different CS blending ratios. It could be obviously observed that the reaction time for char samples prepared at 600 ℃ to reach the same carbon conversion gradually reduced with the increase of CS proportion. Given the whole gasification process, the gasification reactivity in the sequence of CS > CS8-AC2 > CS5-AC5 > CS2-AC8 > AC char was obvious. The sequence of gasification reactivity for different char samples prepared at 900 ℃ was consistent with that of 600 ℃. The results demonstrated that the CS additive was beneficial for improving gasification reactivity of the coal char samples prepared at different pyrolysis temperatures. In addition, the carbon conversion and reaction rate curves of coal char samples in Figure 4 showed that the reaction rate increased first and then decreased, indicating that the reaction rate varied with carbon conversion. The evolution of char structure could be responsible for the dynamic reaction rate during the whole gasification process. Therefore, an acceptable indicator should be proposed to quantitatively reflect the overall gasification reactivity.
Figure 3
 Figure 3. Carbon conversion versus reaction time of char samples at a pyrolysis temperature of (a) 600 ℃ and (b) 900 ℃
Figure 4
 Figure 4. Carbon conversion and reaction rate of char samples at a pyrolysis temperature of (a) 600 ℃ and (b) 900 ℃
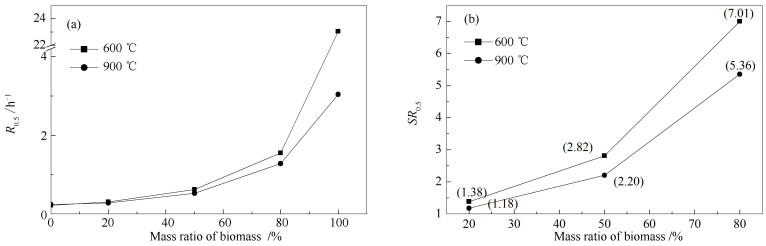
Reactivity index R0.5 has been widely used for evaluating gasification characteristics. As shown in Figure 5(a), R0.5 values of coal char samples prepared at 600 ℃ increased from 0.2215 to 1.5517 h-1, while the one at 900 ℃ increased from 0.2389 to 1.2802 h-1 with CS proportion increased from 0 to 80%. Moreover, the specific reactivity index SR0.5 should be proposed to quantitively evaluate influence of CS additive on the gasification reactivity during co-pyrolysis in this work. The definition of SR0.5 is described as follows[27]:
Figure 5
 Figure 5. (a) Gasification reactivity index and (b) specific reactivity of char samples
$ S{R_{0.5}} = \frac{{{R_{{\rm{0}}{\rm{.5, char{\kern 1pt} {\kern 1pt}sample{\kern 1pt} {\kern 1pt}with{\kern 1pt} {\kern 1pt}CS{\kern 1pt} {\kern 1pt}additive}}}}}}{{{R_{{\rm{0}}{\rm{.5, char{\kern 1pt} {\kern 1pt}sample{\kern 1pt} {\kern 1pt}without{\kern 1pt} {\kern 1pt}CS{\kern 1pt} {\kern 1pt}additive}}}}}} $
(12) SR0.5 values of coal char samples at different mass ratios and pyrolysis temperature are presented in Figure 5(b). As the mass ratio of biomass increased from 20% to 80%, SR0.5 values of coal char prepared at 600 ℃ monotonously increased from 1.38 to 7.01, and the one at 900 ℃ was from 1.18 to 5.36. It has been generally accepted that a higher SR0.5 represented a more significant promotion effect of CS additive on gasification reactivity of coal char sample. Therefore, larger biomass blending ratio could enhance the promotion effect.
2.2.2 Effect of pyrolysis temperature
As shown in Figure 5(a), it was worth noticing that gasification reactivity index of coal char at the same CS proportion reduced with the rise of pyrolysis temperature, indicating that gasification reactivity of char sample was more significant at the lower pyrolysis temperature. Meanwhile, SR0.5 values distinctly decreased as the pyrolysis temperature increased from 600 to 900 ℃. Consequently, low pyrolysis temperature could improve the promotion effect of CS additive on gasification reactivity of coal char sample. Therefore, large biomass blending ratio could improve the promotion effect. Interestingly, the influence of pyrolysis temperature on gasification reactivity was more significant as blending ratios increased from 20% to 80%. Many literatures have proposed that gasification reactivity is closely related to the physicochemical structure of char. A reasonable correlation between char structure and gasification reactivity should be explored to elucidate the phenomenon described above.
2.3 Correlation between char gasification reactivity and structural parameters
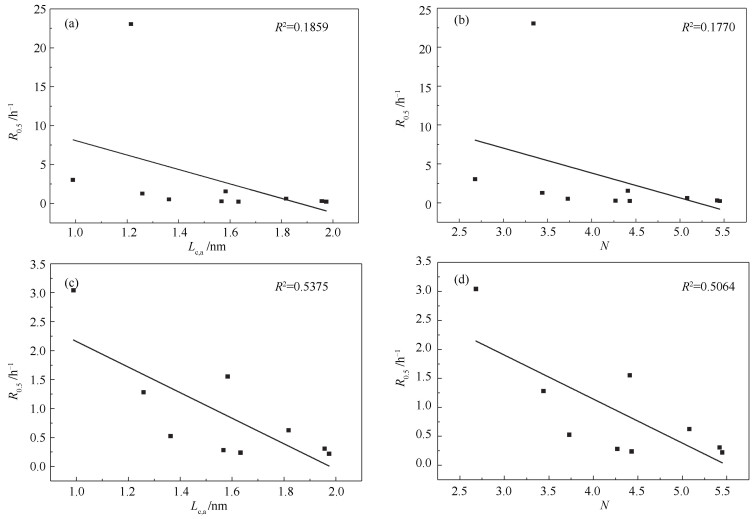
The critical factors on gasification reactivity of the char sample have been widely studied, including volatile content, content and composition of ash, specific surface area and microstructure[28-30]. Many researchers pointed out that gasification reactivity of char was inversely proportional to the graphitization degree[31-33]. However, at the same CS proportion, the stacking heights Lc, a and the stacking layer number N of coal char samples prepared at 600 ℃ were larger than that of 900 ℃, while R0.5 values of the coal char samples at 600 ℃ were higher than that of 900 ℃. Also, it could be observed in Figure 6 that there was no good relationship between the microcrystalline structural parameters and the reactivity index. Although an outlier was removed, the linear correlation coefficient between Lc, a and R0.5 was only 0.5375 in Figure 6(c). That is to say, microcrystalline structure cannot be the crucial factor for gasification reactivity in this work.
Figure 6
 Figure 6. Correlation between R0.5 and microcrystalline parameters of char samples
(a): R0.5 and Lc, a of all char samples; (b): R0.5 and N of all char samples; (c): R0.5 and Lc, a of chars where the abnormal sample was removed; (d): R0.5 and N of chars where the abnormal sample was removed
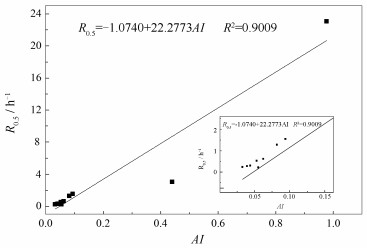
As we know, most of the volatile matter has been removed during pyrolysis, indicating that volatile content may not be the primary factor determining the gasification reactivity. Accordingly, coal char consists of carbon matrix and ash minerals, implying that influence of the ash content on gasification characteristic of coal char should be explored. Moreover, many literatures have reported that K2O, Na2O, CaO, MgO and Fe2O3 in char sample could play an important role in catalytic effect during gasification. In contrast, SiO2 and Al2O3 could play an inhibition effect on gasification reactivity of the char sample. Therefore, the concept of alkali index (AI) was proposed to quantify the catalytic activity of ash minerals[34, 35]. The calculation formula is described as follows:
$ AI = {A^{\rm{a}}} \times \frac{{{\rm{F}}{{\rm{e}}_{\rm{2}}}{{\rm{O}}_{\rm{3}}}{\rm{ + CaO + MgO + N}}{{\rm{a}}_{\rm{2}}}{\rm{O + }}{{\rm{K}}_{\rm{2}}}{\rm{O}}}}{{{\rm{Si}}{{\rm{O}}_{\rm{2}}}{\rm{ + A}}{{\rm{l}}_{\rm{2}}}{{\rm{O}}_{\rm{3}}}}} $
(13) where Aa is the ash content in coal char samples, which could be obtained from the result of TG curve.
As shown in Figure 7, a satisfactory linear correlation between alkali index AI and R0.5 was established. Results showed that AI performed better than the microcrystalline structural parameters when they were employed for predicting gasification reactivity of the char samples prepared at different CS blending ratio under various pyrolysis temperatures. It was undeniable that the microcrystalline structure also had some influence on gasification process. However, effect of AAEMs and char structure evolution on char reactivity was not quantified in this work. More efforts will be paid on the biomass-char interaction to quantify its effect on gasification.
Figure 7
3. Conclusions
In this work, coal-biomass interaction during co-pyrolysis by char separation was investigated. The deposition of AAEM species in the coal char and volatile-char interactions demonstrated coal-biomass interaction on the coal char structure during co-pyrolysis process. Meanwhile, the dominant factor on gasification reactivity of char sample was explored. The main conclusions were summarized as follows:
With the increase of CS blending ratio, concentration of active K and Mg in coal char samples gradually increased. The deposition of AAEM species in the coal char structure by volatile-char interactions was more than that escaping from biomass during co-pyrolysis process. Meanwhile, higher pyrolysis temperature led to the inactivation and volatilization of K and Na.
Inhibition effect of AAEM species on graphitization process played a decisive role in microcrystalline structure of the coal char instead of promotion effect of volatile-char interaction, resulting in formation of more disordered carbon structure in the separated coal char samples as the CS proportion increased from 0 to 80%. Also, graphitization degree of the char samples prepared at 900 ℃ was slightly lower than that of 600 ℃.
Both large CS proportion and low pyrolysis temperature could improve the promotion effect of CS additive on gasification reactivity of coal char sample. Also, influence of pyrolysis temperature on promotion effect was more significant as blending ratios increased from 20% to 80%.
An acceptable linear correlation (R2=0.9009) between alkali index AI and R0.5 of the char samples was established. AAEMs played a more significant role in evaluating the gasification reactivity compared with microcrystalline structure during char gasification with CO2.
-
-
[1]
JEONG H J, PARK S S, HWANG J. Co-gasification of coal-biomass blended char with CO2 at temperatures of 900-1100℃[J]. Fuel, 2014, 116: 465-470. doi: 10.1016/j.fuel.2013.08.015
-
[2]
YUAN S, CHEN X L, LI J, WANG F C. CO2 gasification kinetics of biomass char derived from high-temperature rapid pyrolysis[J]. Energy Fuels, 2011, 25(5): 2314-2321. doi: 10.1021/ef200051z
-
[3]
STIEGEL G J, MAXWELL R C. Gasification technologies:The path to clean, affordable energy in the 21st century[J]. Fuel Process Technol, 2001, 71(1/3): 79-97.
-
[4]
FRANCO A, DIAZ A R. The future challenges for "clean coal technologies":Joining efficiency increase and pollutant emission control[J]. Energy, 2008, 34(3): 348-354.
-
[5]
DI BLASI C. Combustion and gasification rates of lignocellulosic chars[J]. Prog Energy Combust Sci, 2009, 35(2): 121-140. doi: 10.1016/j.pecs.2008.08.001
-
[6]
DUPONT C, NOCQUET T, DA COSTA J A, VERNE-TOURNON C. Kinetic modelling of steam gasification of various woody biomass chars:Influence of inorganic elements[J]. Bioresour Technol, 2011, 102(20): 9743-9748. doi: 10.1016/j.biortech.2011.07.016
-
[7]
DING L, ZHANG Y, WANG Z, HUANG J, FANG Y. Interaction and its induced inhibiting or synergistic effects during co-gasification of coal char and biomass char[J]. Bioresour Technol, 2014, 173: 11-20. doi: 10.1016/j.biortech.2014.09.007
-
[8]
LIU L, CAO Y, LIU Q C. Kinetics studies and structure characteristics of coal char under pressurized CO2 gasification conditions[J]. Fuel, 2015, 146: 103-110. doi: 10.1016/j.fuel.2015.01.002
-
[9]
WU Z Q, YANG W C, LI Y W, YANG B L. Co-pyrolysis behavior of microalgae biomass and low-quality coal:Products distributions, char-surface morphology, and synergistic effects[J]. Bioresour Technol, 2018, 255: 238-245. doi: 10.1016/j.biortech.2018.01.141
-
[10]
WU Z Q, WANG S Z, LUO Z Y, CHEN L, MENG H Y, ZHAO J. Physico-chemical properties and gasification reactivity of co-pyrolysis char from different rank of coal blended with lignocellulosic biomass:Effects of the cellulose[J]. Bioresour Technol, 2017, 235: 256-264. doi: 10.1016/j.biortech.2017.03.121
-
[11]
WU Z Q, MA C, JIANG Z, LUO Z Y. Structure evolution and gasification characteristic analysis on co-pyrolysis char from lignocellulosic biomass and two ranks of coal:Effect of wheat straw[J]. Fuel, 2019, 239: 180-190. doi: 10.1016/j.fuel.2018.11.015
-
[12]
LI S D, CHEN X L, WANG L, LIU A B, YU G S. Co-pyrolysis behaviors of saw dust and Shenfu coal in drop tube furnace and fixed bed reactor[J]. Bioresour Technol, 2013, 148: 24-29. doi: 10.1016/j.biortech.2013.08.126
-
[13]
ZHU W K, SONG W L, LIN W G. Catalytic gasification of char from co-pyrolysis of coal and biomass[J]. Fuel Process Technol, 2008, 89(9): 890-896. doi: 10.1016/j.fuproc.2008.03.001
-
[14]
LI C Z. Importance of volatile-char interactions during the pyrolysis and gasification of low-rank fuels-A review[J]. Fuel, 2013, 112: 609-623. doi: 10.1016/j.fuel.2013.01.031
-
[15]
ASADULLAH M, ZHANG S, MIN Z, YIMSIRI P, LI C Z. Effects of biomass char structure on its gasification reactivity[J]. Bioresour Technol, 2010, 101(20): 7935-7943. doi: 10.1016/j.biortech.2010.05.048
-
[16]
LIANG D C, XIE Q, WAN C R, LI G S, CAO J Y. Evolution of structural and surface chemistry during pyrolysis of Zhundong coal in an entrained-flow bed reactor[J]. J Anal Appl Pyrolysis, 2019, 140: 331-338. doi: 10.1016/j.jaap.2019.04.010
-
[17]
YUAN S, DAI Z H, ZHOU Z J, CHEN X L, YU G S, WANG F C. Rapid co-pyrolysis of rice straw and a bituminous coal in a high-frequency furnace and gasification of the residual char[J]. Bioresour Technol, 2012, 109: 188-197. doi: 10.1016/j.biortech.2012.01.019
-
[18]
LIU M J, BAI J, KONG L X, BAI Z Q, HE C, LI W. The correlation between coal char structure and reactivity at rapid heating condition in TGA and heating stage microscope[J]. Fuel, 2020, 260: 116318. doi: 10.1016/j.fuel.2019.116318
-
[19]
WU S Y, JING G, XIAO Z, WU Y Q, CAO J S. Variation of carbon crystalline structures and CO2 gasification reactivity of Shenfu coal chars at elevated temperatures[J]. Energy Fuels, 2008, 22(1): 199-206.
-
[20]
BO F, BHATIA S K, BARRY J C. Variation of the crystalline structure of coal char during gasification[J]. Energy Fuels, 2003, 17(3): 744-754. doi: 10.1021/ef0202541
-
[21]
YAN L B, CAO Y, ZHOU H Z Y, HE B S. Investigation on biomass steam gasification in a dual fluidized bed reactor with the granular kinetic theory[J]. Bioresour Technol, 2018, 269: 384-392. doi: 10.1016/j.biortech.2018.08.099
-
[22]
WEI J T, GONG Y, GUO Q H, CHEN X L, DING L, YU G S. A mechanism investigation of synergy behaviour variations during blended char co-gasification of biomass and different rank coals[J]. Renewable Energy, 2019, 131: 597-605. doi: 10.1016/j.renene.2018.07.075
-
[23]
HUANG Y Q, YIN X L, WU C Z, WANG C W, XIE J J, ZHOU Z Q, MA L L, LI H B. Effects of metal catalysts on CO2 gasification reactivity of biomass char[J]. Biotechnol Adv, 2009, 27(5): 568-572. doi: 10.1016/j.biotechadv.2009.04.013
-
[24]
JIA S, NING S Y, YING H, SUN Y J, XU W, YIN H. High quality syngas production from catalytic gasification of woodchip char[J]. Energy Convers Manage, 2017, 151: 457-464. doi: 10.1016/j.enconman.2017.09.008
-
[25]
QI X J, XIN G, XUE L C, ZHENG C G. Effect of iron on Shenfu coal char structure and its influence on gasification reactivity[J]. J Fuel Chem Technol, 2014, 110: 401-407.
-
[26]
BAI B Y, GUO Q J, LI Y K, HU X D, MA J J. Catalytic gasification of crushed coke and changes of structural characteristics[J]. Energy Fuels, 2018, 32(3): 3356-3367. doi: 10.1021/acs.energyfuels.8b00192
-
[27]
YU J Q, GONG Y, WEI J T, DING L, SONG X D, YU G S. Promoting effect of biomass ash additives on high-temperature gasification of petroleum coke:Reactivity and kinetic analysis[J]. J Energy Inst, 2020, 52: 420-425.
-
[28]
AZARGOHAR R, NANDA S, KOZINSKI J A, DALAI A K, SUTARTO R. Effects of temperature on the physicochemical characteristics of fast pyrolysis bio-chars derived from Canadian waste biomass[J]. Fuel, 2014, 125: 90-100. doi: 10.1016/j.fuel.2014.01.083
-
[29]
WANG G W, ZHANG J L, HOU X M, SHAO J G, GENG W W. Study on CO2 gasification properties and kinetics of biomass chars and anthracite char[J]. Bioresour Technol, 2015, 177: 66-73. doi: 10.1016/j.biortech.2014.11.063
-
[30]
OCHOA J, CASSANELLO M C, BONELLI P R, CUKIERMAN A L. CO2 gasification of Argentinean coal chars:A kinetic characterization[J]. Fuel Process Technol, 2001, 74(3): 161-176.
-
[31]
LU L M, KONG C H, SAHAJWALLA V, HARRIS D. Char structural ordering during pyrolysis and combustion and its influence on char reactivity[J]. Fuel, 2002, 81(9): 1215-1225. doi: 10.1016/S0016-2361(02)00035-2
-
[32]
TAY H L, LI C Z. Changes in char reactivity and structure during the gasification of a Victorian brown coal:Comparison between gasification in O2 and CO2[J]. Fuel Process Technol, 2010, 91(8): 800-804. doi: 10.1016/j.fuproc.2009.10.016
-
[33]
LIU M J, BAI J, YU J L, KONG L X, BAI Z Q, LI H Z, HE C, GE Z F, CAO X, LI W. Correlation between char gasification characteristics at different stages and microstructure of char by combining X-ray diffraction and raman spectroscopy[J]. Energy Fuels, 2020, 34(4): 4162-4172. doi: 10.1021/acs.energyfuels.9b04445
-
[34]
LAHIJANI P, ZAINAL Z A, MOHAMED A R, MOHAMMADI M. CO2 gasification reactivity of biomass char:Catalytic influence of alkali, alkaline earth and transition metal salts[J]. Bioresour Technol, 2013, 144: 288-295. doi: 10.1016/j.biortech.2013.06.059
-
[35]
MITSUHIRO S, YOSHIHISA S, YUKIAKI H. Influence of coal characteristics on CO2 gasification[J]. Elsevier, 1982, 61(8): 717-720.
-
[1]
-
Figure 1 XRD patterns of different char samples at a pyrolysis temperature of (a) 600 ℃ and (b) 900 ℃
Figure 3 Carbon conversion versus reaction time of char samples at a pyrolysis temperature of (a) 600 ℃ and (b) 900 ℃
Figure 4 Carbon conversion and reaction rate of char samples at a pyrolysis temperature of (a) 600 ℃ and (b) 900 ℃
Figure 5 (a) Gasification reactivity index and (b) specific reactivity of char samples
Figure 6 Correlation between R0.5 and microcrystalline parameters of char samples
(a): R0.5 and Lc, a of all char samples; (b): R0.5 and N of all char samples; (c): R0.5 and Lc, a of chars where the abnormal sample was removed; (d): R0.5 and N of chars where the abnormal sample was removed
Table 1. Proximate and ultimate analyses of raw materials
Sample Proximate analysis w/% Ultimate analysis wdaf/% St, d Mad Ad Vdaf FCd C H Oa N AC 0.80 25.19 14.00 64.33 89.52 4.02 4.42 1.59 0.34 CS 4.98 5.01 80.58 18.45 48.53 5.64 45.17 0.47 0.19 ad: air dried basis, d: dry-basis, daf: dry ash-free basis, a: by difference  下载: 导出CSV
Table 2. Chemical compositions of AC ash and CS ash
Sample Content w/% SiO2 Al2O3 Fe2O3 CaO MgO SO3 TiO2 K2O P2O5 Na2O AC ash 49.11 29.02 12.04 3.91 0.50 2.36 1.91 0.52 0.12 0.51 CS ash 27.01 0.86 0.43 7.95 12.01 7.54 0.05 35.91 5.86 2.39
下载: 导出CSV
Table 3. AAEM concentration in different char samples
Sample Content w/% SiO2 Al2O3 Fe2O3 CaO MgO TiO2 SO3 K2O Na2O P2O5 600AC 50.42 31.19 9.05 3.52 0.43 2.03 2.29 0.46 0.45 0.16 600CS2-AC8 56.62 27.41 3.69 3.59 0.94 1.24 2.21 3.2 0.81 0.29 600CS5-AC5 54.65 25.46 3.66 3.52 1.06 1.14 2.37 7.00 0.82 0.32 600CS8-AC2 54.41 20.92 3.62 3.70 1.78 0.85 2.32 10.93 0.96 0.51 600CS 18.07 0.74 0.64 10.17 15.14 0.03 7.02 39.73 4.59 3.87 900AC 51.67 32.76 8.17 3.04 0.66 2.15 0.49 0.43 0.45 0.18 900CS2-AC8 56.63 28.42 3.96 3.47 1.13 1.28 0.66 3.41 0.74 0.3 900CS5-AC5 54.42 26.38 3.45 3.64 1.66 1.19 1.42 6.88 0.6 0.36 900CS8-AC2 52.45 21.98 2.94 4.16 2.89 0.96 2.5 10.9 0.58 0.64 900CS 26.1 0.81 0.56 10.78 15.62 0.04 4.78 34.08 3.16 4.07
下载: 导出CSV
Table 4. Microcrystalline parameters of studied char samples
Sample d002, P/nm LC, P/nm d002, G/nm LC, G/nm XP XG d002, a/nm Lc, a/nm N(Lc, a/ d002, a) 600AC 0.408 2.063 0.347 1.945 24.09 75.91 0.362 1.974 5.453 600CS2-AC8 0.402 2.014 0.348 1.939 24.25 75.75 0.361 1.957 5.421 600CS5-AC5 0.411 2.308 0.351 1.747 12.64 87.36 0.358 1.818 5.078 600CS8-AC2 0.408 1.725 0.351 1.561 13.53 86.47 0.359 1.583 4.409 600CS 0.413 2.020 0.356 1.087 13.77 86.23 0.364 1.215 3.338 900AC 0.397 1.528 0.343 1.732 48.40 51.60 0.369 1.633 4.425 900CS2-AC8 0.399 1.574 0.349 1.562 36.58 63.42 0.367 1.567 4.270 900CS5-AC5 0.400 1.417 0.357 1.351 18.48 81.52 0.365 1.363 3.734 900CS8-AC2 0.391 1.273 0.352 1.253 33.05 66.95 0.365 1.259 3.449 900CS 0.402 1.231 0.356 0.892 28.55 71.45 0.369 0.989 2.680
下载: 导出CSV
-


 扫一扫看文章
计量
- PDF下载量: 2
- 文章访问数: 1739
- HTML全文浏览量: 180
