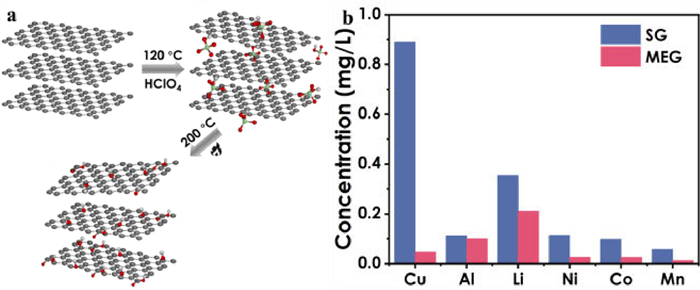
Figure 1.
(a) The synthesis route of MEG. (b) The content of impurity ions in the synthesis process.
Regeneration and reuse of anode graphite from spent lithium-ion batteries with low greenhouse gas (GHG) emissions
Junjie Liu , Hui Shi , Ke Yu , Yanni Geng , Xingyu Hu , Genping Yi , Jianzhi Zhang , Xubiao Luo

Currently, lithium-ion batteries (LIBs) are widely used in the field of new energy vehicles due to the advantages of light weight, long cycle life, high specific energy, wide operating temperature, and environmental protection [1-4]. Notably, the number of discarded LIBs will continue to increase in the future as LIBs enter the retirement period, and it will pose a major threat to human health and ecosystems if not recycled in time [5]. At present, researchers mainly focus on the recovery of valuable metals in waste LIBs [6-8], but less attention is paid to the recycling of anode materials, so the relevant recycling technologies are immature. However, some heavy metal and organic electrolytes remain in the negative electrode material. The heavy metals such as Co, Ni, and Mn will seriously pollute the soil and groundwater, the electrolyte (LiPF6) is highly corrosive and easily decomposes in contact with water and producing harmful hydrogen fluoride (HF) gas [9,10], which will cause great harm to the environment. Additionally, spent anode material is typically processed in factories by combustion, storage, or as a steelmaking additive [11-15], which resulting in serious resource waste and emits a huge number of greenhouse gases into the environment. Therefore, it is urgent to develop a low-carbon recycling method to realize the closed-loop cycle of LIBs, which will effectively solve the problems of resource exhaustion and sustainable development of power batteries.
Remarkably, graphite content is between 10% and 20% in waste LIBs [16]. With the increase of waste LIBs, the content of spent graphite (SG) continues to increase, so it is imminent to recycle graphite [17]. The most common method for recycling SG is a combination of roasting and acid leaching. For instance, Yang et al. calcined copper foil and graphite at 400 ℃ for 1 h to separate the copper foil and graphite, and then heated to 500 ℃ and calcined for 1 h to oxidize the remaining copper and make it easier to leach. Finally, the graphite is recovered through the leaching system of hydrochloric acid and hydrogen peroxide. Recycled graphite as electrode material still maintains 97% capacity after 100 cycles [18]. However, this method requires both high-temperature calcination and the addition of strong acid and additional reducing agent, resulting in a high resource consumption rate. Therefore, greener recycling methods have been further developed, such as a combination of high-temperature smelting and screening [19], or a method of grinding and flotation [20]. Further, converting SG into other functional materials can also save resources, such as adsorption materials [21,22] and graphene materials [23]. Notably, graphite from waste LIBs has a complete layered structure, and the interlayer bonding force is slightly weakened during the countless charge-discharge processes, which leads to a lower demand for oxidants in the subsequent process and reduces the complexity of the process [14]. Using the same traditional Hummers method, the amounts of concentrated H2SO4 and KMnO4 required to produce GO from SG were respectively 40% and 28.6% less than those used to prepare graphene from natural graphite, which greatly reduced production costs [24], which indicate that SG has certain advantages in the synthesis process of materials requiring oxidation and intercalation. Compared with the above methods, the oxidation of perchloric acid is stronger than that of sulfuric acid, so perchloric acid can be inserted into graphite without other strong oxidants. Furthermore, due to its relatively low boiling point, the intercalation process can be performed at lower temperatures and for shorter periods of time. Particularly, this method produces very little greenhouse gas emissions, providing experience for the development of low-carbon recycling methods.
In this study, perchloric acid was used as intercalation agent and oxidant to treat waste LIBs anode materials, the mildly expanded graphite was synthesized by one-step oxidation, and the greenhouse gas (GHG) emissions of the whole process were calculated. First, perchloric acid is used to directly oxidize the intercalated SG. The reaction can be carried out at a temperature of 120 ℃, and micro-expanded graphite can be obtained directly. Then, the residual perchloric acid in the material will be released from the graphite at a pyrolysis temperature of 200 ℃, which restored the material to its original state. The synthesized micro-expanded graphite exhibits excellent rate capability (340.32 mAh/g at a current density of 0.1 C) and cycling stability (retains 81.73% of the capacity after 100 cycles at a current density of 1 C). Compared with other graphite recovery methods, no additional chemicals are required, the reaction can be carried out at lower temperatures, and has extremely low GHG emissions.
The main raw materials used are as follows: SG from Ganfeng Lithium Industry Co., Ltd., commercial perchloric acid (72 wt%). During the synthesis process, SG and perchloric acid were added to the beaker and placed in a constant temperature oil bath for stirring at 120 ℃ for 0.5 h, while the mass ratio of added SG and perchloric acid is 1:2. The reaction is complete when the reactant becomes viscous, then washed and centrifuged the product until the pH is 4. Subsequently, dried the product in a vacuum drying oven at 100 ℃. Finally, the micro-expanded graphite (MEG) was obtained by heating the dried product up to 200 ℃ with the ramping rate of 1.5 ℃/min and the holding time of 2 h (CAUTION: HClO4 is a very dangerous acid. Safety goggles and protective clothing should be worn during the experiment to prevent the strong acid solution from corroding the skin).
X-ray diffraction (XRD) patterns were obtained using an advance diffractometer (AXIS Supra, Shimadzu, Japan). The Fourier transform infrared (FT-IR) spectrum was detected by a Fourier transform infrared spectrometer (FTIR-1500, Zhongshi Walker Technology). X-ray photoelectron spectroscopy (XPS) was measured on AXIS Supra spectrometer (Shimadzu, Japan), and the XPS spectra was corrected by the C 1s line at 284.6 eV. Elemental analysis of Cu, Al, Li, Ni, Co, and Mn in the SG powder was performed with ICP-OES (ASX-560, Thermo Scientific). Finally, the morphology of the material was observed by JEM-2100F (America FEI).
The assembly of the half-cell is as follows: First, mix the anode material, superconducting carbon black (SP) and binder polyvinylidene fluoride (PVDF) as a mass ratio of 8:1:1 with a mortar to make them fully mixed and uniform. During the grinding process, an appropriate amount of organic solvent N-methyl-2-pyrrolidone (NMP) was continuously added dropwise for film coating. Subsequently, the prepared slurry was evenly coated on the rougher side of the copper foil, placed in a vacuum drying oven for continuous drying at 110 ℃ for 8 h, and quickly transferred to a glove box. Finally, lithium foil was used as the counter electrode and the commercial electrolyte produced by Cathay Huarong Company served as the electrolyte. The working and counter electrodes were separated with Celgard2300 separator and the half cells were assembled in an argon glove drying box (the moisture was controlled below 15 ppm). The prepared half-cells were subjected to cyclic voltammetry (scanning rate was set at 0.1 mV/s under the premise of forward scanning, and the scanning voltage range was 0.01 ~ 3 V) and AC impedance (scanning frequency was set at 10–1000 kHz) test. Subsequently, its rate performance at current densities of 0.1, 0.2, 0.5, 1, and 3 C and cycling stability at current densities of 1 C was tested.
In this work, we use perchloric acid as both oxidizing and intercalating agent for oxidative intercalation of SG. The complete synthesis route can be obtained from Fig. 1a. Perchloric acid, with strong acidity and oxidizing properties, can be easily embedded in SG during the reaction process, and removing impurities in graphite effectively. In previous studies, it was confirmed that perchloric acid would emerge from waste graphite at temperatures around 200 ℃, returning the synthesized sample to a similar state to the original [25]. In addition, it can be seen from the ICP characterization results (Fig. 1b) that the main impurities contained in the recycled SG is Cu, Al, Li, Ni, Co, and Mn, the highest component is copper, which reaching 0.889 mg/L. However, all metal ions except Li were reduced to below 0.1 mg/L after perchloric acid intercalation and oxidation, and the presence of Li+ acted as a pre-lithiation effect, which could improve the initial capacity of the material to a certain extent.
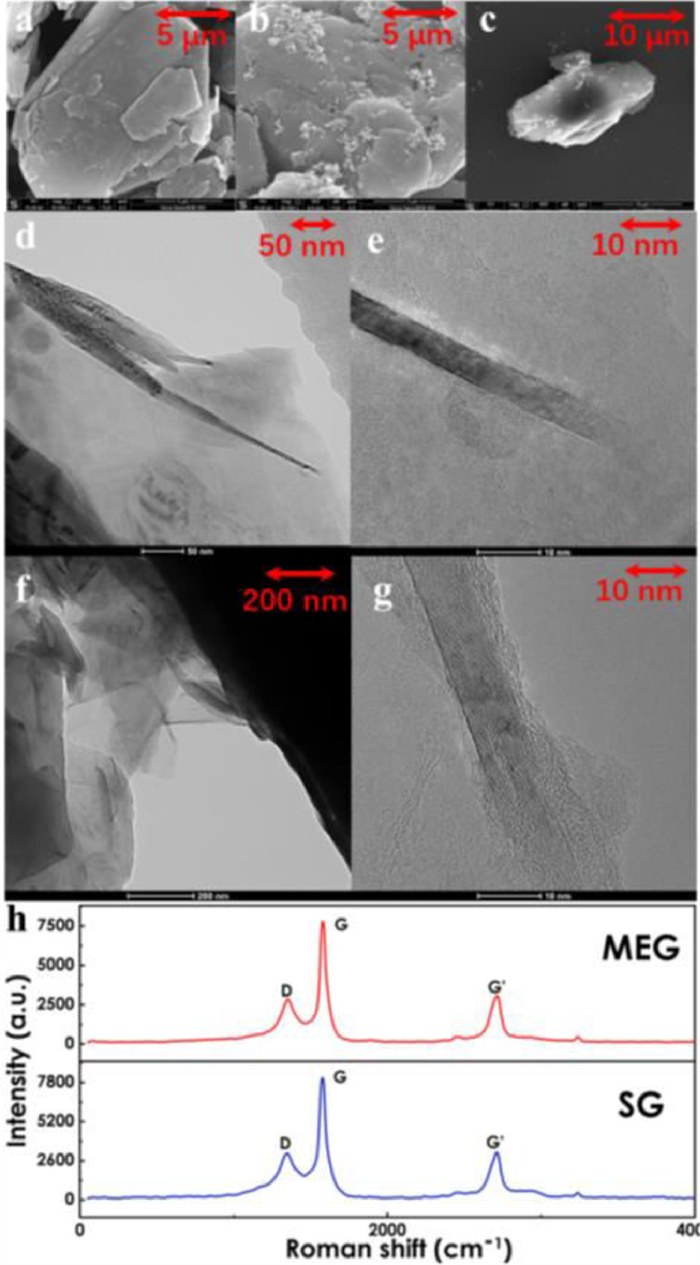
Figs. 2a-c are the SEM images of natural graphite (NG), SG and MEG. The results indicate that there is a slight expansion of graphite particles. Compared with the SEM images of SG (Figs. 2b and c), HClO4 is considered feasible as both intercalating and oxidizing agent. TEM and Roman spectra are used to further investigate the defects of the as-synthesized MEG. TEM images (Figs. 2d and e for SG, Figs. 2f and g for MEG) show that the graphene monolayer thickness of MEG is thicker than that of SG, which is due to the deformation caused by thermal expansion during MEG manufacturing. In addition, as shown in Fig. 2h, there are three bands within the displacement range of Raman spectrum, G is the main characteristic peak, provided by sp2 carbon atoms, while the D band provides evidence of an inherent defect that destroyed the π consolidation and converted the sp2 carbon atoms to sp3 carbon atoms. The defect content can generally be estimated by the intensity ratio of the D band and the G’ band [25]. As shown in Table S2 (Supporting information), the value of ID/IG increased from 1.69935 of SG to 1.82789 of MEG, indicating that MEG introduced large number of defects in the synthesis process. Obviously, graphite particles have a larger specific surface area and a rougher surface with the treatment of HClO4, which will affect the performance of the material from two aspects. First, the larger specific surface area will cover more solid-electrolyte interfacial film, resulting in greatly reduced coulombic efficiency in the first few cycles. Instead, its capacity will increase as more defects are introduced into the graphite particles, which are provided as Li-ion charge and discharge space [26].
It can be clearly seen from Fig. 3a, that the curves MEG and SG have two characteristic peaks, a sharp peak of 26.5° (002) and a small peak of 54.7° (004). After the material was synthesized, the peaks (002) and (004) remained almost at their original positions, and subsequently, HClO4 was decomposed and extracted from the SG during washing and mild expansion, returning the sample to a similar state to the original. Additionally, the impurity peaks (44.1°, 46.2°) in SG disappeared during the process, indicating that the mild expansion treatment not only retained the original layer structure of natural graphite (NG) but also could remove impurities effectively in SG. Fig. 3b shows that the perchloric acid treatment process introduced large numbers of functional groups. In addition, the nitrogen adsorption plots (Fig. 3c) and the data in Table 1 show that the BET surface area of the material ranges from 4.7 m2/g to 5.5 m2/g, and the pore size distribution (Fig. 3d) shows that the pores in SG are mainly micropores, while those in MEG are mainly large pores, and the number of pores is significantly increased compared with that in SG. It’s obvious that the surface of MEG is rougher and introduced large numbers of nanopores, which will provide additional space for Li-ion storage during charging and discharging [27,28]. This result is also consistent with the results obtained by SEM.
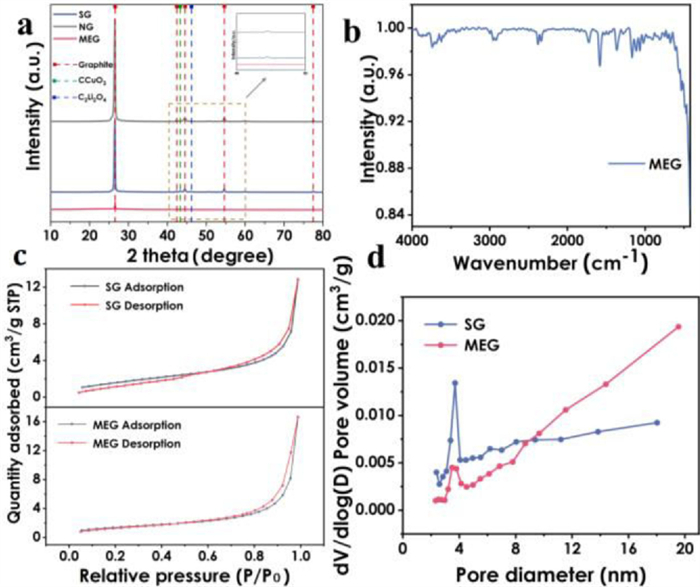
Fig. 4a presents the cyclic voltammetry (CV) curves of MEG electrodes at a scan rate of 0.1 mV/s. In the 0.01–3.0 V window, the initial CV curves of MEG were different from subsequent cycles. It can be seen, that MEG have a strong desulfurization peak around ~0.21 V, which may be related to the extraction of lithium from the graphitic layer. To verify the lithium storage properties of each electrode at high rates, EIS measurements were performed on both the new electrode and the electrode after 50 cycles at 0.1 C (Fig. 4b). EIS scatter distribution of the two materials is mainly divided into two regions: high frequency and low frequency. The scatter in the high frequency region presents a semicircle, while the low frequency presents a straight line. The semicircle in the high frequency region reflects the charge transfer internal resistance of the material. The curve presented at low frequency reflects the diffusion rate of Li+ in the material. In the fitted equivalent circuit, the semi-circle in the high frequency range is related to the laser diffusion resistance (Rs) in the electrolyte resistance and the charge transfer resistance (Rct) between the electrode and the electrolyte. The fitting data of Rs and Rct are given in Table 2. Here, the slight decrease in the impedance value of the MEG after 50 cycles may be due to the stabilization of the SEI layer, which indicates that the electrochemical reaction can proceed stably during repeated cycling without changing the electrode structure. It is well known that lithium ions undergo volume changes during charging and discharging, which are affected by internal resistance and damage the electrodes [29]. In contrast, the synthesized MEG have smaller internal resistances and thus less damage to the electrodes due to volume changes during cycling, especially at high charge/discharge current densities [30].
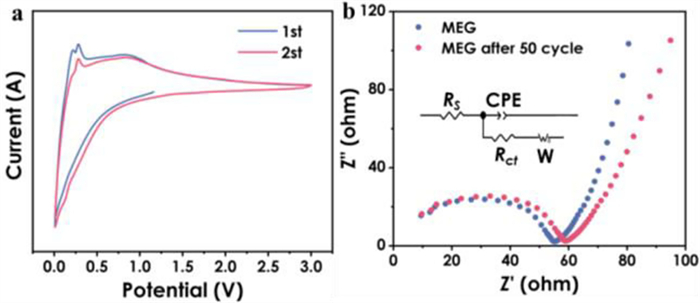
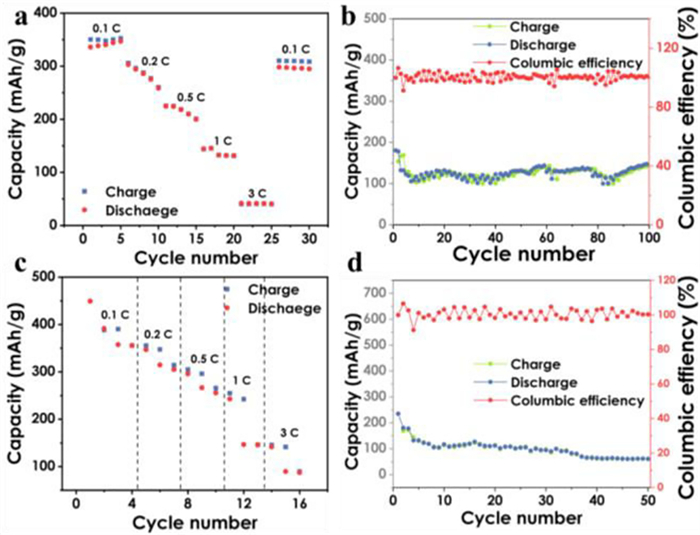
Fig. 5a shows a graph of the rate performance of MEG as an anode material. Corresponding to different charging rate of 0.1, 0.2, 0.5, 1 and 3 C, the corresponding reversible capacities of MEG anode materials are 340.32, 305.82, 225.18, 143.77 and 40.43 mAh/g, respectively. When the current density is restored from 3 C to 0.1 C, the specific capacity of MEG anode material can still recover to 310.32 mAh/g. Fig. 5b shows the capacity fading and coulombic efficiency of MEG anode material after 100 cycles at 1 C. Remarkably, the coulombic efficiency corresponding to the number of cycles is greater than 99% except the first few cycles, and it still retains 81.73% capacity after 100 cycles. The decrease in rate performance shown in the first few cycles is due to the larger specific surface area resulting in the formation of more solid electrolyte interface films at the initial stage of the reaction [26]. These results indicate that the MEG anode material has good cycling stability. However, the rate performance of SG at 0.1, 0.2, 0.5, 1, and 3 C is shown in Fig. 5c. Due to the influence of long-term charge-discharge, the electrochemical performance of SG is greatly lost, and the charge-discharge efficiency is extremely unstable. Fig. 5d also shows that the cycle stability of SG is not as good as that of synthesized MEG. After 50 cycles at 1 C, only 25.9% of the capacity is left. The SG is far from meeting the performance requirements of negative electrode materials. Therefore, the MEG prepared by perchloric acid can greatly repair the electrochemical performance of SG. The excellent electrochemical performance is mainly attributed to the inhibition of the volume expansion of the material by the amorphous carbon layer and the micro-expanded graphite layer during the charging and discharging process.
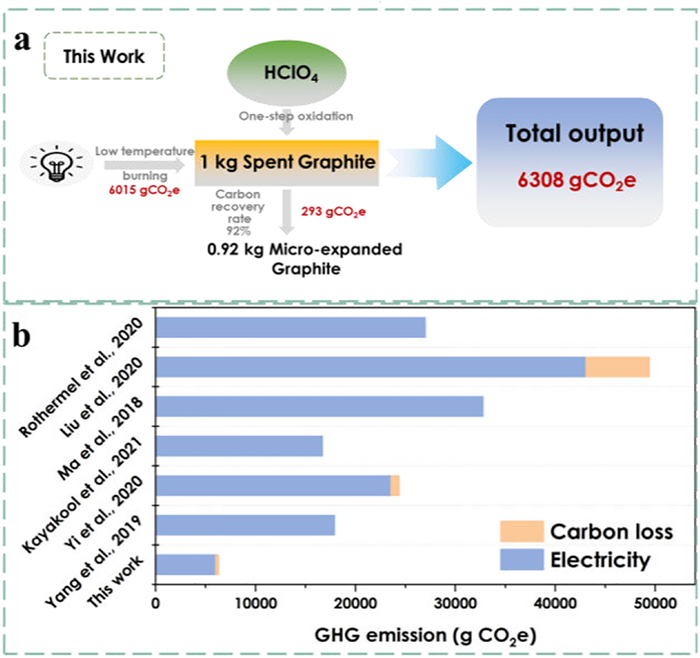
Since the 21st century, with the increase in the utilization rate of new energy electric vehicles, the number of discarded lithium batteries has continued to increase [31-33]. It is necessary to focus on the recycling process of discarded lithium batteries to achieve "carbon-free green full-component recovery". Fig. 6a shows the carbon emissions calculation data for the recycling process of this work. There is no additional carbon source input in the synthesis process, and the main energy consumed is electric energy. Here, the greenhouse gas emissions caused by the electric energy was consumed in the calculation process according to the emissions factor of the 2019 emissions reduction project in China’s regional power grid baseline, the specific calculation process listed in detail in Supporting information. The calculation results show that the GHG emissions generated by synthesizing 1 kg MEG via the method of this study is 6308 g CO2e. In Figs. S2-S7 (Supporting information), the greenhouse gas emissions from the synthesis process of the literatures on recycled graphite as battery material are calculated separately [18,19,34-37]. As Fig. 6b shows, GHG emissions is minimal in this study compared to other literature. It turns out that one-step oxidation method proposed in this article to recycle SG as a potential electrode material can effectively reduce GHG emissions.
In this work, MEG were synthesized from SG, which separated from LIBs, using perchloric acid as intercalation agent and oxidant. The results are as follows: First, the strong acidity of perchloric acid helps to remove impurity metal ions in SG, which makes countermeasures according to local conditions for the main decommissioning mechanism of SG. Then, the previous synthesis process required 28 h of reaction at 360 ℃ [38], while the highest reaction temperature of this method is only 200 ℃, and the GHG emissions of the whole synthesis process is only 6308 g CO2e, which greatly reduce the harm to the environment. Finally, the prepared MEG expresses a rate capability as high as 340.32 mAh/g at 0.1 C and still retains 81.73% of the capacity after 100 cycles at 1 C. It was shown that regenerate SG into battery-grade graphite via a low GHG emissions method is feasible. Battery scrap could be rapidly recycled through a simple process via a one-step oxidation, which provides valuable experience for the industrialization process of recycling waste graphite.
The authors declare no conflict of interest.
This study was financially supported by the National Key Research and Development Program of China (No. 2019YFC1907900), the National Natural Science Foundation of China (Nos. 52125002 and 52100043), the National Science Foundation of Jiangxi Province (No. 20202BABL213037).
M. Rinne, H. Elomaa, A. Porvali, et al., Resour. Conserv. Recy. 170 (2021) 105586. doi: 10.1016/j.resconrec.2021.105586
M. Zheng, H. Tang, Q. Hu, et al., Adv. Funct. Mater. 28 (2018) 1707500. doi: 10.1002/adfm.201707500
A. Manthiram, ACS Central Sci. 3 (2017) 1063–1069. doi: 10.1021/acscentsci.7b00288
P. Gottesfeld, Environ. Res. 178 (2019) 108677. doi: 10.1016/j.envres.2019.108677
W. Zou, J. Li, R. Wang, et al., J. Hazard. Mater. 431 (2022) 128590. doi: 10.1016/j.jhazmat.2022.128590
J. Yu, X. Wang, M. Zhou, et al., Energy Environ. Sci. 12 (2019) 2672–2677. doi: 10.1039/c9ee01478k
S. Natarajan, V. Aravindan, Adv. Energy. Mater. 8 (2018) 1802303. doi: 10.1002/aenm.201802303
P. Moazzam, Y. Boroumand, P. Rabiei, et al., Chemosphere 277 (2021) 130196. doi: 10.1016/j.chemosphere.2021.130196
X. Zeng, J. Li, Front. Environ. Sci. Eng. 8 (2014) 792–796. doi: 10.1007/s11783-014-0705-6
P. Yadav, C.J. Jie, S. Tan, et al., J. Hazard. Mater. 399 (2020) 123068. doi: 10.1016/j.jhazmat.2020.123068
D. Zhao, L. Wang, P. Yu, et al., Nano Res. 8 (2015) 2998–3010. doi: 10.1007/s12274-015-0805-z
Z. Cao, X. Zheng, H. Cao, et al., Chem. Eng. J. 337 (2018) 256–264. doi: 10.1016/j.cej.2017.12.104
S.M. Shin, N.H. Kim, J.S. Sohn, et al., Hydrometallurgy 79 (2005) 172–181. doi: 10.1016/j.hydromet.2005.06.004
Y. Guo, F. Li, H. Zhu, et al., Waste Manage. 51 (2016) 227–233. doi: 10.1016/j.wasman.2015.11.036
Y. Geng, D. Cui, L. Yang, et al., J. Hazard. Mater. 423 (2022) 127000. doi: 10.1016/j.jhazmat.2021.127000
J. Liu, H. Shi, X. Hu, et al., Sci. Total. Environ. 816 (2021) 151621. doi: 10.1109/access.2021.3125841
J. Zhang, X. Li, D. Song, et al., J. Power. Sources 390 (2018) 38–44. doi: 10.3390/md16010038
Y. Yang, S. Song, S. Lei, et al., Waste Manage. 85 (2019) 529–537. doi: 10.1016/j.wasman.2019.01.008
C. Yi, Y. Yang, T. Zhang, et al., J. Clean. Prod. 277 (2020) 123585. doi: 10.1016/j.jclepro.2020.123585
J. Yu, Y. He, Z. Ge, et al., Sep. Purif. Technol. 190 (2018) 45–52. doi: 10.1016/j.seppur.2017.08.049
Y. Zhang, X. Guo, Y. Yao, et al., ACS Appl. Mater. Inter. 8 (2016) 2905–2909. doi: 10.1021/acsami.5b10628
T. Zhao, Y. Yao, M. Wang, et al., ACS Appl. Mater. Inter. 9 (2017) 25369–25376. doi: 10.1021/acsami.7b07882
S. Natarajan, S.R. Ede, H.C. Bajaj, et al., Colloid. Surface A 543 (2018) 98–108. doi: 10.1016/j.colsurfa.2018.01.054
W. Zhang, Z. Liu, J. Xia, et al., Front. Environ. Sci. Eng. 11 (2017) 1–8.
Z. Geng, J. Liu, Y. Geng, et al., New. J. Chem. 42 (2022) 20250–20259. doi: 10.1039/d2nj03628b
Y. Lin, Z.H. Huang, X. Yu, et al., Electrochim. Acta 116 (2014) 170–174. doi: 10.1109/GRC.2014.6982829
C. Menachem, Y. Wang, J. Flowers, et al., J. Power. Sources. 76 (1998) 180–185. doi: 10.1016/S0378-7753(98)00167-0
W. Mao, J. Wang, Z. Xu, et al., Electrochem. Commun. 8 (2006) 1326–1330. doi: 10.1016/j.elecom.2006.06.011
M. Wissler, J. Power. Sources. 156 (2006) 142–150. doi: 10.1016/j.jpowsour.2006.02.064
J.S. Park, M.H. Lee, I.Y. Jeon, et al., ACS Nano 6 (2012) 10770–10775. doi: 10.1021/nn3050227
Z. Chen, W. Wei, W. Zou, et al., Green Chem. 24 (2022) 3208–3217. doi: 10.1039/d1gc04891k
W. Zou, X. Feng, R. Wang, et al., J. Hazard. Mater. 402 (2021) 123583. doi: 10.1016/j.jhazmat.2020.123583
Z. Chen, W. Zou, R. Zheng, et al., Green Chem. 23 (2021) 6538–6547. doi: 10.1039/d1gc01578h
F.A. Kayakool, B. Gangaja, S. Nair, et al., Sustain. Mater. Technol. 28 (2021) e00262.
Z. Ma, Y. Zhuang, Y. Deng, et al., J. Power. Sources. 376 (2018) 91–99. doi: 10.1016/j.jpowsour.2017.11.038
K. Liu, S. Yang, L. Luo, et al., Electrochim. Acta 356 (2020) 136856. doi: 10.1016/j.electacta.2020.136856
S. Rothermel, M. Evertz, J. Kasnatscheew, et al., ChemSusChem 9 (2016) 3473–3484. doi: 10.1002/cssc.201601062
L. Zou, F. Kang, Y.P. Zheng, et al., Electrochim. Acta 54 (2009) 3930–3934. doi: 10.1016/j.electacta.2009.02.012

Figure 1 (a) The synthesis route of MEG. (b) The content of impurity ions in the synthesis process.

Figure 2 SEM images of recycled (a) NG, (b) SG and (c) MEG; TEM images of (d) SG, (f) MEG; edge HR-TEM images of (e) SG and (g) MEG; (h) Raman spectra of SG and MEG.

Figure 3 (a) XRD patterns of SG, natural graphite (NG) and MEG. (b) Fourier infrared spectra of MEG materials. (c) Nitrogen adsorption plots for MEG and SG. (d) Pore size distribution of MEG and SG.

Figure 4 (a) Cyclic voltammetry curves of the first and second cycles of MEG. (b) AC impedance plots for the 1st and 50th circles of MEG.

Figure 5 (a) Rate performance of MEG at 0.1 C, 0.2 C, 0.5 C, 1 C, 3 C; (b) capacity decay and Coulombic efficiency of MEG at 1 C after 100 cycles; (c) SG at 0.1 C, rate performance at 0.2 C, 0.5 C, 1 C, 3 C. (d) Capacity decay and Coulombic efficiency of SG after 50 cycles at 1 C.

Figure 6 (a) GHG emissions in the process of material synthesis in this study. (b) GHG emissions during material synthesis in various recycled lithium-ion batteries as new electrode materials literature.

 扫一扫看文章

扫一扫关注我们
 DownLoad:


 下载:
下载: